
In the high-pressure world of animation and visual effects, studios must balance creativity, timelines, quality, and budgets—every single day. However, when performance data is scattered across Excel files, emails, and manual reports, it becomes nearly impossible to track progress accurately. That is exactly why the Animation & VFX KPI Dashboard in Power BI is a game-changing solution for modern studios.
This ready-to-use Power BI dashboard transforms raw production data into clear, interactive, and actionable insights. Instead of spending hours preparing reports, studios can instantly monitor performance, compare targets vs actuals, and identify trends that impact delivery and profitability. Most importantly, this dashboard is designed using simple Excel data inputs, making it accessible even for non-technical users.
🚀 Key Features of Animation & VFX KPI Dashboard in Power BI
🎯 Centralized KPI Monitoring – Track all animation and VFX KPIs in one professional Power BI dashboard
📊 MTD & YTD Performance Tracking – Monitor Month-to-Date and Year-to-Date performance effortlessly
📈 Target vs Actual Comparison – Instantly identify performance gaps with visual indicators
📅 Previous Year Comparison – Measure improvement trends using CY vs PY analysis
🎛 Interactive Slicers – Filter by Month and KPI Group dynamically
🟢🔴 Performance Icons – Visual up/down indicators for quick decision-making
📉 Trend Analysis Page – Analyze KPI movement using combo charts
📘 KPI Definition Page – Maintain clarity with formula, definition, and KPI type visibility
📦 What’s Inside the Animation & VFX KPI Dashboard in Power BI
This digital product includes a 3-page professionally designed Power BI dashboard:
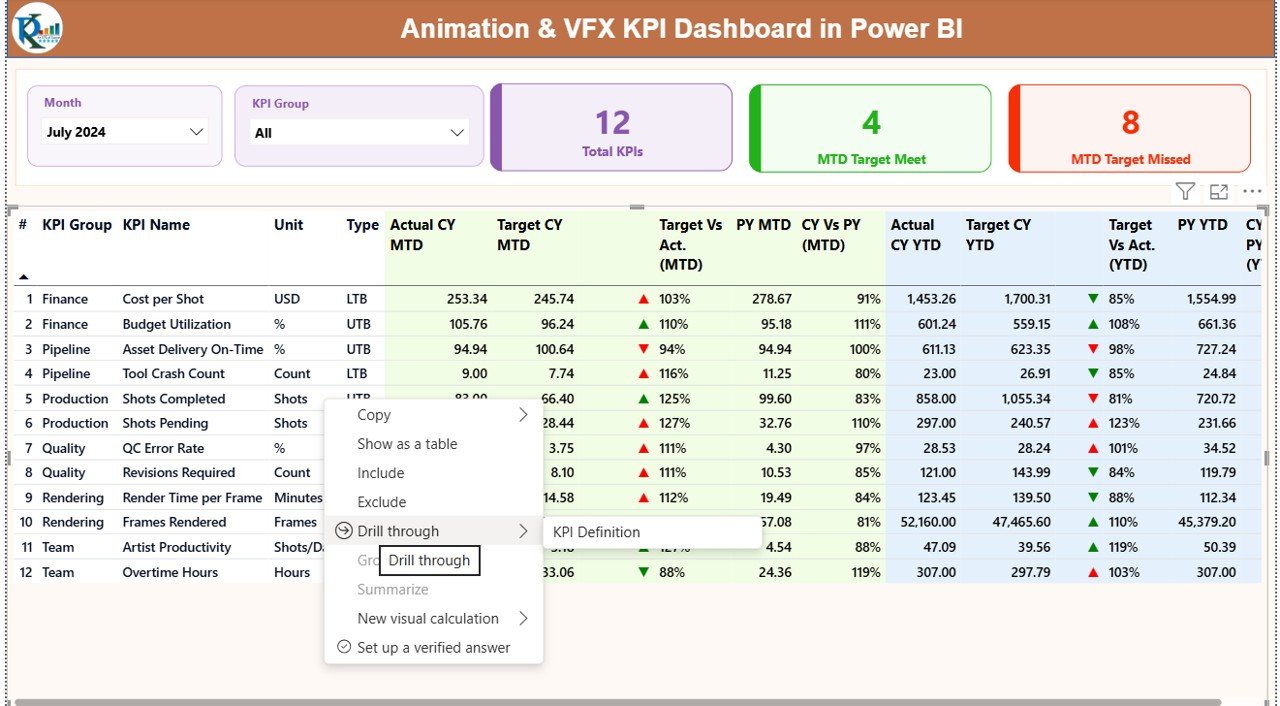
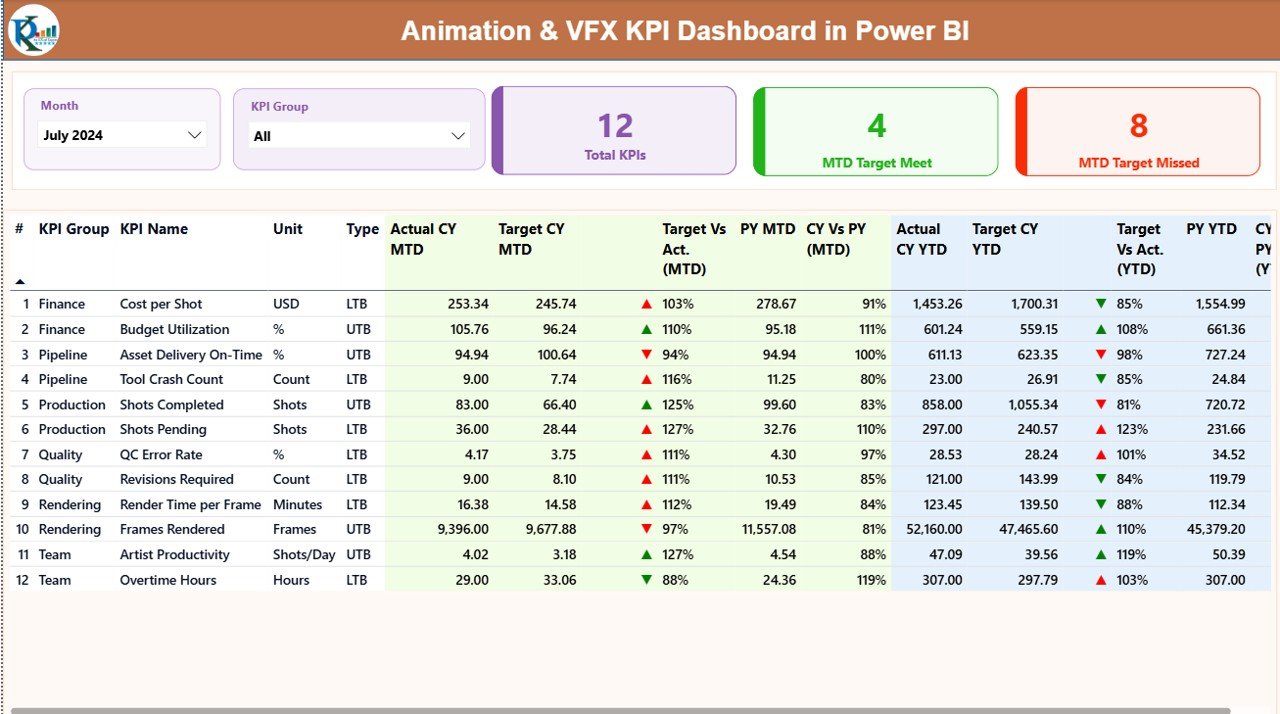
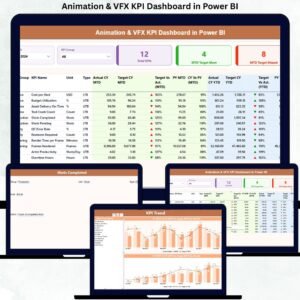
🔹 Summary Page
-
KPI Group & Month slicers
-
KPI Cards: Total KPIs, MTD Target Met, MTD Target Missed
-
Detailed KPI table with MTD, YTD, Target, Previous Year, and performance icons
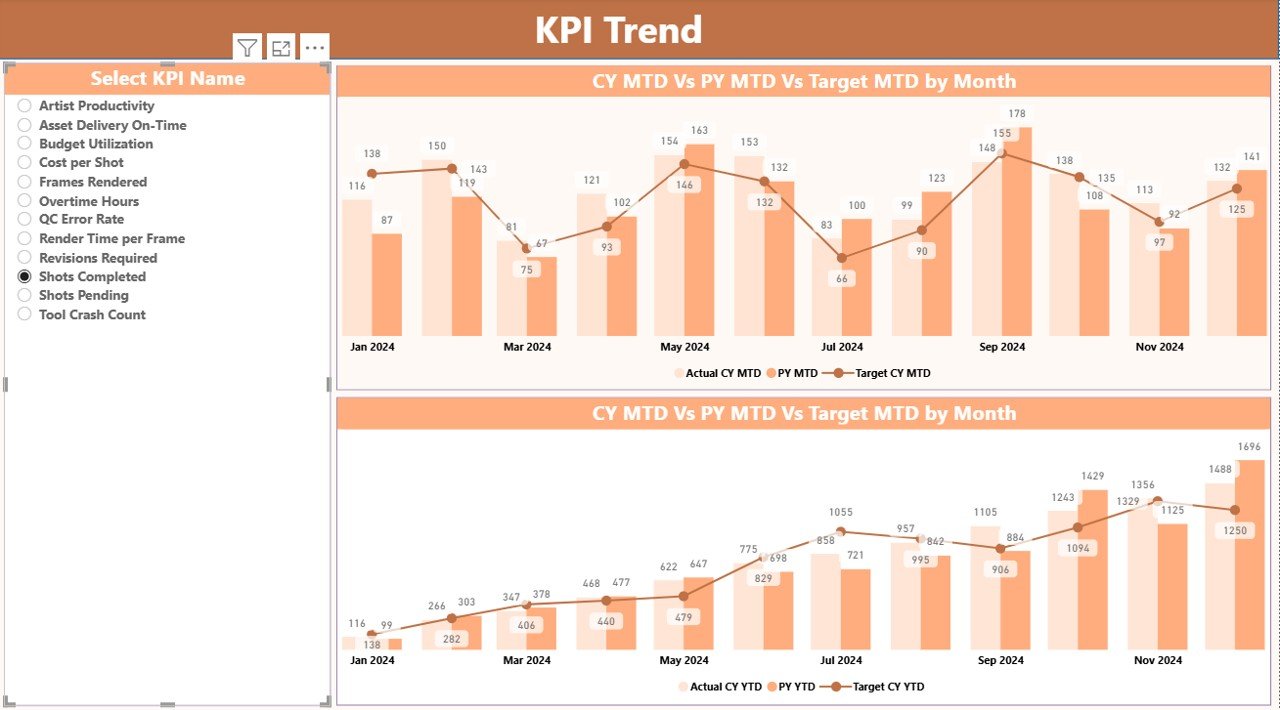
🔹 KPI Trend Page
-
Combo charts for MTD Actual vs Target vs PY
-
Combo charts for YTD Actual vs Target vs PY
-
KPI Name slicer for focused trend analysis
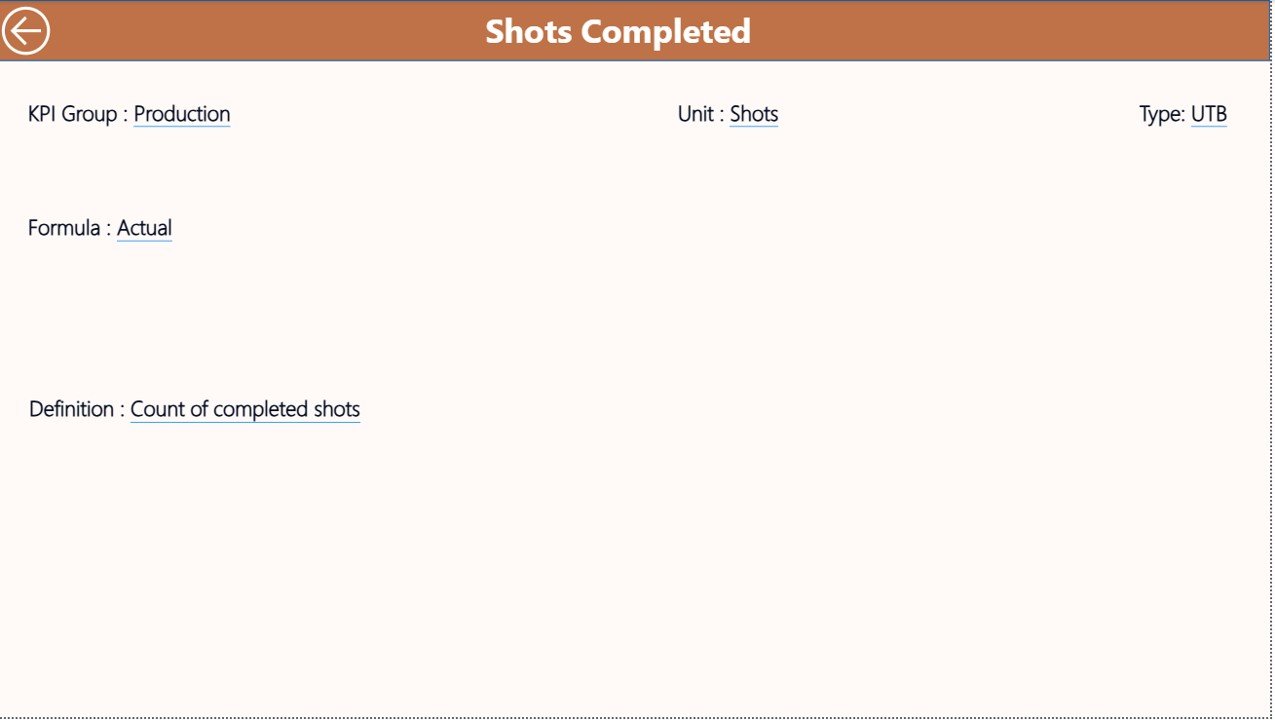
🔹 KPI Definition Page (Drill-through)
-
KPI Formula
-
KPI Definition
-
KPI Type (LTB / UTB)
Additionally, the dashboard connects to a structured Excel data source with:
-
Input_Actual sheet
-
Input_Target sheet
-
KPI Definition sheet
🛠 How to Use the Animation & VFX KPI Dashboard in Power BI
Using this dashboard is simple and user-friendly:
1️⃣ Enter actual KPI values in the Input_Actual Excel sheet
2️⃣ Enter target values in the Input_Target sheet
3️⃣ Define KPIs clearly in the KPI Definition sheet
4️⃣ Refresh the Power BI dashboard
5️⃣ Analyze performance using slicers, tables, and charts
No coding. No complex setup. Just update Excel and refresh Power BI.
👥 Who Can Benefit from This Animation & VFX KPI Dashboard in Power BI
🎬 Animation & VFX Studio Owners
🎥 Production Managers
📅 Project & Delivery Leads
💰 Finance & Cost Control Teams
📊 Operations Managers
✅ Quality Assurance Teams
Whether you run a small creative studio or manage a large VFX production house, this dashboard scales perfectly to your needs.
Click here to read the Detailed blog post
Watch the step-by-step video tutorial:
Visit our YouTube channel to learn step-by-step video tutorials
Youtube.com/@PKAnExcelExpert


Reviews
There are no reviews yet.