Managing a shopping mall is not just about maintaining shops and footfall—it’s about running a highly dynamic ecosystem. Every day, multiple activities happen simultaneously across retail stores, food courts, entertainment zones, facilities, housekeeping, security, and parking. Because of this complexity, mall managers need fast, accurate, and reliable insights.
The Mall Management KPI Dashboard in Excel solves this challenge brilliantly. It converts raw numbers into smart visuals, helping managers track occupancy, revenue, expenses, performance ratios, tenant trends, marketing effectiveness, and operational efficiency—all in one dashboard. No coding, no advanced tools—just simple Excel.
This dashboard is perfect for mall managers, operations teams, finance departments, marketing staff, and senior leadership who want quick clarity and better decision-making power.
✨ What Is the Mall Management KPI Dashboard in Excel?
The Mall Management KPI Dashboard in Excel is a ready-to-use performance tracking system that updates automatically when you change data. It reads inputs from organized sheets and displays:
-
Monthly performance (MTD)
-
Yearly performance (YTD)
-
Target achievements
-
Previous year comparisons
-
Trend insights
-
KPI definitions
Whether you manage a single mall or multiple locations, this dashboard gives you accurate numbers and deep insights instantly.
Key Features of the Mall Management KPI Dashboard in Excel
(Designed for operations, leasing, finance & marketing teams)
🌟 1. Fully Automated Dashboard
Just select a month—Excel updates every KPI, chart, and comparison instantly.
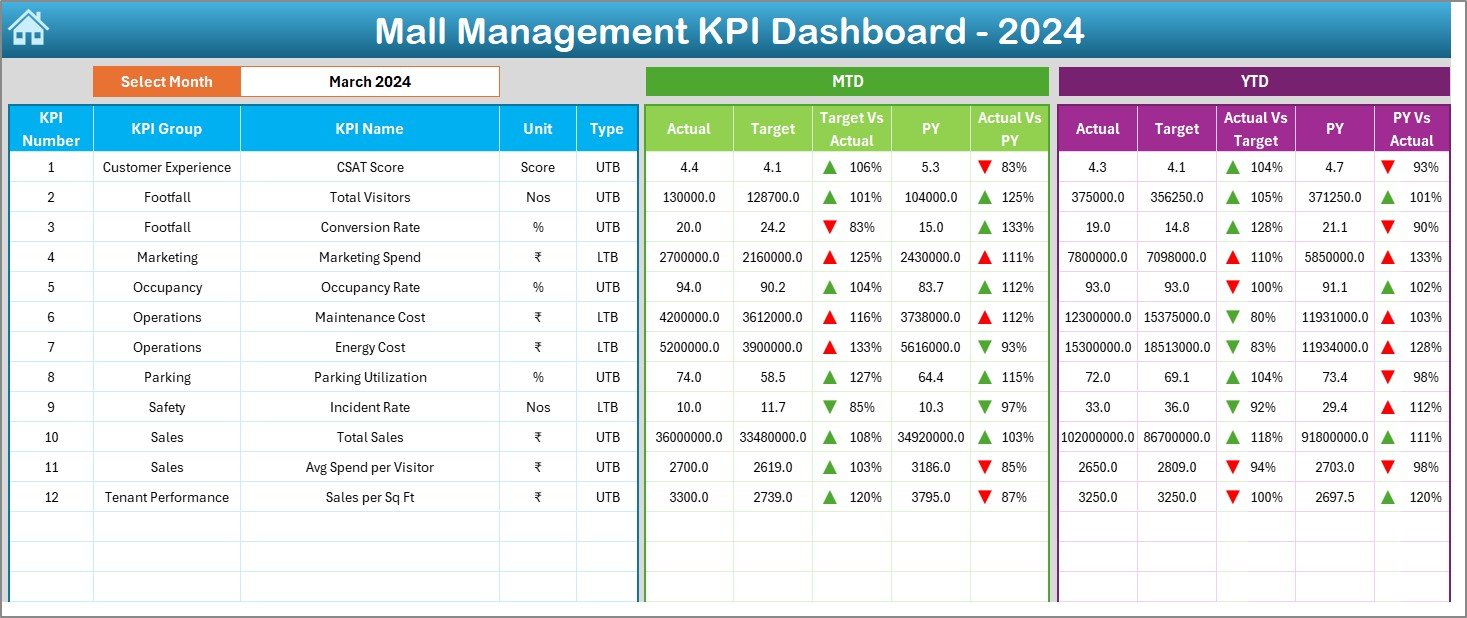
🎯 2. MTD & YTD KPI Performance
View:
-
Actuals
-
Targets
-
Previous year values
-
Performance percentage
-
Green ▲ or Red ▼ indicators
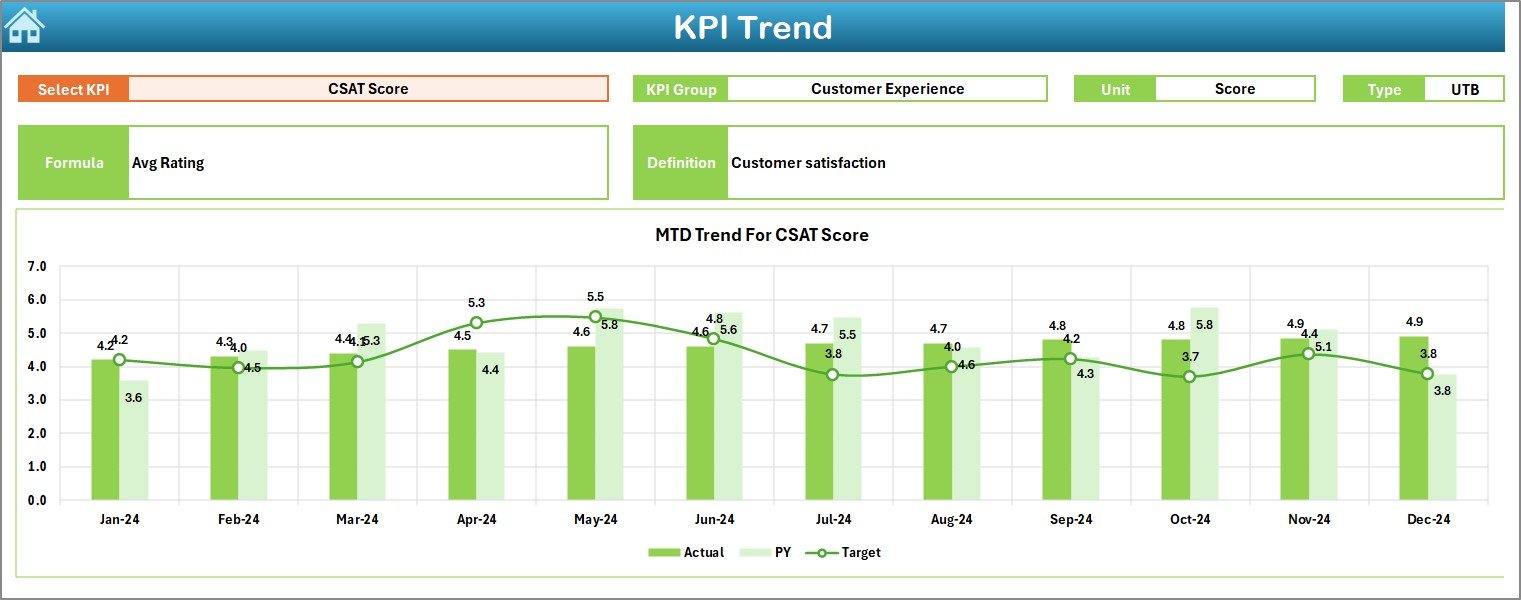
📈 3. KPI Trend Analysis Page
Shows Actual vs Target vs Previous Year for each KPI—great for identifying patterns and issues early.
🗂️ 4. Structured Input Sheets
Separate sheets for:
-
Actual numbers
-
Target numbers
-
Previous year numbers
-
KPI definitions
🧭 5. Easy Navigation with Home Page
Buttons help you jump to any sheet without searching manually.
🧮 6. Built-in KPI Formulas
All calculations are automated—no need to write formulas every month.
🎨 7. Clean, Professional, Easy-to-Read Design
Color coding and arrows make interpretation simple.
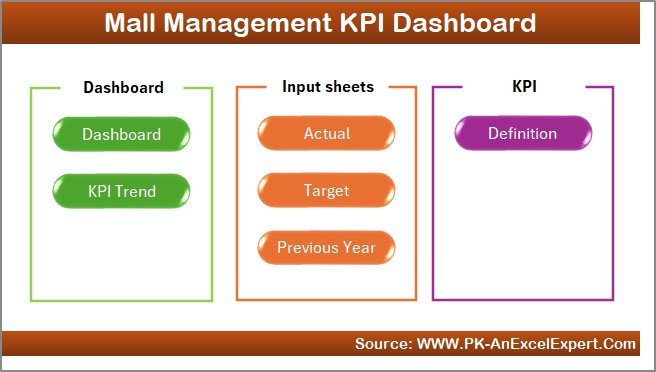
## What’s Inside the Mall Management KPI Dashboard?
📌 1. Home Page
A clean navigation menu with quick buttons to all major sheets.
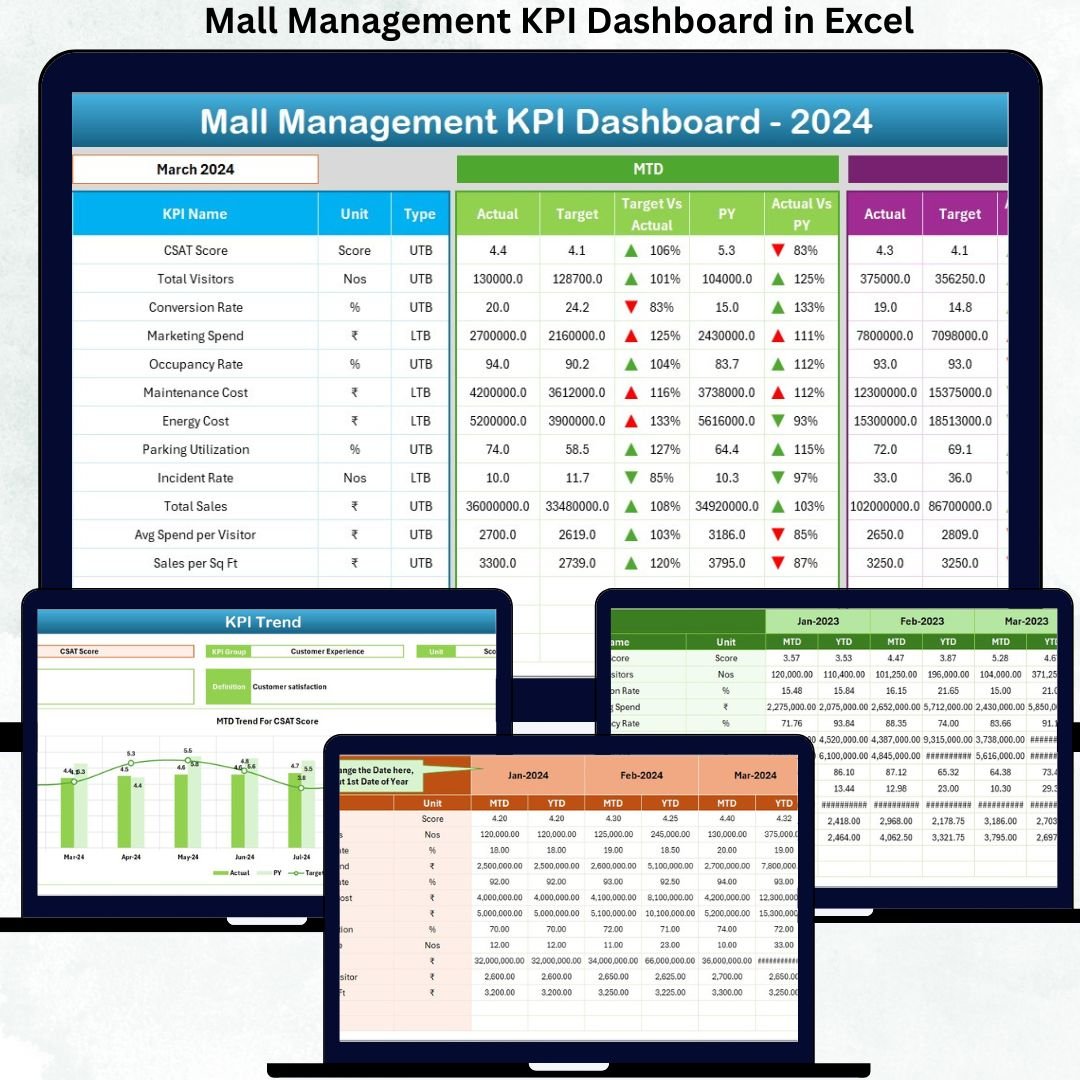
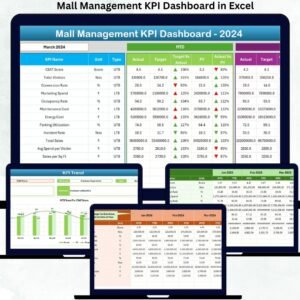
📌 2. Dashboard Sheet
The heart of the system, showing:
-
MTD Actual, Target, PY values
-
YTD Actual, Target, PY values
-
KPI comparison charts
-
Performance indicators
📌 3. KPI Trend Page
Shows month-wise trends with:
-
MTD Chart
-
YTD Chart
-
KPI info panel
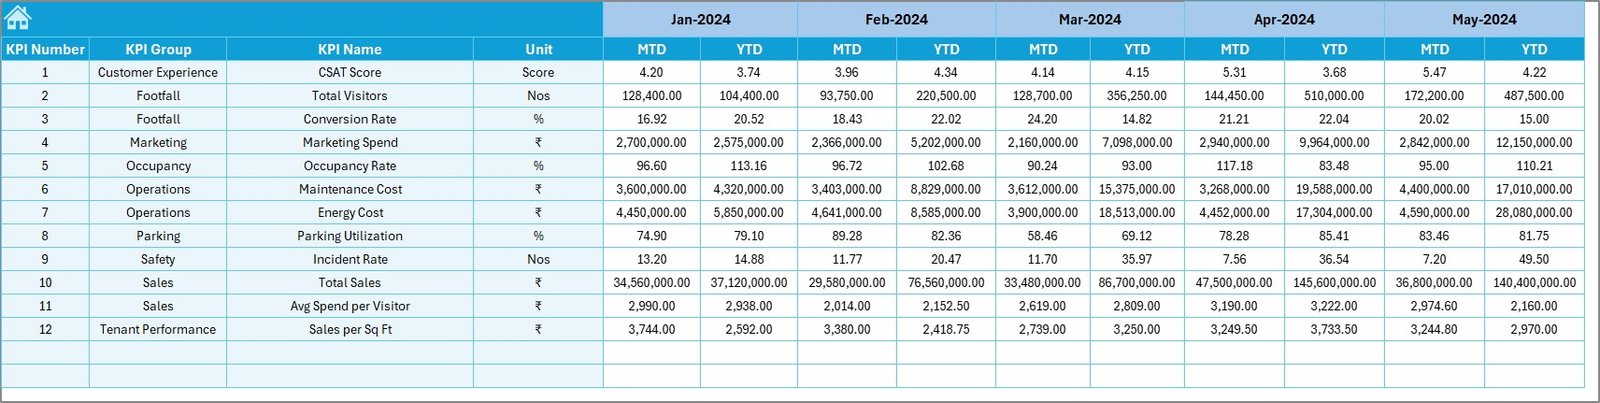
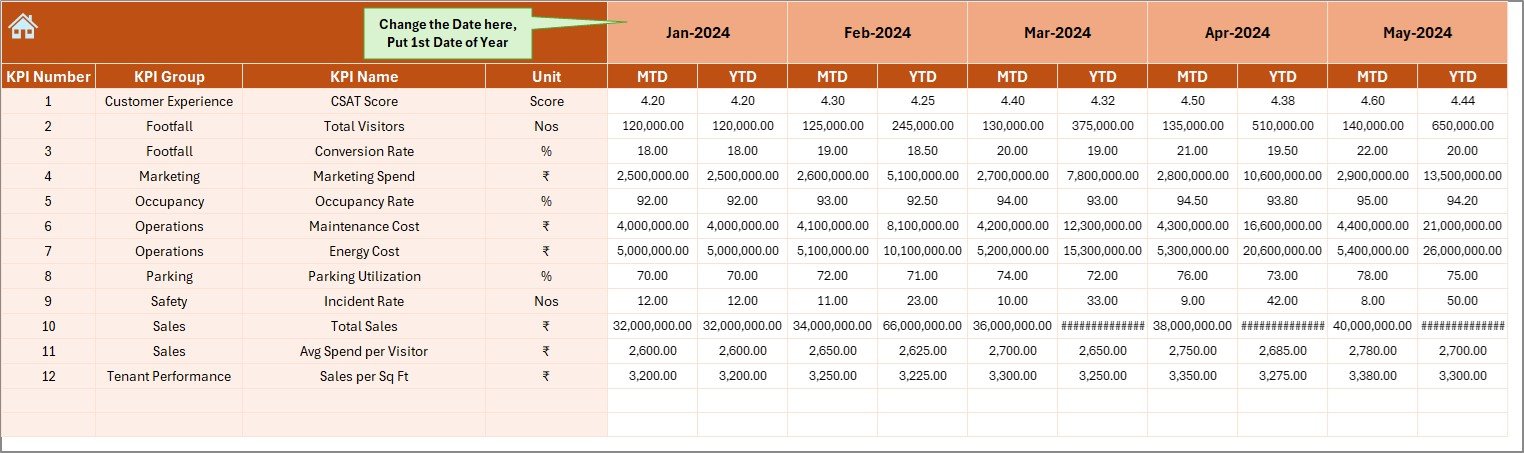
📌 4. Actual Numbers Input Sheet
Enter monthly MTD & YTD actual values.
📌 5. Target Sheet
Enter targets for every KPI month-wise.
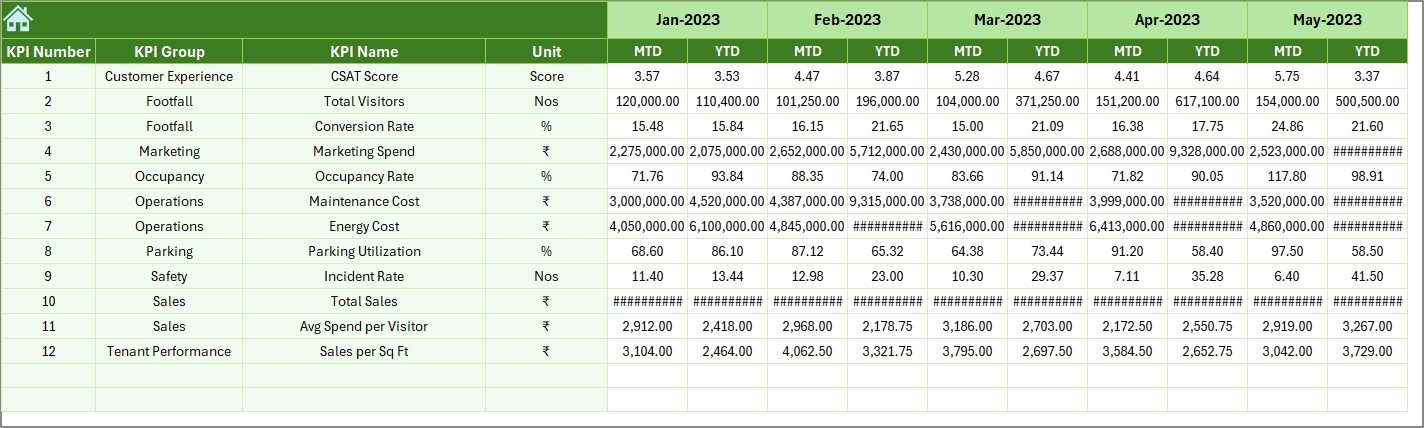
📌 6. Previous Year Sheet
Store last year’s performance numbers to measure growth.
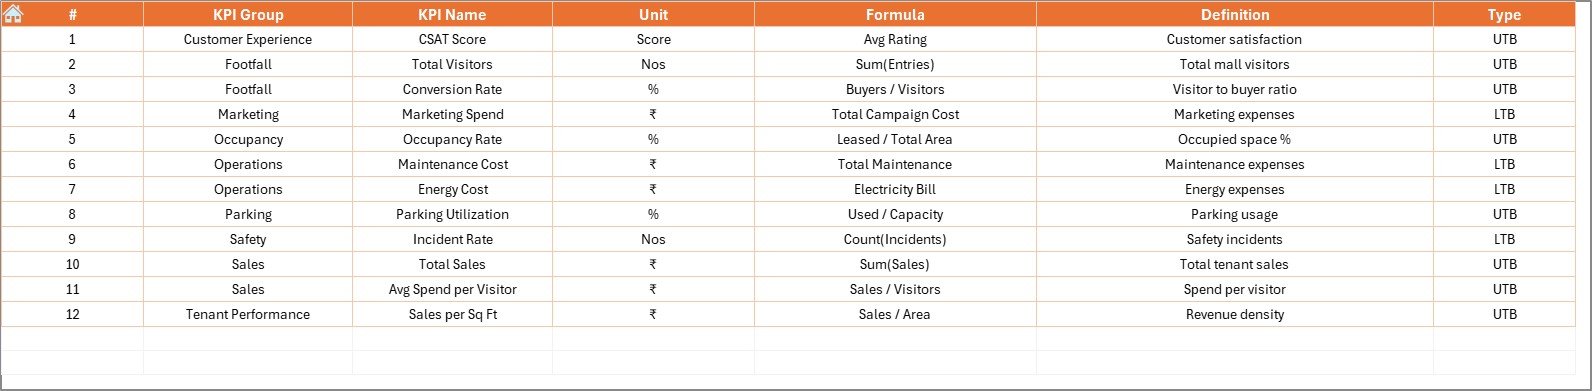
📌 7. KPI Definition Sheet
Contains:
-
KPI Name
-
Group
-
Unit
-
Formula
-
Definition
This ensures consistent understanding across departments.
## How to Use the Mall Management KPI Dashboard?
✔️ Step 1: Update Actuals
Enter actual MTD and YTD values in the Actual Numbers sheet.
✔️ Step 2: Update Targets
Fill monthly targets in the Target sheet.
✔️ Step 3: Fill Previous Year Data
Add past year MTD and YTD numbers.
✔️ Step 4: Select a Month on Dashboard
Go to Dashboard → Select Month → Get instant insights.
✔️ Step 5: Review Trends & Definitions
Use the Trend page for patterns and the Definition page for clarity.
Who Can Benefit from This Mall Management KPI Dashboard?
🏬 Mall Managers
Monitor operational performance instantly.
📊 Leasing Teams
Track occupancy, tenant performance, rental revenue.
💼 Finance Departments
Measure expenses, revenue, YTD trends, and financial growth.
🎤 Marketing Teams
Evaluate event impact, footfall improvements, and ROI.
🔐 Security & Facility Management
Track operational KPIs with accuracy.
🎯 Senior Leadership
Get real-time clarity for strategic decisions.


Reviews
There are no reviews yet.