Managing treasury operations without real-time visibility often leads to cash mismatches, liquidity risks, delayed decisions, and missed optimization opportunities. Although most finance teams rely heavily on Excel, raw spreadsheets rarely provide the clarity needed for fast and confident treasury decisions.
That is exactly why the Treasury Operations KPI Dashboard in Excel becomes a must-have performance management tool for modern finance and treasury teams.
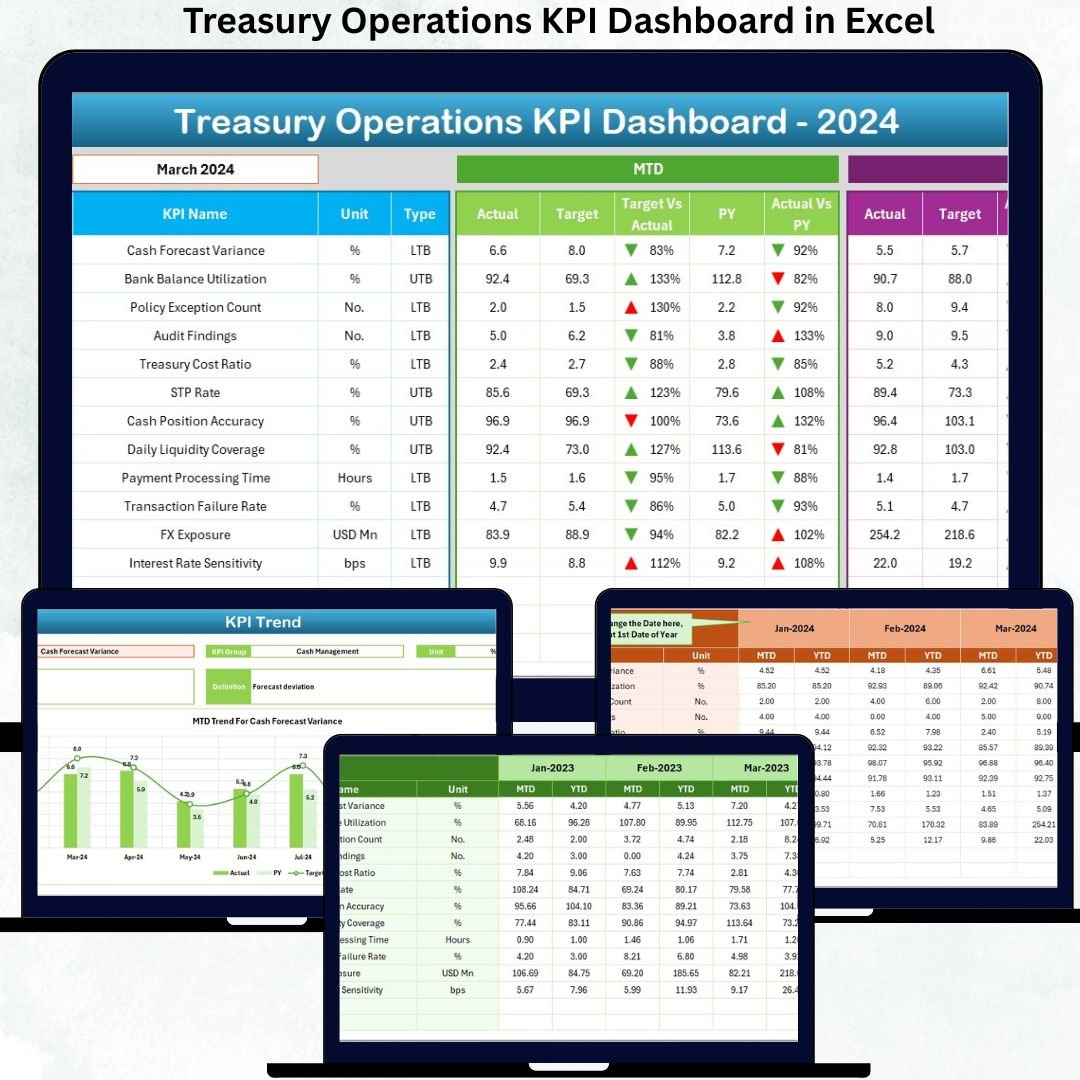
This ready-to-use Excel dashboard converts complex treasury data into structured KPIs, clear comparisons, and trend-driven insights. Instead of wasting hours preparing monthly reports, treasury teams can focus on cash optimization, liquidity control, and strategic planning—all from a single Excel file.
Built entirely in Microsoft Excel, this dashboard is powerful, flexible, and easy to adopt—no Power BI, no coding, no complex tools required.
💰 Key Features of Treasury Operations KPI Dashboard in Excel
📊 All Treasury KPIs in One Place – Centralized performance monitoring
🎯 MTD & YTD Performance Tracking – Short-term and long-term visibility
📌 Actual vs Target Comparison – Instantly identify gaps
📉 Previous Year Benchmarking – Monitor growth and consistency
🔼🔽 Smart Performance Indicators – Visual up/down arrows for clarity
📈 Trend Analysis by KPI – Identify seasonality and performance direction
🧭 Easy Navigation with Home Page – One-click worksheet access
🧮 100% Excel-Based Solution – Simple, fast, and customizable
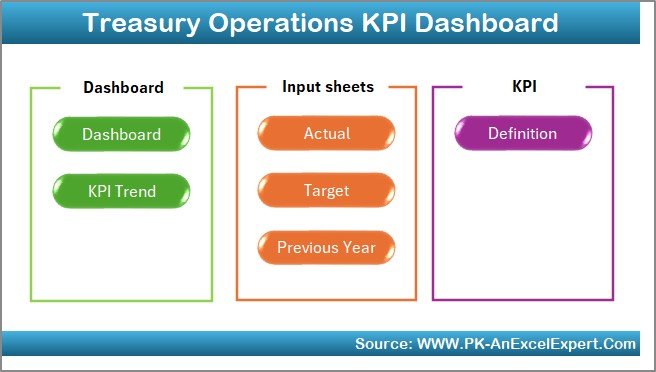
📦 What’s Inside the Treasury Operations KPI Dashboard
This dashboard contains 7 professionally structured worksheets, each designed to support effective treasury reporting and analysis.
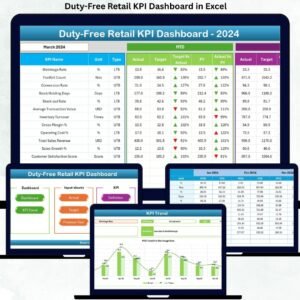
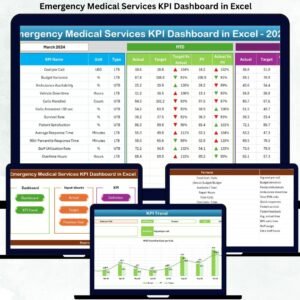
🏠 Home Sheet
A clean navigation page with six clickable buttons that instantly take users to key sections of the dashboard.
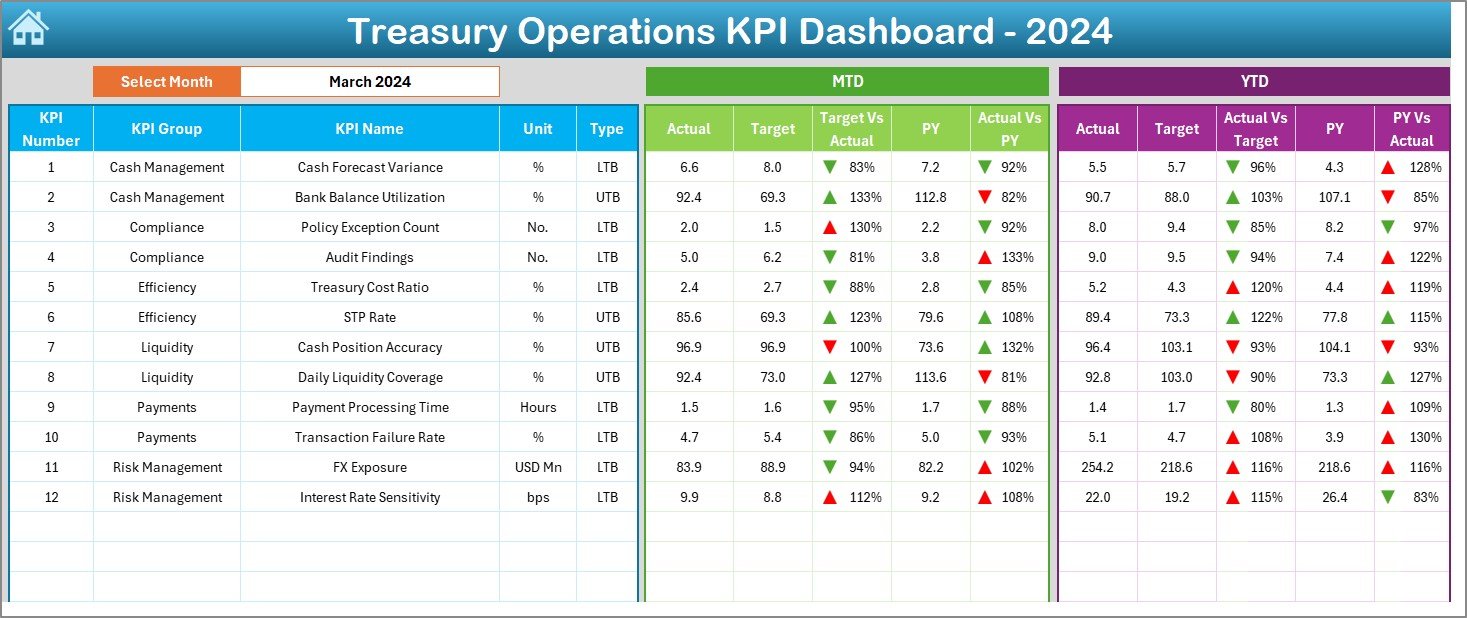
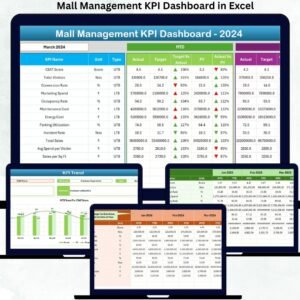
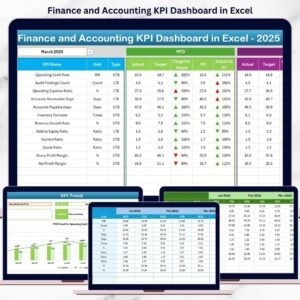
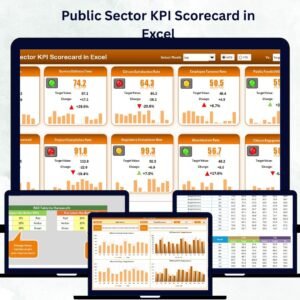
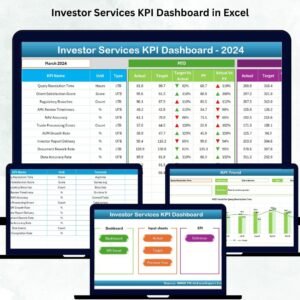
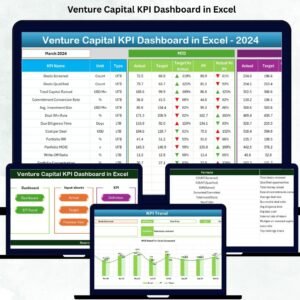
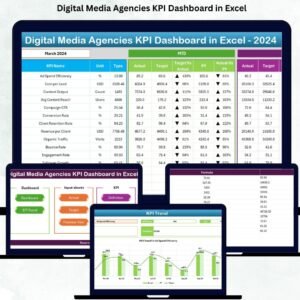
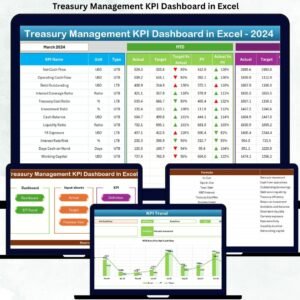
📋 Dashboard Sheet
The core performance view where users select a month from a drop-down and instantly see:
-
MTD Actual, Target & Previous Year
-
YTD Actual, Target & Previous Year
-
Target vs Actual (%)
-
Previous Year vs Actual (%)
-
▲ / ▼ performance indicators
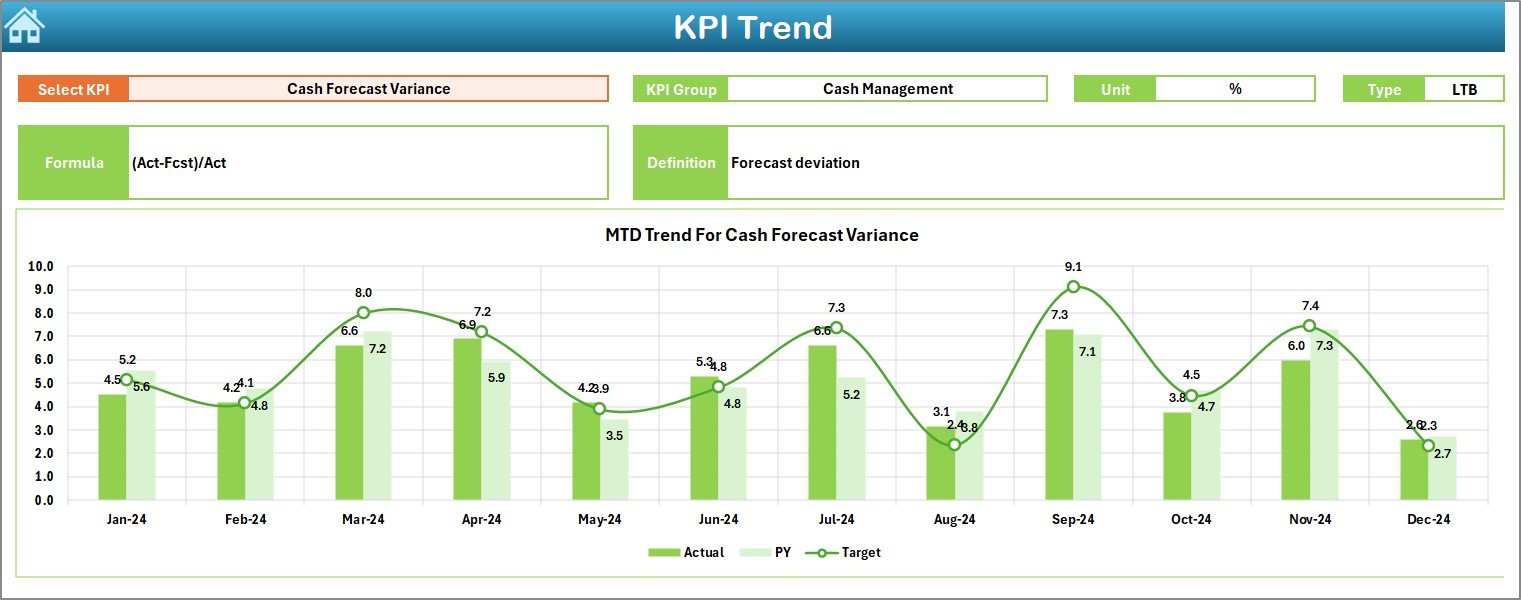
📈 KPI Trend Sheet
Analyze treasury KPI behavior over time using:
-
MTD trend chart
-
YTD trend chart
-
Actual vs Target vs Previous Year comparison
Detailed KPI info including Unit, Type, Formula, and Definition is also displayed.
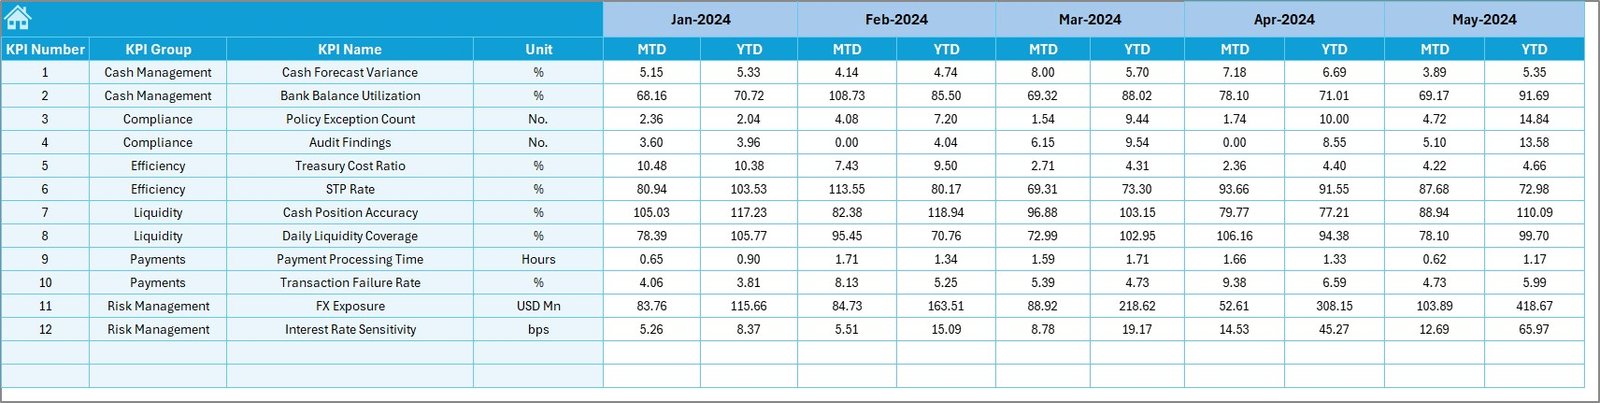
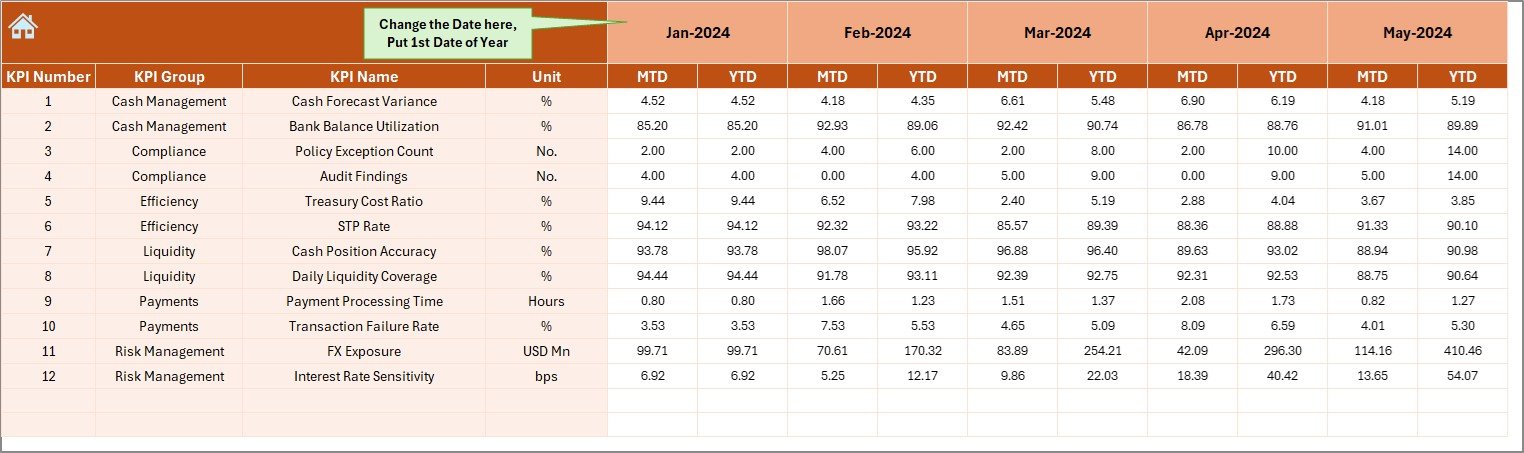
✏️ Actual Numbers Input Sheet
Simple data entry sheet for updating MTD and YTD actual values.
🎯 Target Sheet
Maintain monthly and yearly targets separately for accurate comparison.
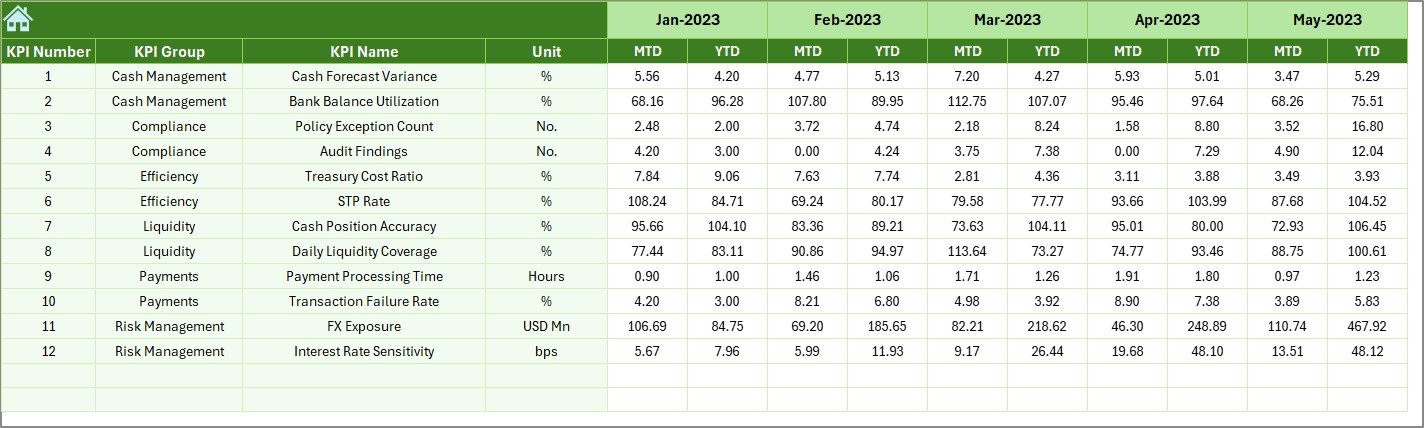
📊 Previous Year Number Sheet
Stores historical data to support year-over-year analysis.
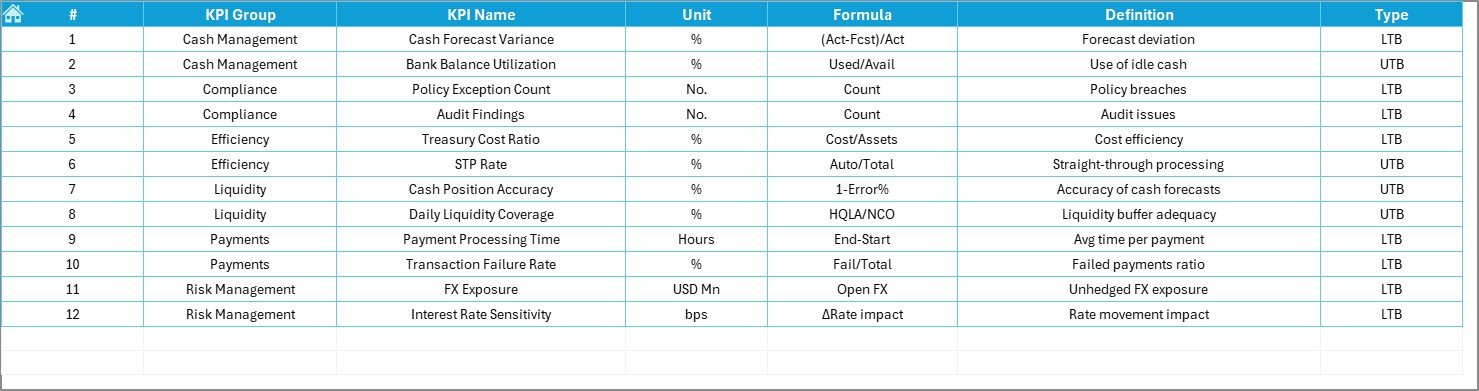
📘 KPI Definition Sheet
The master reference defining:
-
KPI Name
-
KPI Group
-
Unit
-
Formula
-
Definition
This ensures standardization, clarity, and transparency.
🛠️ How to Use the Treasury Operations KPI Dashboard
✅ Step 1: Enter actual treasury data in Actual Numbers Input
✅ Step 2: Maintain targets in Target Sheet
✅ Step 3: Update historical data in Previous Year Numbers
✅ Step 4: Select a month from the dashboard drop-down
✅ Step 5: Analyze KPIs, trends, and gaps instantly
No manual calculations. No complex setup. Just clean insights.
👥 Who Can Benefit from This Dashboard?
💼 Treasury Teams
📊 Finance & FP&A Professionals
🏦 Corporate Finance Departments
📈 CFOs & Finance Leaders
🧾 Risk & Liquidity Management Teams
🏢 Organizations of All Sizes
If cash clarity and financial control matter to you, this dashboard is built for your needs.
🔗 Click here to read the Detailed blog post
🎥 Visit our YouTube channel to learn step-by-step video tutorials


Reviews
There are no reviews yet.