
In today’s high-stakes real estate market, valuation accuracy is everything. Even a small deviation in pricing assumptions, target tracking, or trend analysis can lead to missed investment opportunities or increased risk. Yet many organizations still depend on fragmented spreadsheets and static reports that hide critical insights.
The Real Estate Valuation KPI Dashboard in Power BI solves this exact problem. It transforms raw valuation data into clear, interactive, and decision-ready insights that help valuation teams, analysts, and leadership track targets, actuals, and trends from a single powerful dashboard.
Built with Excel as the data source and Power BI as the analytics layer, this dashboard delivers the perfect balance of flexibility, scalability, and analytical depth. Instead of spending time compiling reports, teams can focus on interpreting insights, improving valuation accuracy, and making confident property decisions faster.
🚀 Key Features of the Real Estate Valuation KPI Dashboard in Power BI
📊 Centralized Valuation KPI Tracking – Monitor all valuation KPIs in a single view
🎯 MTD & YTD Performance Visibility – Track month-to-date and year-to-date results clearly
✅ Target Achievement Indicators – Instantly spot met and missed KPIs with arrows
📈 Actual vs Target vs Previous Year Comparison – Measure performance objectively
🎛️ Interactive Slicers – Filter analysis by Month and KPI Group
📉 Trend Analysis Charts – Visualize valuation performance over time
🔍 Drill-Through KPI Definitions – View KPI logic, formulas, and explanations
⚡ Fast & Scalable Power BI Model – Works efficiently even with growing datasets
📦 What’s Inside the Real Estate Valuation KPI Dashboard
This Power BI solution includes three purpose-built analytical pages designed for clarity and confidence:
🟢 Summary Page
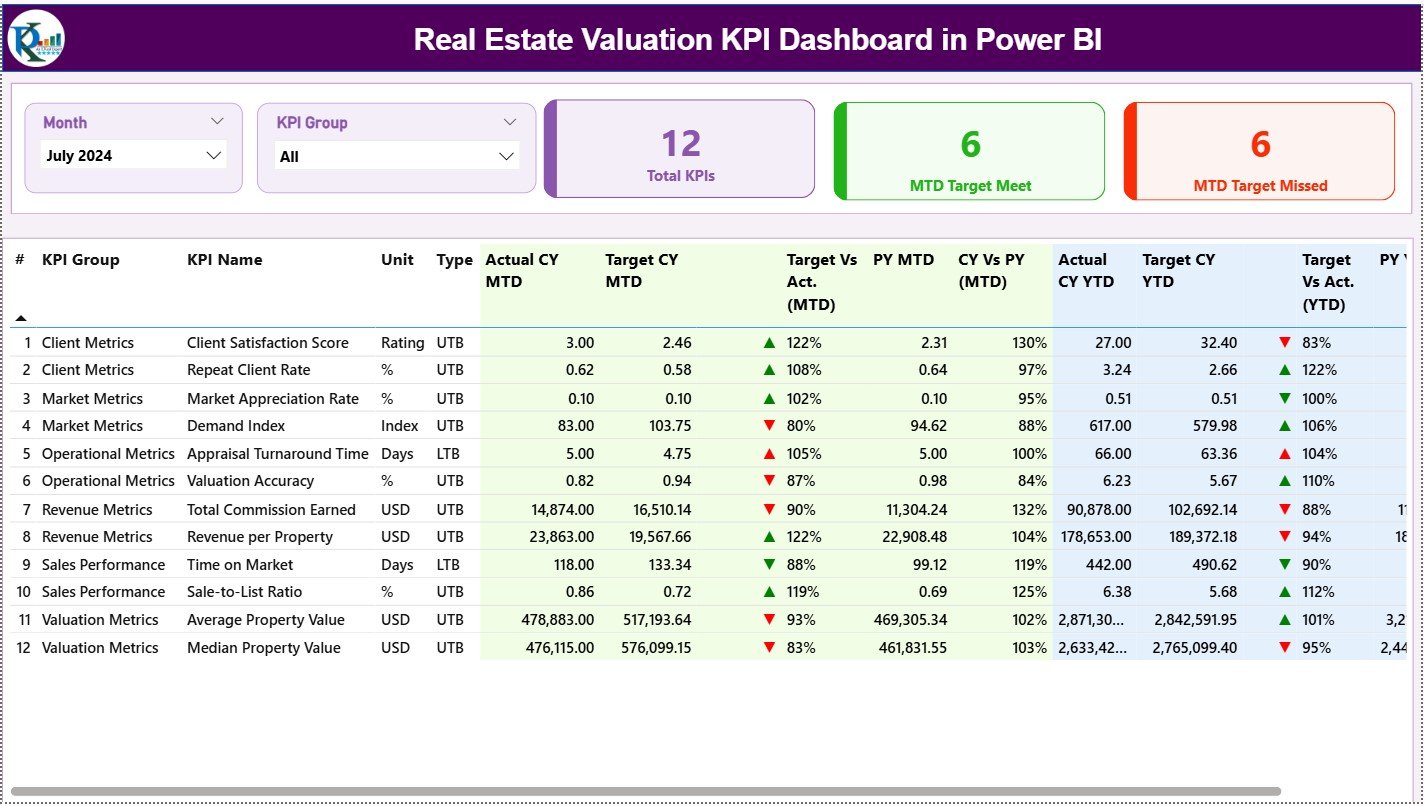
The main control panel of the dashboard. It shows KPI cards for Total KPIs, MTD Target Met, and MTD Target Missed. A detailed performance table displays MTD and YTD Actual, Target, Previous Year values, and comparison ratios—helping users assess short-term and long-term performance together.
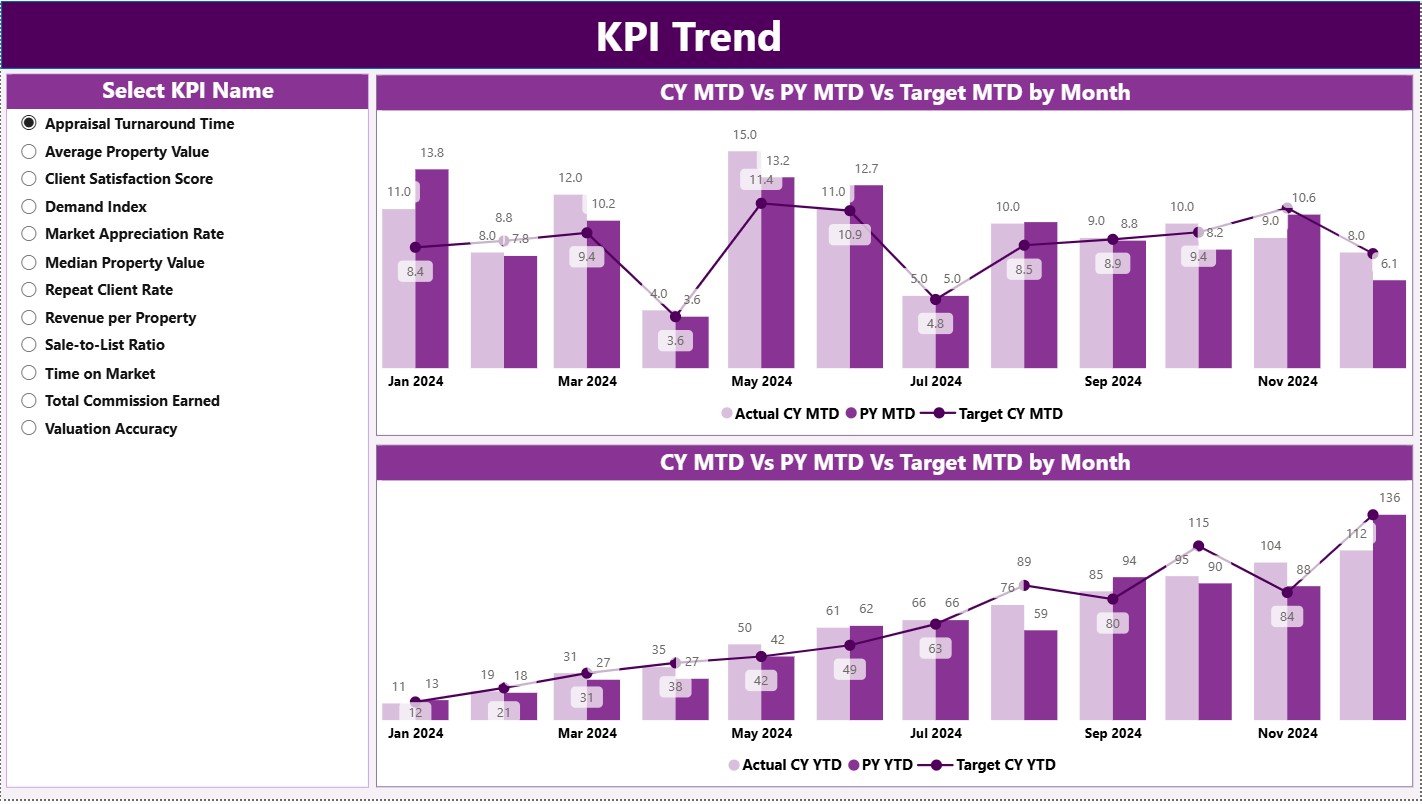
📉 KPI Trend Page
Designed for time-based analysis. Users select any KPI from the slicer and instantly view MTD and YTD combo charts comparing Actuals, Targets, and Previous Year values. This page highlights growth, decline, and valuation consistency.
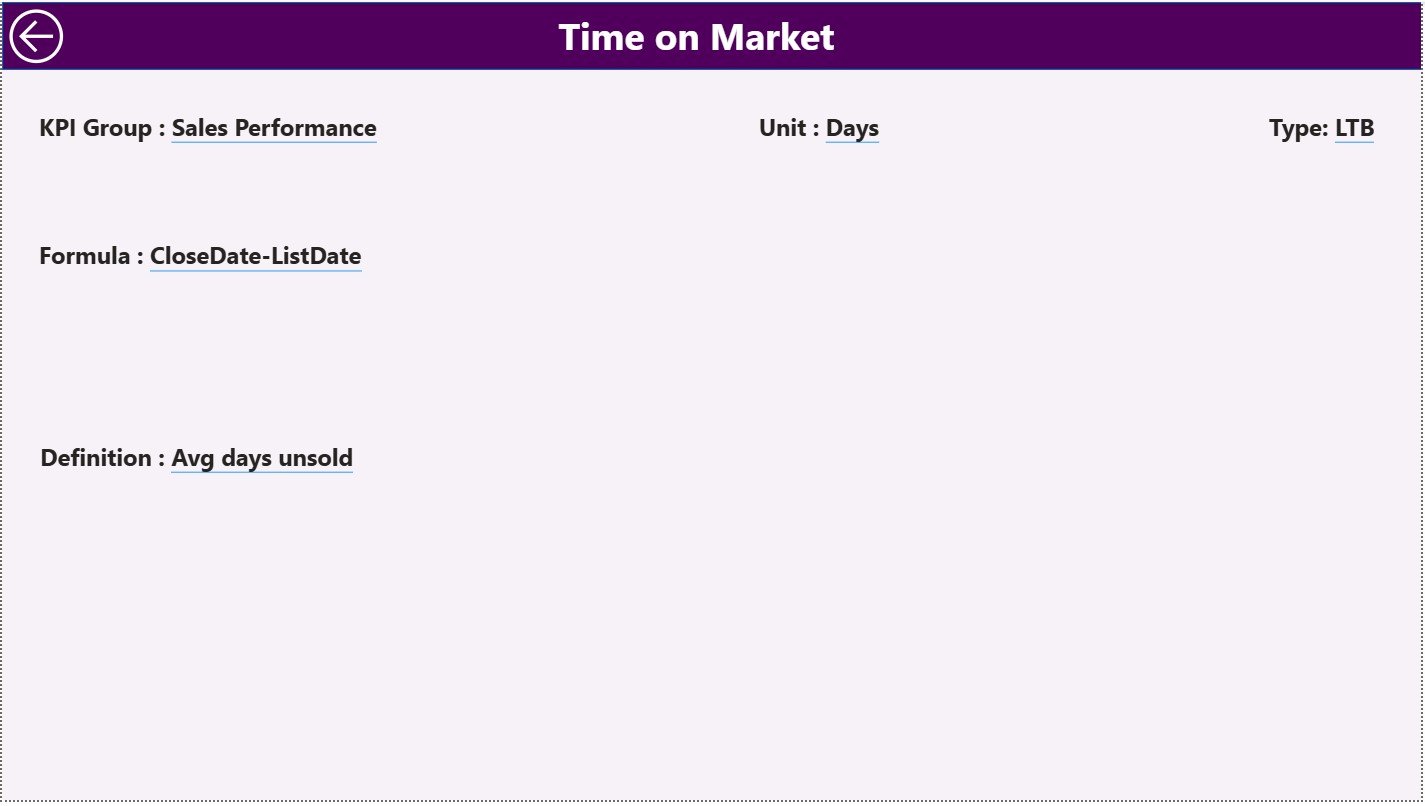
📘 KPI Definition Page
A drill-through transparency page. It displays KPI Formula, Definition, and performance logic. A back button allows smooth navigation back to the Summary Page.
The dashboard is powered by three structured Excel input sheets:
-
Input Actual – Stores MTD and YTD actual values
-
Input Target – Maintains MTD and YTD targets
-
KPI Definition – Controls KPI logic, grouping, and type
🛠️ How to Use the Real Estate Valuation KPI Dashboard
✅ Step 1: Update actual values in the Input Actual Excel sheet
✅ Step 2: Maintain target values in the Input Target sheet
✅ Step 3: Define KPIs clearly in the KPI Definition sheet
✅ Step 4: Refresh the Power BI dashboard
✅ Step 5: Analyze KPIs using slicers, tables, and trend charts
No advanced Power BI or technical skills are required. The dashboard is plug-and-play and business-friendly.
👥 Who Can Benefit from This Real Estate Valuation Dashboard?
🏢 Real Estate Valuation Analysts
🏠 Property & Portfolio Managers
📊 Investment & Strategy Teams
💼 Finance & Planning Teams
📈 Business Analysts
👔 Senior Management & Leadership
Any organization seeking accurate valuations and performance transparency will benefit from this dashboard.
🔗 Click here to read the Detailed blog post
🎥 Visit our YouTube channel to learn step-by-step video tutorials


Reviews
There are no reviews yet.