
Investor relationships are built on trust, transparency, and timely information. However, many organizations still struggle with fragmented KPI reports, manual Excel tracking, and inconsistent performance updates. As a result, leadership teams spend more time explaining numbers than discussing strategy. This is exactly why an Investor Relations KPI Dashboard in Power BI becomes an essential solution for modern, data-driven investor reporting.
The Investor Relations KPI Dashboard in Power BI is a ready-to-use analytical dashboard that consolidates all investor-related KPIs into a single, interactive, and decision-ready view. Instead of working with multiple spreadsheets and static reports, you can instantly monitor KPI performance across months, KPI groups, and reporting periods. As a result, investor communication becomes clearer, faster, and far more professional.
This dashboard uses Excel as the data source and Power BI for visualization, which makes maintenance easy while delivering powerful analytics. You update the Excel file, refresh Power BI, and the entire dashboard updates automatically—saving significant time and reducing reporting risk.
✨ Key Features of the Investor Relations KPI Dashboard in Power BI
This professionally designed dashboard includes three powerful analytical pages, built specifically for KPI-driven investor reporting.
⭐ Summary Page – Investor KPI Performance Snapshot
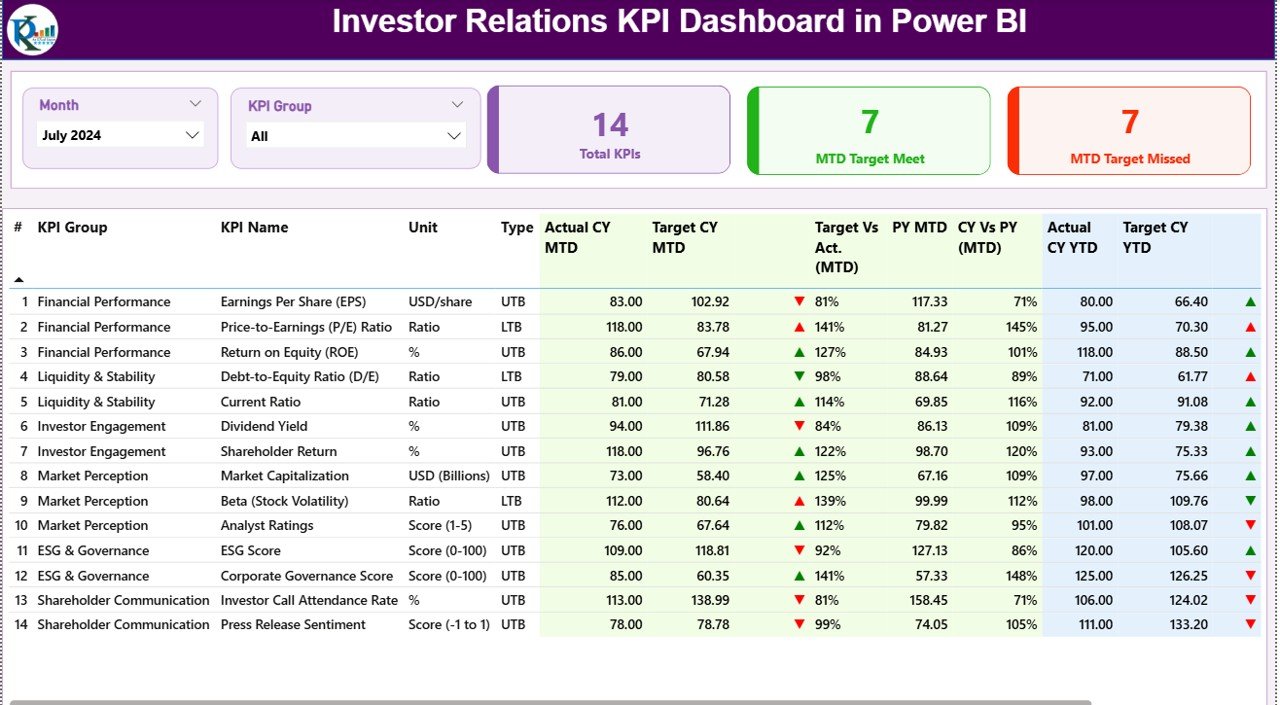
✔ Month slicer to switch reporting periods instantly
✔ KPI Group slicer for category-based analysis
✔ Three KPI cards showing:
-
Total KPI Count
-
MTD Target Met Count
-
MTD Target Missed Count
✔ A detailed KPI performance table with:
-
MTD Actual, Target, Target vs Actual
-
Previous Year comparison
-
YTD Actual, Target, and trend indicators
-
Visual up/down arrows for quick interpretation
This page acts as the primary review screen for leadership and investors.
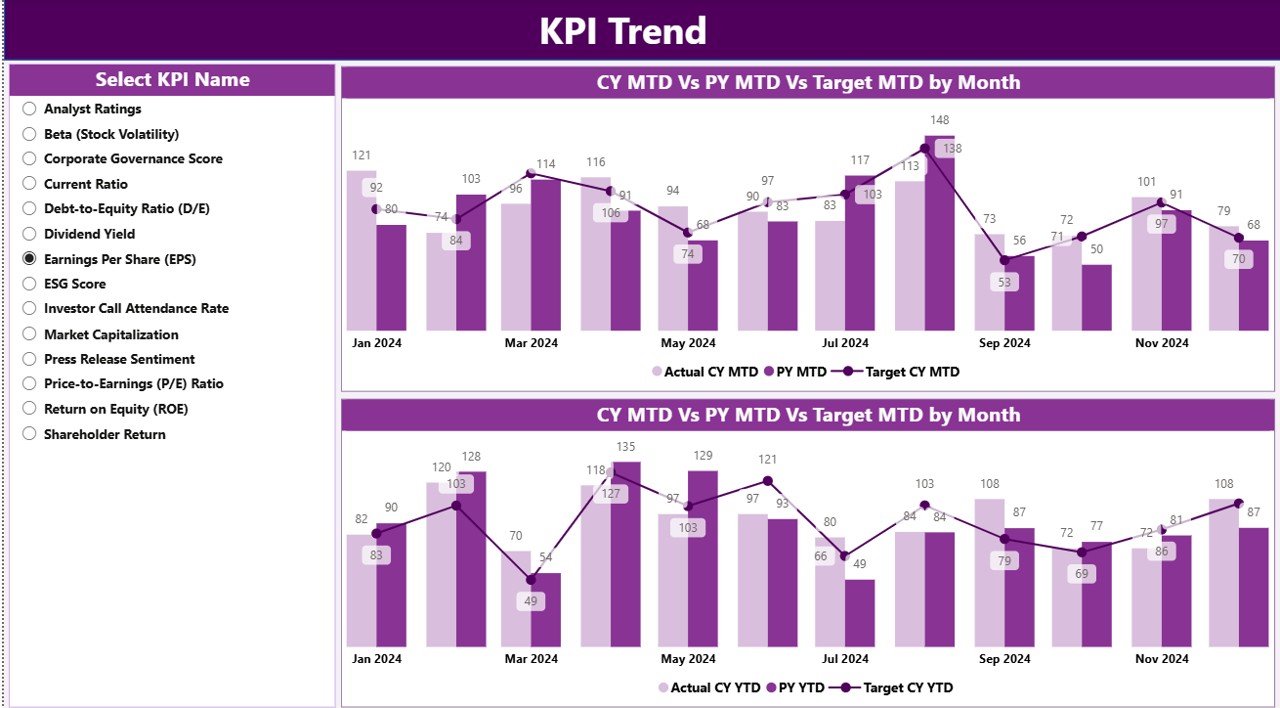
⭐ KPI Trend Page – Performance Movement Over Time
✔ KPI Name slicer to focus on a single KPI
✔ Two combo charts for:
-
MTD trends (Actual CY, PY, Target)
-
YTD trends (Actual CY, PY, Target)
Instead of viewing numbers in isolation, users clearly see performance direction, stability, and risk. This page becomes extremely useful during investor calls and board reviews.
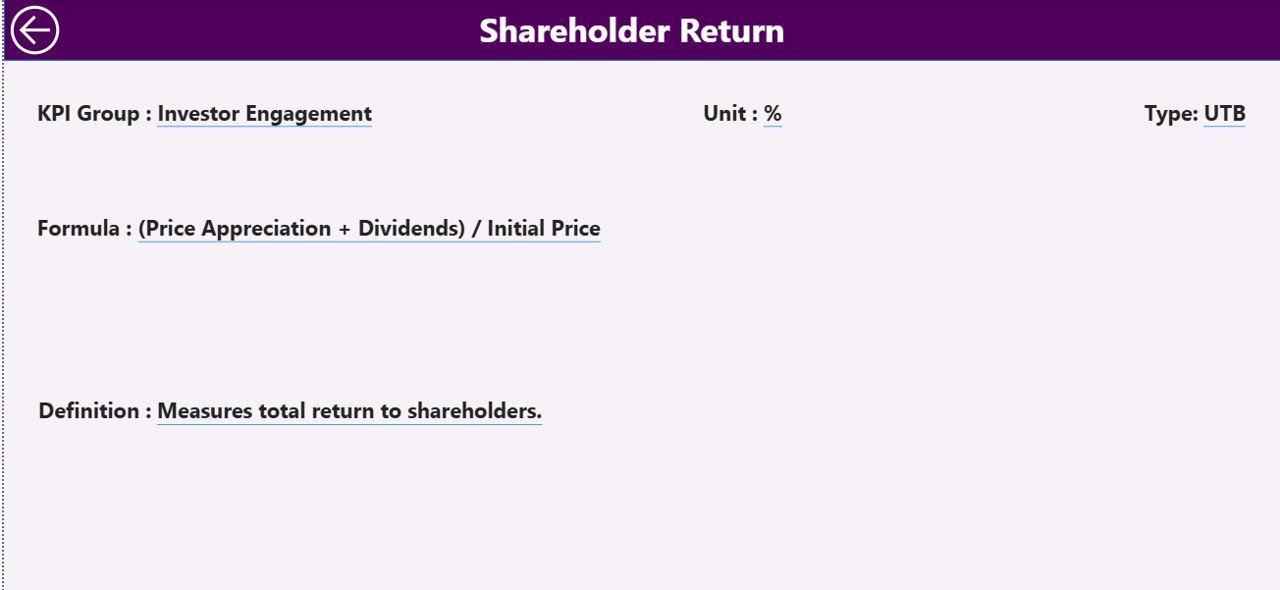
⭐ KPI Definition Page – Transparency & Governance
✔ Hidden drill-through page
✔ Displays:
-
KPI Formula
-
KPI Definition
-
Unit of Measurement
-
KPI Type (LTB / UTB)
Users can right-click from the Summary Page to drill through into definitions and come back with one click. This design keeps the dashboard clean while maintaining full transparency.
📦 What’s Inside the Investor Relations KPI Dashboard in Power BI
When you purchase this product, you get:
✨ A ready-to-use Power BI dashboard (.pbix file)
✨ Three professionally designed pages
✨ Clean KPI status indicators (MTD & YTD)
✨ Interactive slicers for month and KPI group
✨ Trend analysis with combo charts
✨ Excel-based data model with:
-
Input_Actual sheet
-
Input_Target sheet
-
KPI Definition sheet
This structure ensures scalability, control, and audit readiness.
🛠️ How to Use the Investor Relations KPI Dashboard in Power BI
1️⃣ Update KPI values in the Input_Actual Excel sheet
2️⃣ Update monthly targets in the Input_Target sheet
3️⃣ Maintain KPI logic in the KPI Definition sheet
4️⃣ Refresh the Power BI dashboard
5️⃣ Select Month & KPI Group using slicers
6️⃣ Review MTD and YTD status instantly
7️⃣ Use Trend & Definition pages for deeper discussions
No advanced Power BI expertise is required—basic navigation is enough.
👥 Who Can Benefit from This Investor Relations KPI Dashboard in Power BI
This dashboard is ideal for:
✔ Investor Relations Teams
✔ CFOs & Finance Leaders
✔ Board & Executive Management
✔ Strategy & Performance Teams
✔ Listed & Pre-IPO Companies
✔ Organizations with regular investor reporting
Anyone responsible for accurate KPI communication will benefit from this dashboard.
### 📘 Click here to read the Detailed blog post
🎥 Visit our YouTube channel to learn step-by-step video tutorials
👉 Youtube.com/@PKAnExcelExpert


Reviews
There are no reviews yet.