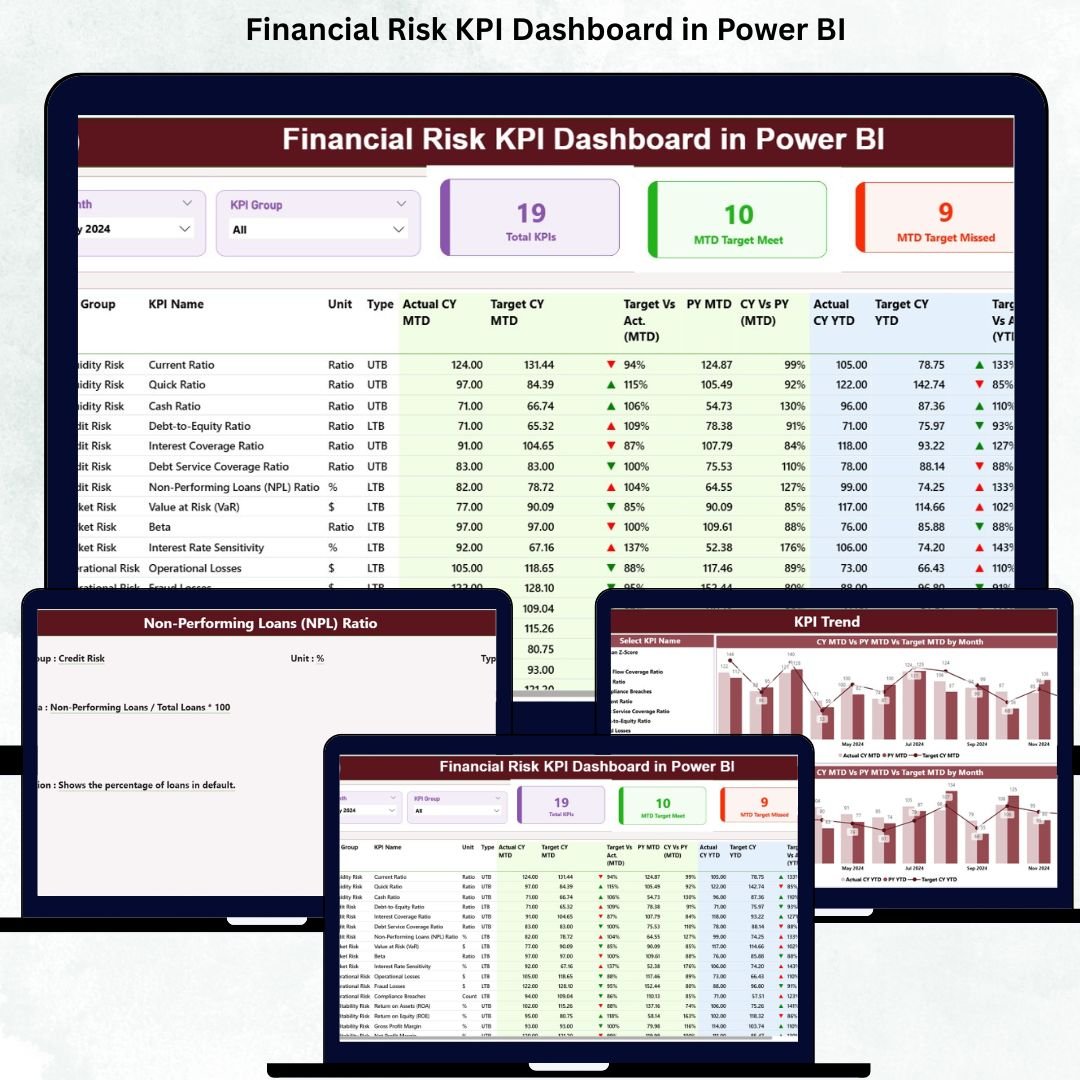
Financial risk can quietly damage business performance if it is not tracked, measured, and managed correctly. Organizations face daily exposure to liquidity risk, credit risk, compliance gaps, cost overruns, volatility, and performance deviations. Many finance teams still rely on disconnected spreadsheets and static reports, which delay decisions and hide early warning signs. This is exactly why a Financial Risk KPI Dashboard in Power BI becomes a mission-critical tool for modern risk management.
The Financial Risk KPI Dashboard in Power BI is a ready-to-use, interactive analytics solution that transforms complex financial risk data into clear, meaningful insights. Built on Power BI and supported by structured Excel input files, this dashboard allows finance leaders, risk managers, controllers, and executives to monitor financial risk performance in real time. With dynamic slicers, trend analysis, KPI status indicators, and drill-through definitions, teams gain full control over both short-term and long-term financial risks.
Instead of spending hours preparing manual reports, your team can focus on analysis, forecasting, and corrective actions. This dashboard ensures transparency, accuracy, and speed—three qualities every finance organization needs to stay resilient.
✨ Key Features of the Financial Risk KPI Dashboard in Power BI
This dashboard is professionally designed with three powerful analytical pages, each supporting a specific decision-making purpose.
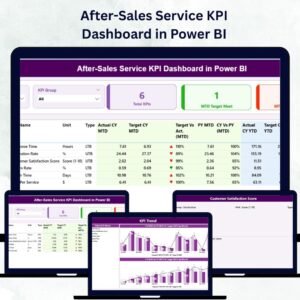
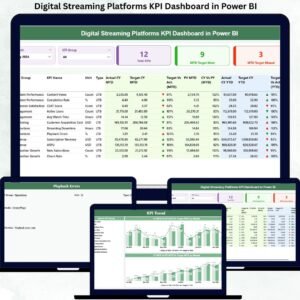
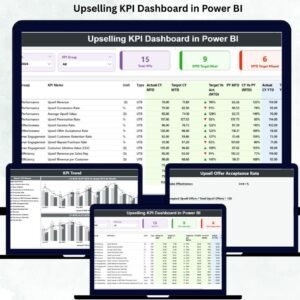
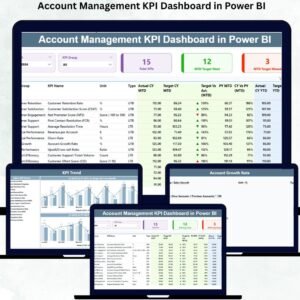
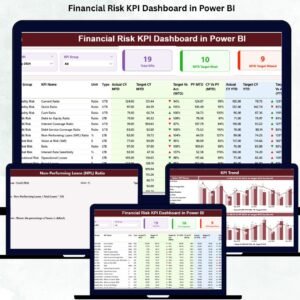
⭐ Summary Page – Executive-Level Financial Risk Overview
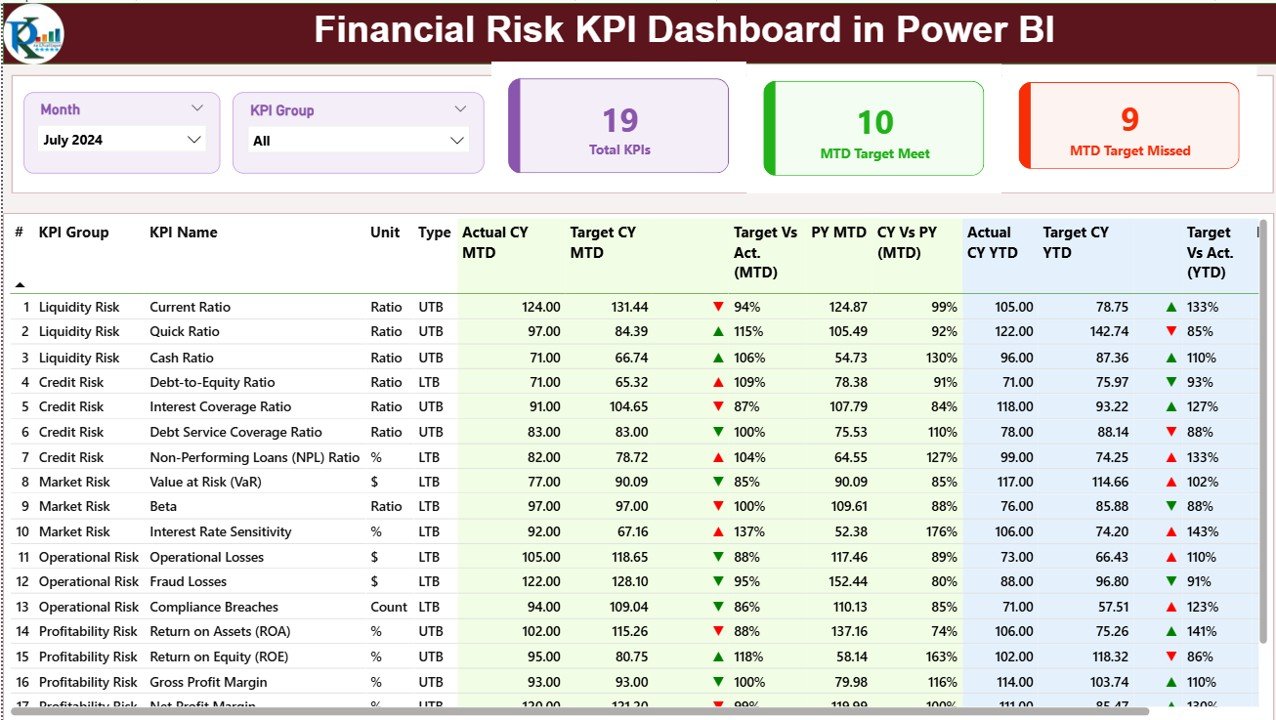
✔ Month slicer for selecting reporting periods
✔ KPI Group slicer for filtering risk categories
✔ Three KPI cards showing:
-
Total KPIs Count
-
MTD Target Met
-
MTD Target Missed
✔ A detailed KPI performance table including:
-
Actual vs Target (MTD & YTD)
-
Previous Year comparison (MTD & YTD)
-
Status icons (▲ ▼)
-
KPI Type (LTB / UTB)
This page gives leadership instant visibility into where financial risks stand today.
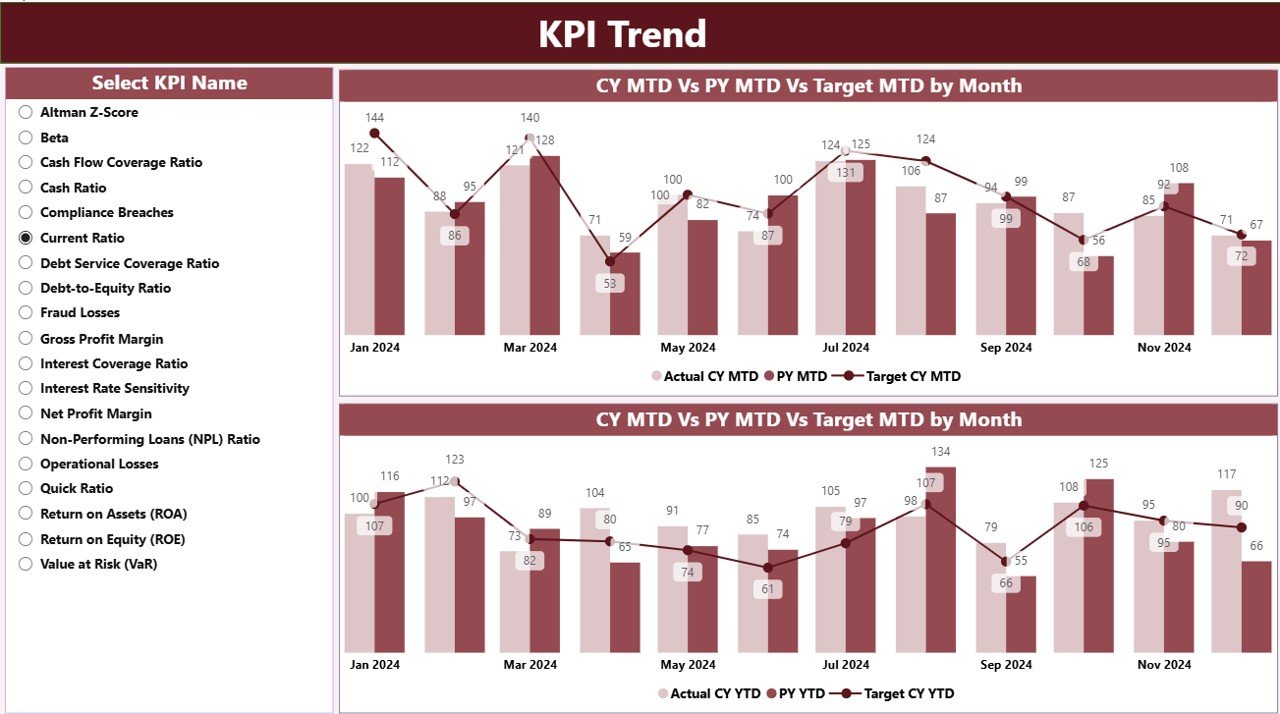
⭐ KPI Trend Page – Identify Risk Patterns Over Time
✔ Interactive KPI selector
✔ MTD Trend Combo Chart (Actual CY, Actual PY, Target)
✔ YTD Trend Combo Chart (Actual CY, Actual PY, Target)
This page reveals hidden patterns, early warning signs, and performance trends so teams can act before risks escalate.
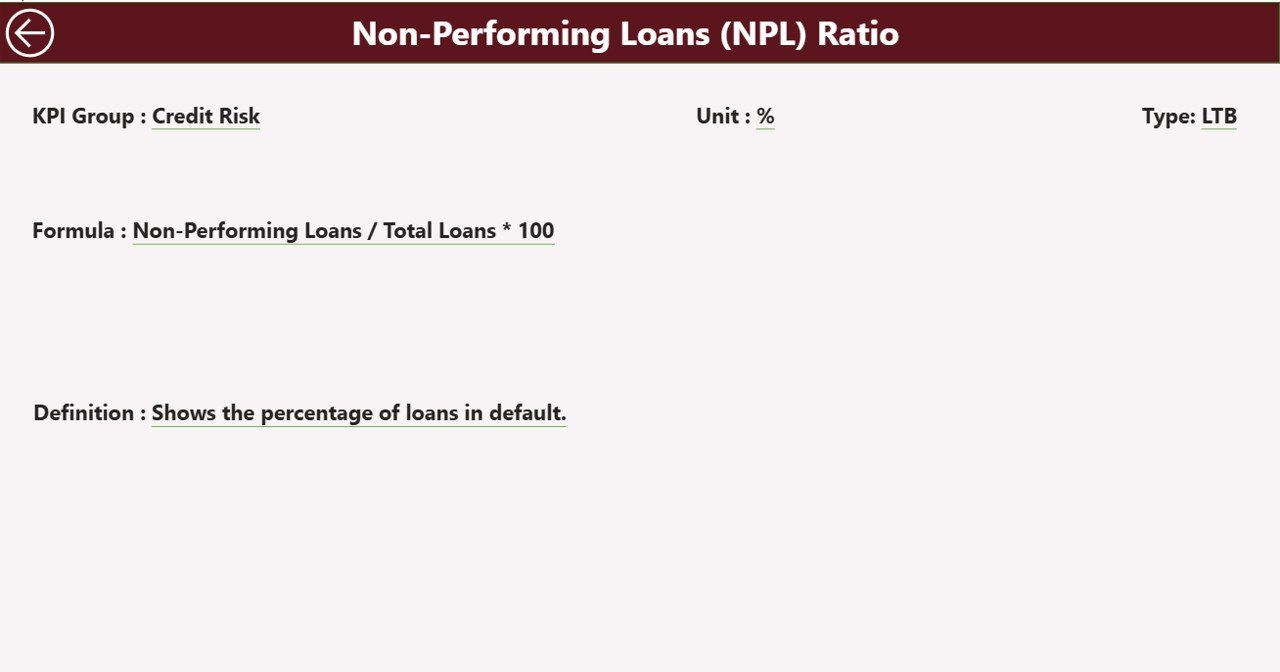
⭐ KPI Definition Page – Complete Transparency
✔ Drill-through page from the Summary Table
✔ Displays KPI Formula, Definition, Unit, and Type
✔ Back-navigation button for smooth user experience
This page ensures all stakeholders clearly understand every KPI—no confusion, no misinterpretation.
📦 What’s Inside the Financial Risk KPI Dashboard in Power BI
When you download this product, you get:
✨ Power BI dashboard file (.pbix)
✨ Executive-friendly visuals and layouts
✨ Interactive slicers and drill-through functionality
✨ Automated MTD & YTD calculations
✨ Status icons for quick risk identification
✨ Excel-based data model for easy updates
✨ Structured KPI definition framework
This complete package is designed for real-world financial risk management.
🛠️ How to Use the Financial Risk KPI Dashboard in Power BI
1️⃣ Update the Input_Actual Excel sheet with actual MTD & YTD values
2️⃣ Maintain targets in the Input_Target Excel sheet
3️⃣ Manage KPI master data in the KPI Definition sheet
4️⃣ Refresh the Power BI dashboard
5️⃣ Use Month and KPI Group slicers to filter results
6️⃣ Review Summary KPIs and status icons
7️⃣ Analyze trends and drill into KPI definitions
No Power BI expertise is required—Excel does all the heavy lifting.
👥 Who Can Benefit from This Financial Risk KPI Dashboard in Power BI
This dashboard is ideal for:
✔ Finance Managers
✔ Risk Management Teams
✔ CFOs and Controllers
✔ Compliance Officers
✔ Internal Audit Teams
✔ BI and Data Analysts
✔ Banking & Financial Services Firms
✔ Manufacturing, Retail, IT & Consulting Companies
If your organization manages financial risk KPIs, this dashboard fits perfectly.
### 📘 Click here to read the Detailed blog post
🎥 Visit our YouTube channel to learn step-by-step video tutorials
👉 Youtube.com/@PKAnExcelExpert


Reviews
There are no reviews yet.