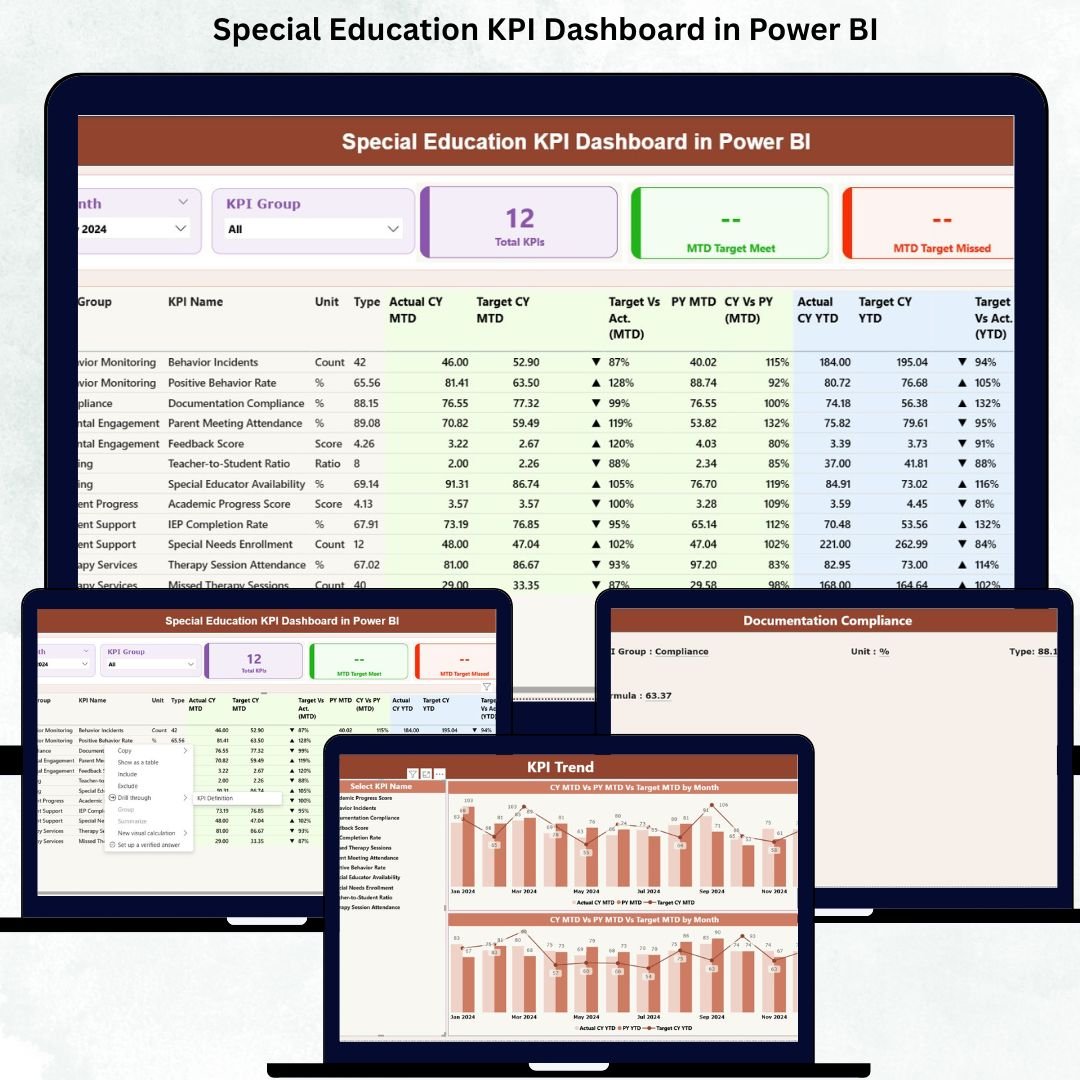
Managing special education programs is challenging when data is scattered across spreadsheets, reports, and manual trackers. Teachers, coordinators, therapists, and school leaders need fast and accurate insights—but outdated reporting slows everything down. That’s exactly why the Special Education KPI Dashboard in Power BI is a game-changing solution.
This ready-to-use dashboard turns complex special education data into a clean, visual, and interactive reporting system. Whether you want to track IEP compliance, service delivery, student outcomes, instructional planning, or year-over-year performance, this dashboard gives your team complete clarity in seconds. It connects directly to a simple Excel file, so you never need technical skills to use it—just update your numbers, and the visuals refresh instantly. 🚀📊
Designed specifically for special education programs, this dashboard helps schools improve decision-making, support diverse learners, and meet compliance requirements with confidence.
✨ Key Features of the Special Education KPI Dashboard in Power BI
This professionally designed dashboard comes with powerful features that simplify every part of special education reporting:
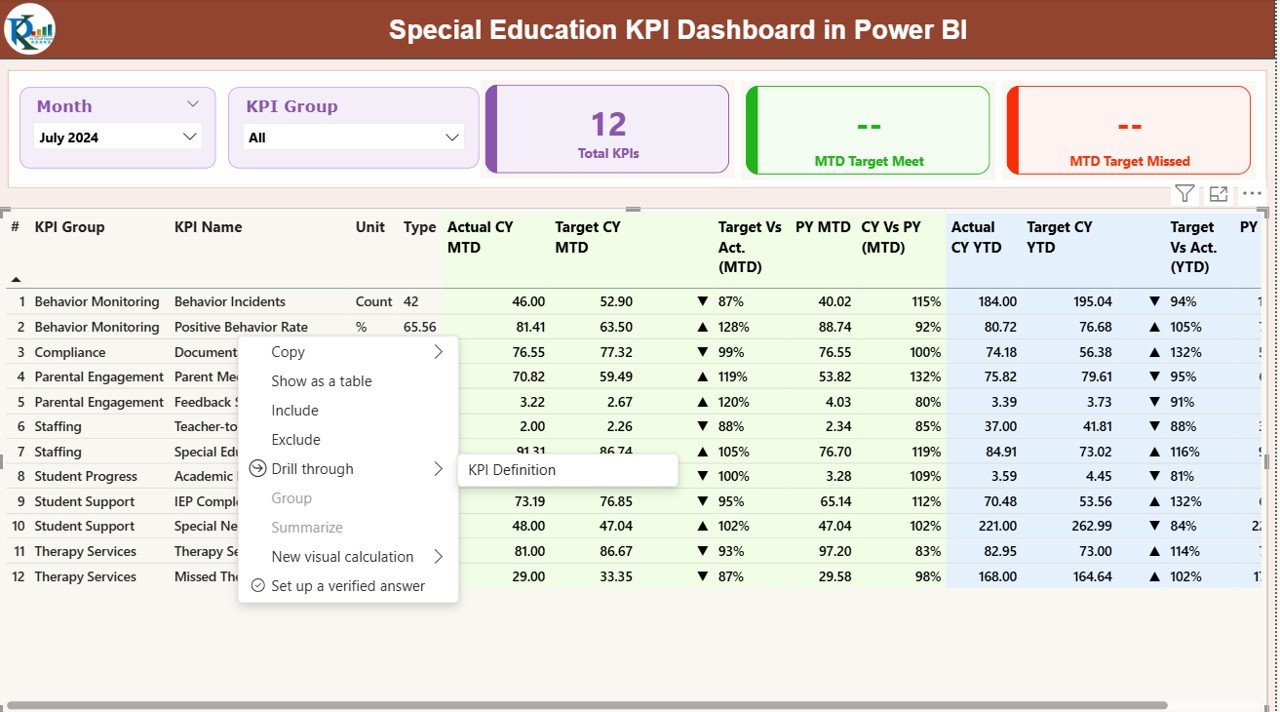
⭐ Interactive Slicers for Month & KPI Group
Easily filter KPIs by month, compliance, student performance, instructional delivery, or support services.
⭐ Smart KPI Cards
See total KPIs, MTD targets met, and MTD targets missed—instantly.
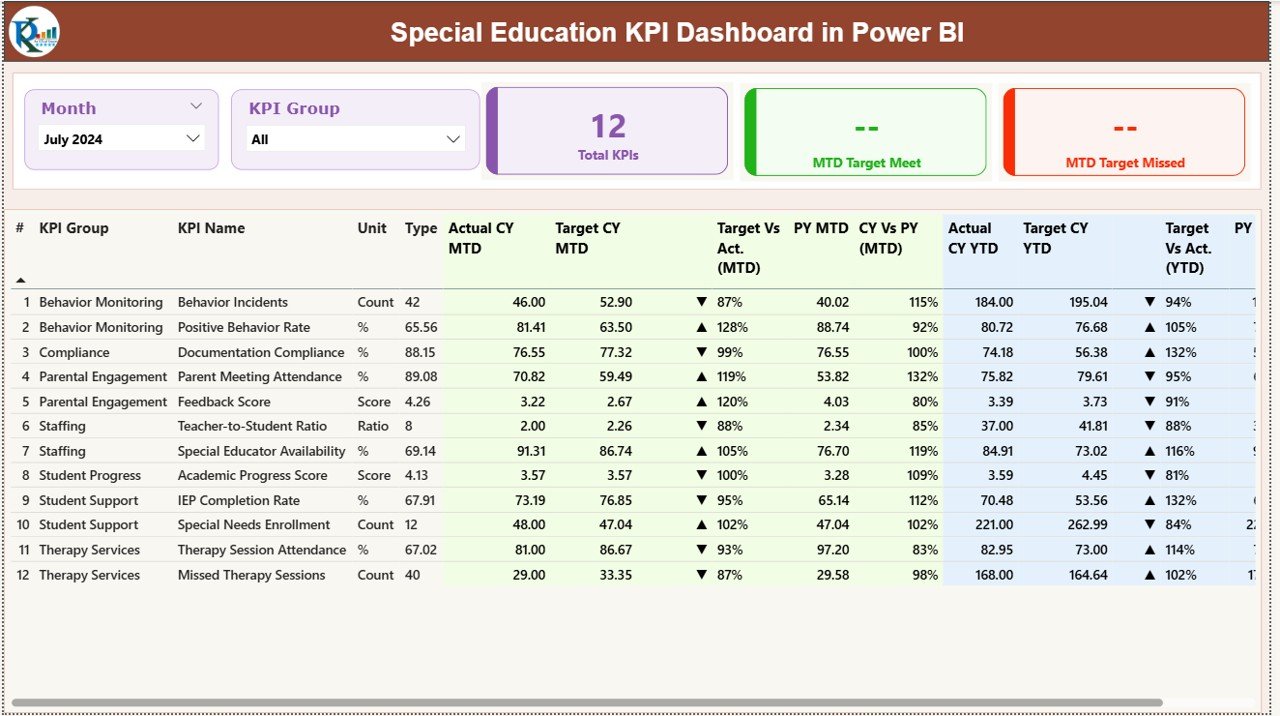
⭐ Detailed KPI Table with Icons
📌 KPI Number
📌 KPI Group
📌 KPI Name
📌 Unit
📌 Type (UTB/LTB)
📌 MTD & YTD actual vs target comparisons with 🔼/🔽 arrows
📌 CY vs PY performance
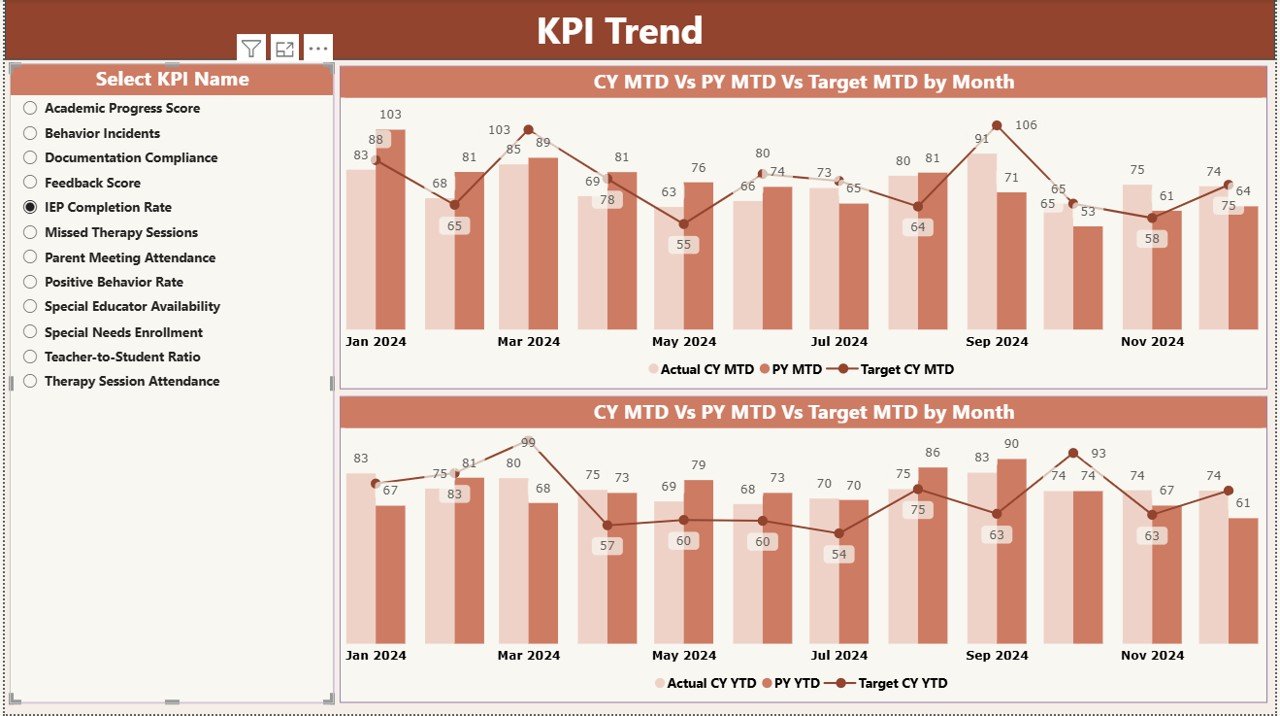
⭐ Trend Page for Monthly & Yearly Tracking
Explore KPI trends across months and years using dynamic combo charts.
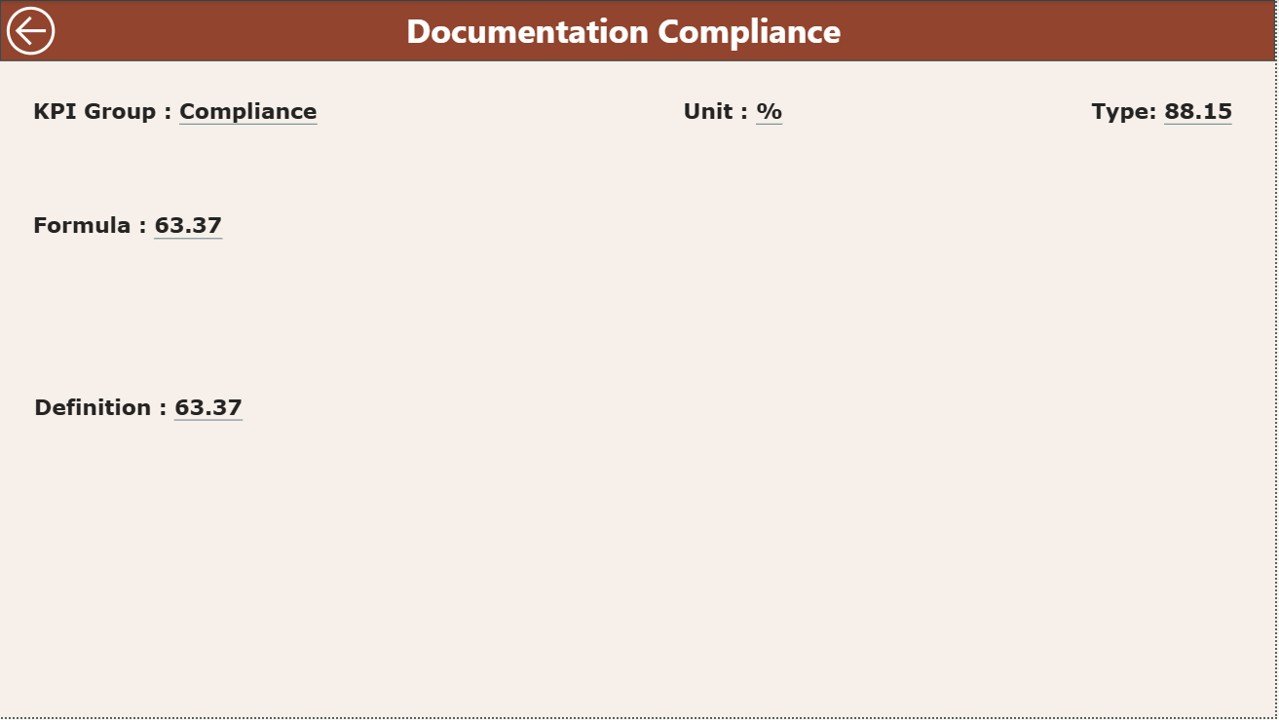
⭐ Drill-Through KPI Definition Page
Right-click any KPI to view its formula, definition, type, and reference details.
⭐ Excel-Driven Data Structure
Simply update the Input_Actual, Input_Target, and KPI_Definition sheets—Power BI handles the rest.
📦 What’s Inside the Special Education KPI Dashboard
When you download this product, you receive:
✔️ Power BI Dashboard File (PBIX)
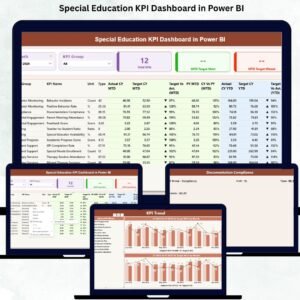
Fully interactive dashboard with 3 structured pages:
1️⃣ Summary Page
2️⃣ KPI Trend Page
3️⃣ KPI Definition Page
✔️ Excel Data File (XLSX)
Contains all worksheets required for smooth Power BI refresh:
-
Input_Actual – Enter MTD/YTD data
-
Input_Target – Enter target values
-
KPI_Definition – Define KPIs, units, formulas & types
✔️ User Guide (PDF)
Clear steps to update data and use every feature.
Everything is ready-to-use—no formulas, no setup, no coding.
🛠️ How to Use the Special Education KPI Dashboard
Using this dashboard is extremely simple:
➤ Step 1: Enter Actual Data
Update MTD and YTD numbers in the Input_Actual sheet.
➤ Step 2: Update Targets
Enter monthly KPIs in the Input_Target sheet.
➤ Step 3: Refresh Power BI
Open Power BI → Click Refresh → Dashboard updates automatically.
➤ Step 4: Analyze KPIs
Use slicers, charts, icons, and definition pages to evaluate performance.
➤ Step 5: Conduct Meetings & Reviews
Share the dashboard with teachers, coordinators, and administrators.
This system saves hours of manual reporting every month.
🎓 Who Can Benefit from This Special Education KPI Dashboard
This dashboard is designed for every professional involved in special education performance tracking:
👩🏫 Teachers & Special Educators
Quickly see student progress, interventions, and target achievement.
🧑💼 School Administrators & Principals
Monitor compliance, performance trends, and annual progress.
🧑🏫 Coordinators & Program Managers
Track learning outcomes and resource utilization.
🧑⚕️ Therapists & Support Specialists
Understand service delivery status and student growth.
📝 Compliance & Audit Teams
Pull accurate data instantly for reporting and documentation.
🧠 District Leaders & Education Boards
Gain system-level insights for planning and improvement.
If your school wants accuracy, clarity, and real-time insights—this dashboard is the perfect solution.


Reviews
There are no reviews yet.