The animation and VFX industry evolves at a rapid pace. Every year, the demand for high-quality digital content increases—whether it is for movies, OTT platforms, gaming, advertisements, or social media. But as this demand grows, studios face challenges like high production cost, complex workflows, long rendering cycles, recurring rework, and tight deadlines. That’s why every studio needs a strong, real-time monitoring system to stay efficient and profitable.
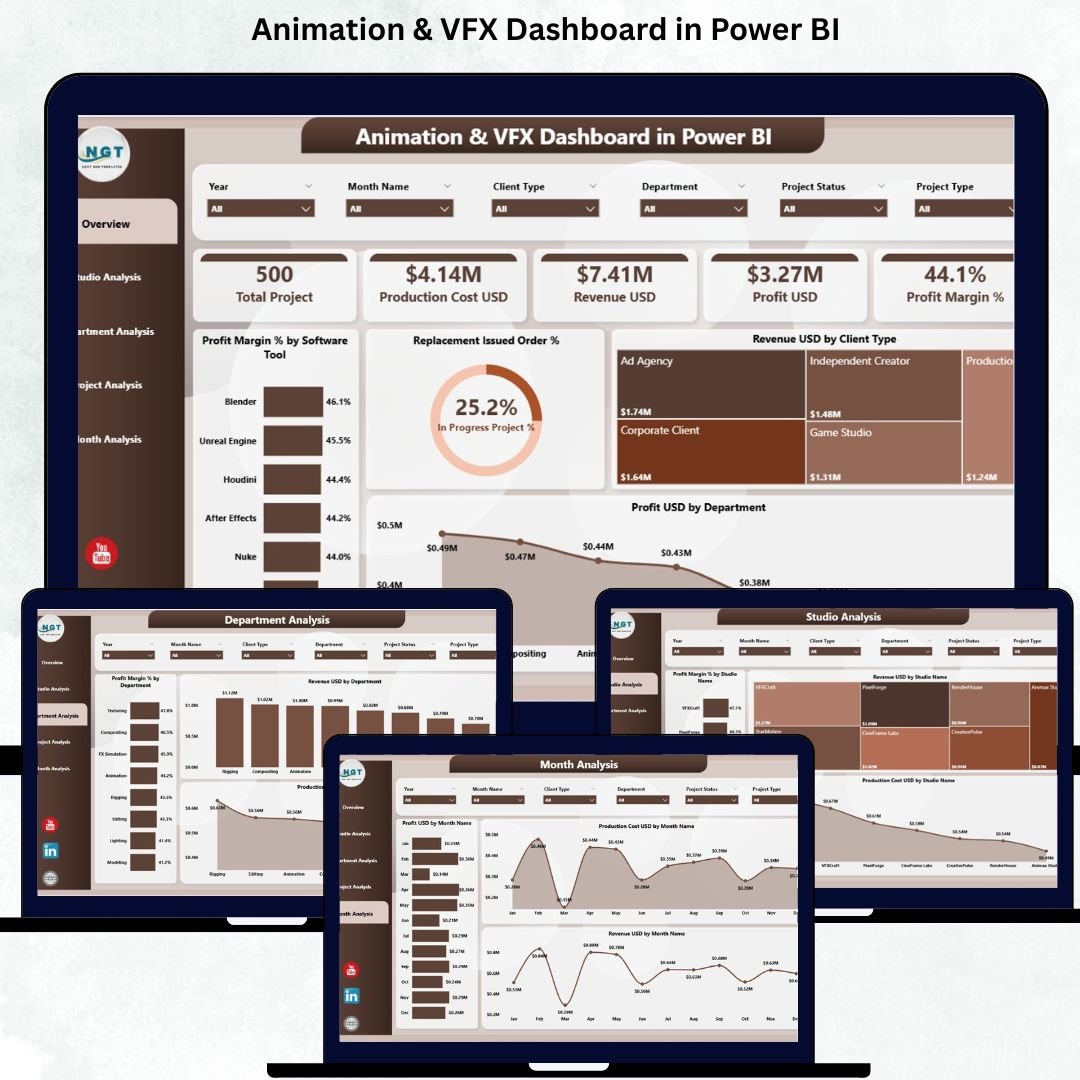
The Animation & VFX Dashboard in Power BI is designed exactly for this purpose. It gathers all essential studio insights—revenue, cost, profit, project performance, department efficiency, software usage, and monthly trends—into one clean and interactive dashboard. Instead of checking multiple files, Excel sheets, or manual reports, you can now view everything in a single Power BI interface.
This dashboard helps animation studios, production houses, and VFX companies make smarter decisions, reduce delays, improve planning, and maximize profitability. Whether you run a small studio or a multi-location animation company, this dashboard simplifies everything.
Let’s explore its complete structure and how it can transform your studio operations.
🎬 What’s Inside the Animation & VFX Dashboard in Power BI?
This dashboard includes five powerful pages, each designed to help studios analyze a specific area. Every page is fully interactive and includes slicers for Month, Studio Name, Department, Project Type, and Software Tool—allowing users to filter data instantly.
🎯 1. Overview Page — Your One-Page Studio Performance Summary
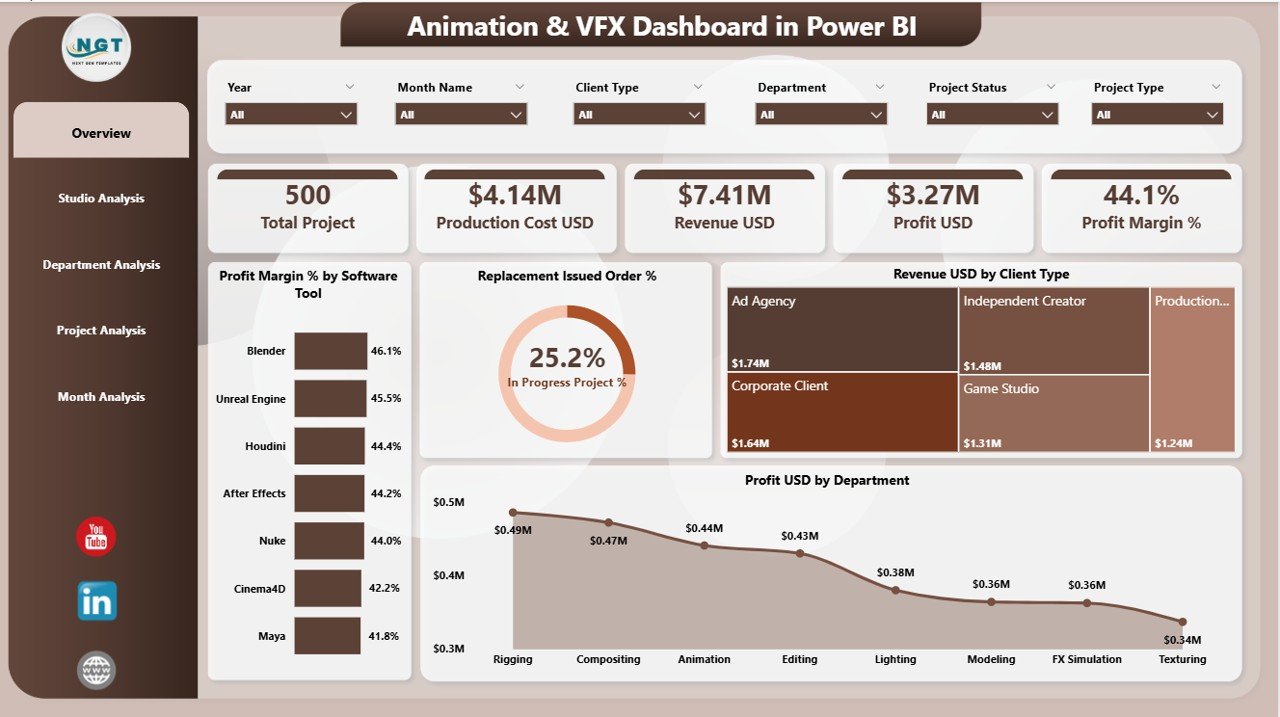
The Overview Page is the most important part of the dashboard. It gives a complete, high-level snapshot of your studio’s performance using clear visuals, cards, and slicers.
📌 Slicers on This Page
-
Month
-
Studio Name
-
Department
-
Project Type
-
Software Tool
These slicers instantly update all charts and KPI values on the page.
📌 KPI Cards
-
Total Revenue (USD)
-
Total Production Cost (USD)
-
Total Profit (USD)
-
Profit Margin (%)
Leaders and managers get immediate clarity on studio-wide financial performance.
📌 4 Key Charts
-
Profit Margin % by Software Tool — reveals which software delivers best results
-
Replacement Issue Order % — shows rework frequency and quality challenges
-
Revenue USD by Client Type — helps identify profitable client categories
-
Profit USD by Department — highlights which departments contribute the most to earnings
This page is perfect for leadership teams who want a fast, clear studio overview without scrolling through multiple reports.
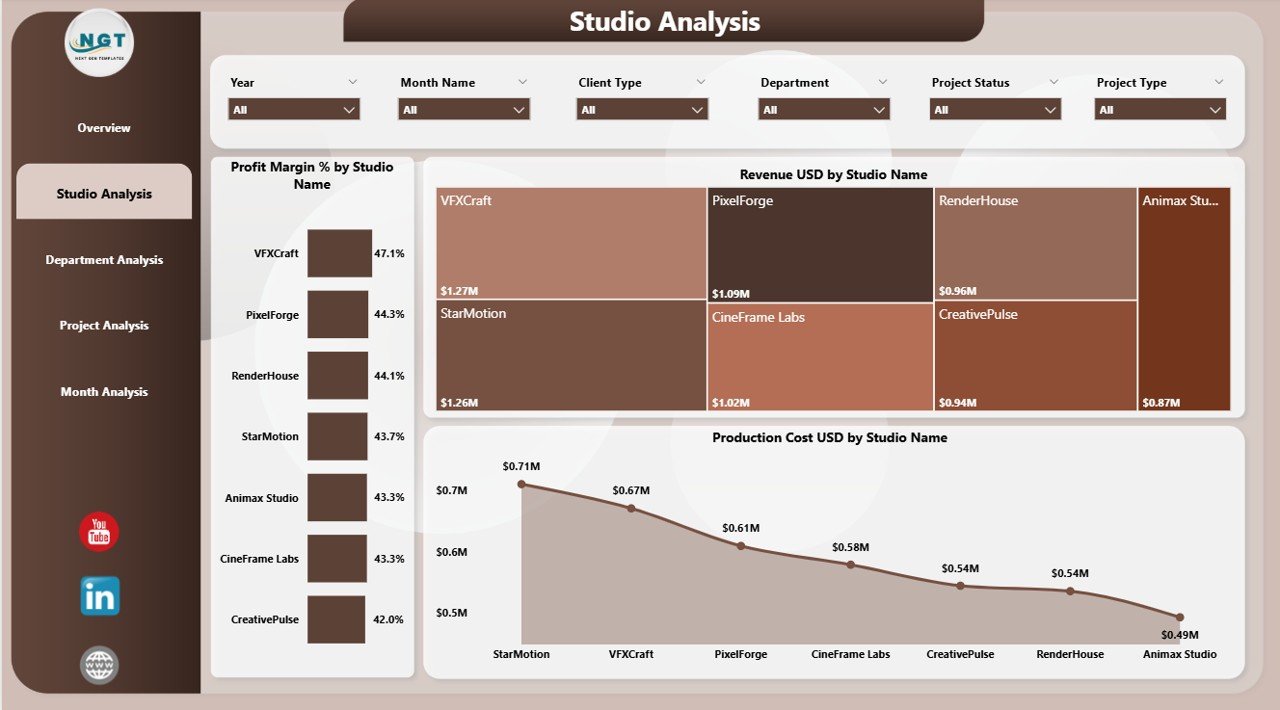
🏢 2. Studio Analysis Page — Compare Multiple Studios Easily
If your studio operates across multiple cities or branches, the Studio Analysis Page becomes extremely useful.
📊 Charts Included
-
Profit Margin % by Studio Name
-
Revenue USD by Studio Name
-
Production Cost USD by Studio Name
This helps management understand which studio performs well, which one needs support, and how cost patterns differ across branches.
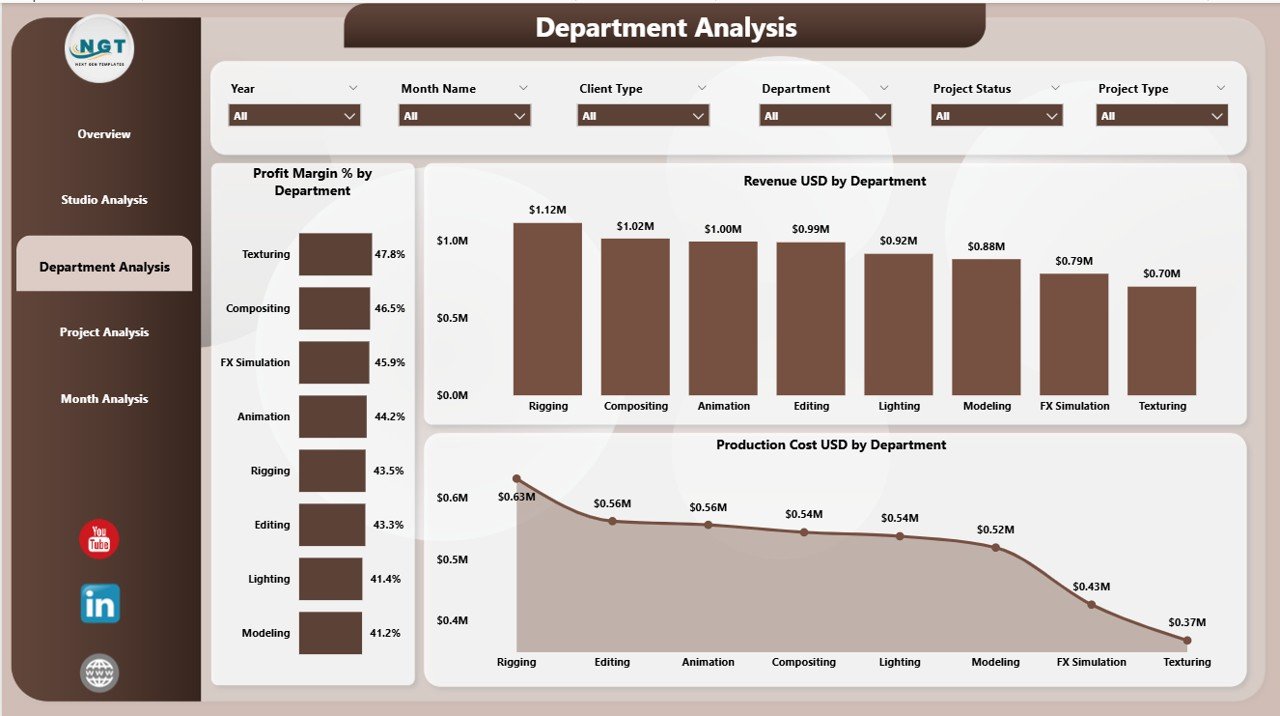
🎨 3. Department Analysis Page — Track Efficiency Across All Departments
Animation and VFX work moves through multiple stages—storyboarding, modeling, rigging, texturing, animation, lighting, FX, rendering, compositing, and more. The Department Analysis Page helps track each of these departments clearly.
📊 Charts Included
-
Profit Margin % by Department
-
Revenue USD by Department
-
Production Cost USD by Department
This page supports department heads to improve output quality, reduce delays, and manage resources better.
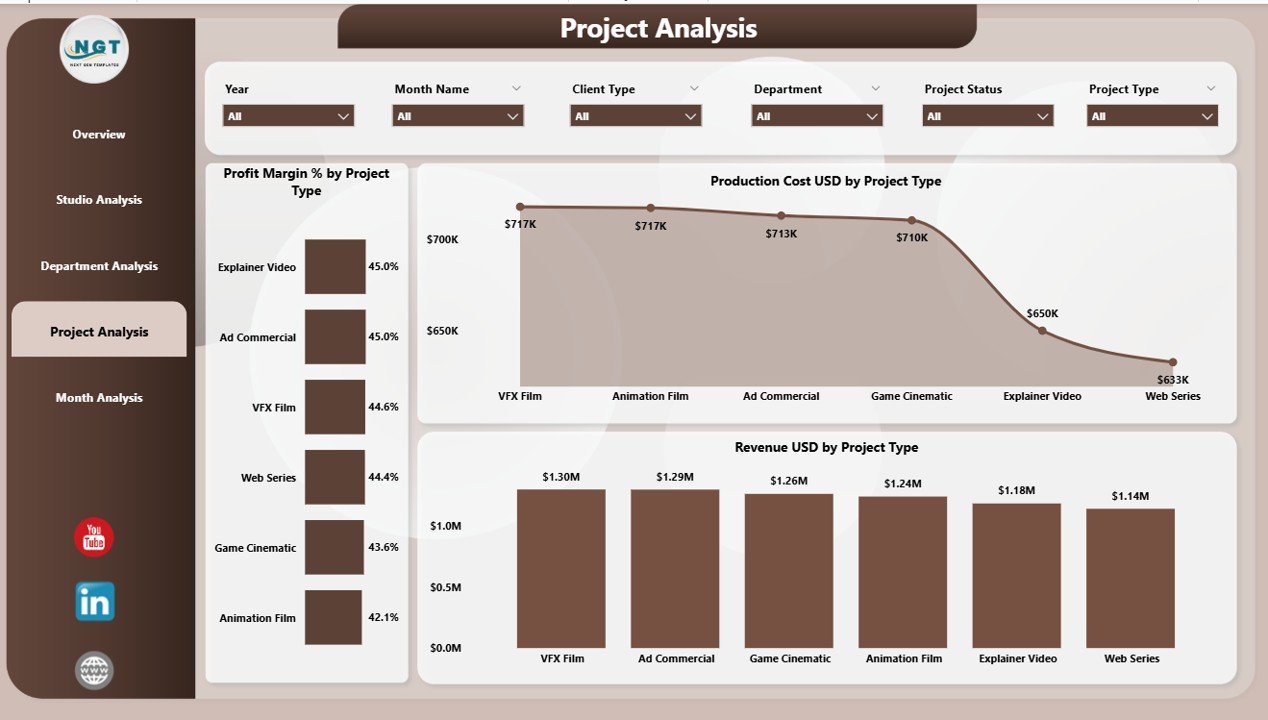
🎥 4. Project Analysis Page — Monitor Performance by Project Type
Every studio manages several project types like 2D animation, 3D animation, VFX, gaming assets, commercials, and OTT content. The Project Analysis Page gives profit and cost insights for every project category.
📊 Charts Included
-
Profit Margin % by Project Type
-
Revenue USD by Project Type
-
Production Cost USD by Project Type
This helps decision-makers identify which project types deliver high returns and which ones increase workload without profit.
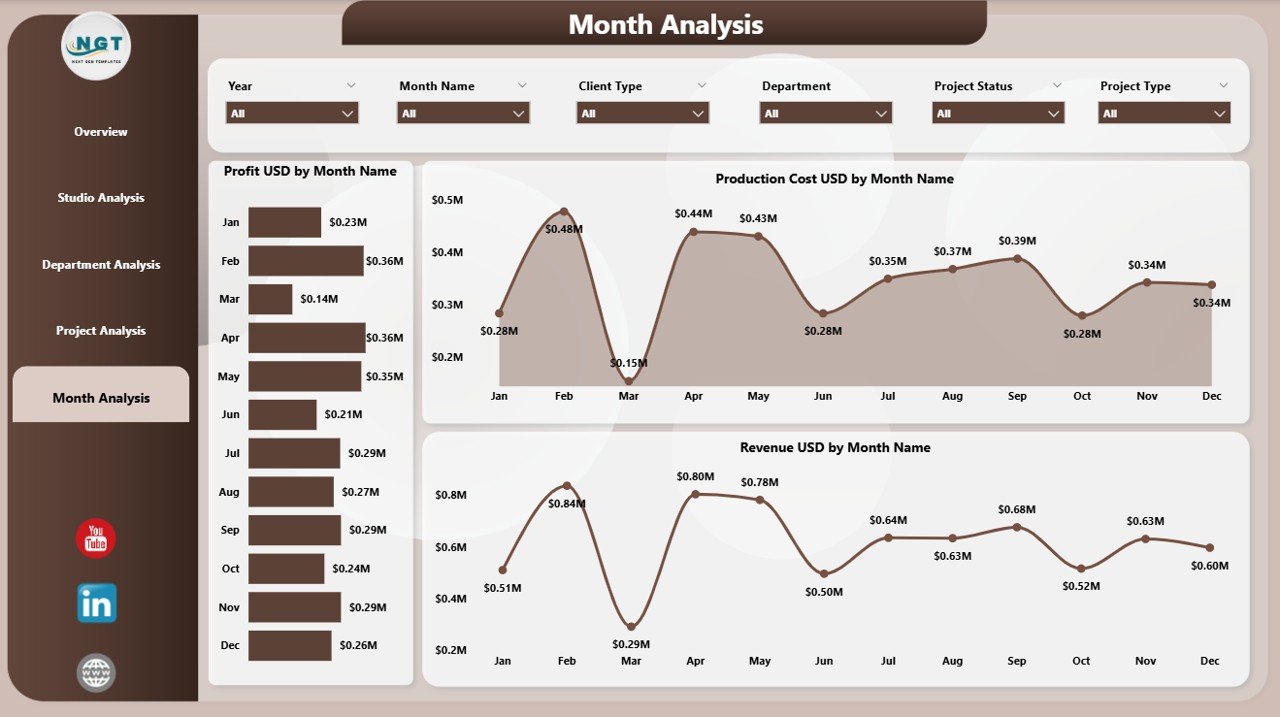
📅 5. Monthly Trends Page — Understand Seasonal Patterns & Growth
The Monthly Trends Page shows how your studio performs across months.
📊 Monthly Charts
-
Profit Margin % by Month
-
Revenue USD by Month
-
Production Cost USD by Month
These visuals help with forecasting, budgeting, and planning future projects.
🌟 Advantages of the Animation & VFX Dashboard in Power BI
This dashboard gives studios a powerful edge:
⭐ 1. Complete Visibility
Track revenue, cost, profitability, and department performance in one view.
⭐ 2. Fast Decision-Making
Leadership teams get instant clarity with visual insights.
⭐ 3. Better Cost Control
Track labor cost, rendering cost, and production cost easily.
⭐ 4. Improved Productivity
Teams spend less time reporting and more time creating.
⭐ 5. Better Client Management
Client-wise revenue insights help you target high-value clients.
⭐ 6. More Accurate Resource Planning
Track performance by software tool, project type, and department.
⭐ 7. Higher Profitability
Identify waste, reduce rework, and focus on high-profit areas.
🏆 Best Practices for Using This Dashboard
-
Update the Excel data regularly
-
Use slicers for deep analysis
-
Review monthly trends frequently
-
Track profit margins closely
-
Compare studios and departments twice a month
-
Share Power BI access with your team
-
Add more KPIs as your studio grows
🎬 How This Dashboard Helps Studios Grow
The dashboard supports studio growth by:
-
Monitoring production and cost trends
-
Identifying profitable services
-
Improving planning and resource allocation
-
Reducing waste & rework
-
Helping teams meet deadlines
-
Improving client satisfaction
When studios rely on data, they grow faster and more confidently.
### Click here to read the Detailed Blog Post
📺 Visit our YouTube channel to learn step-by-step video tutorials
👉 https://youtube.com/@PKAnExcelExpert


Reviews
There are no reviews yet.