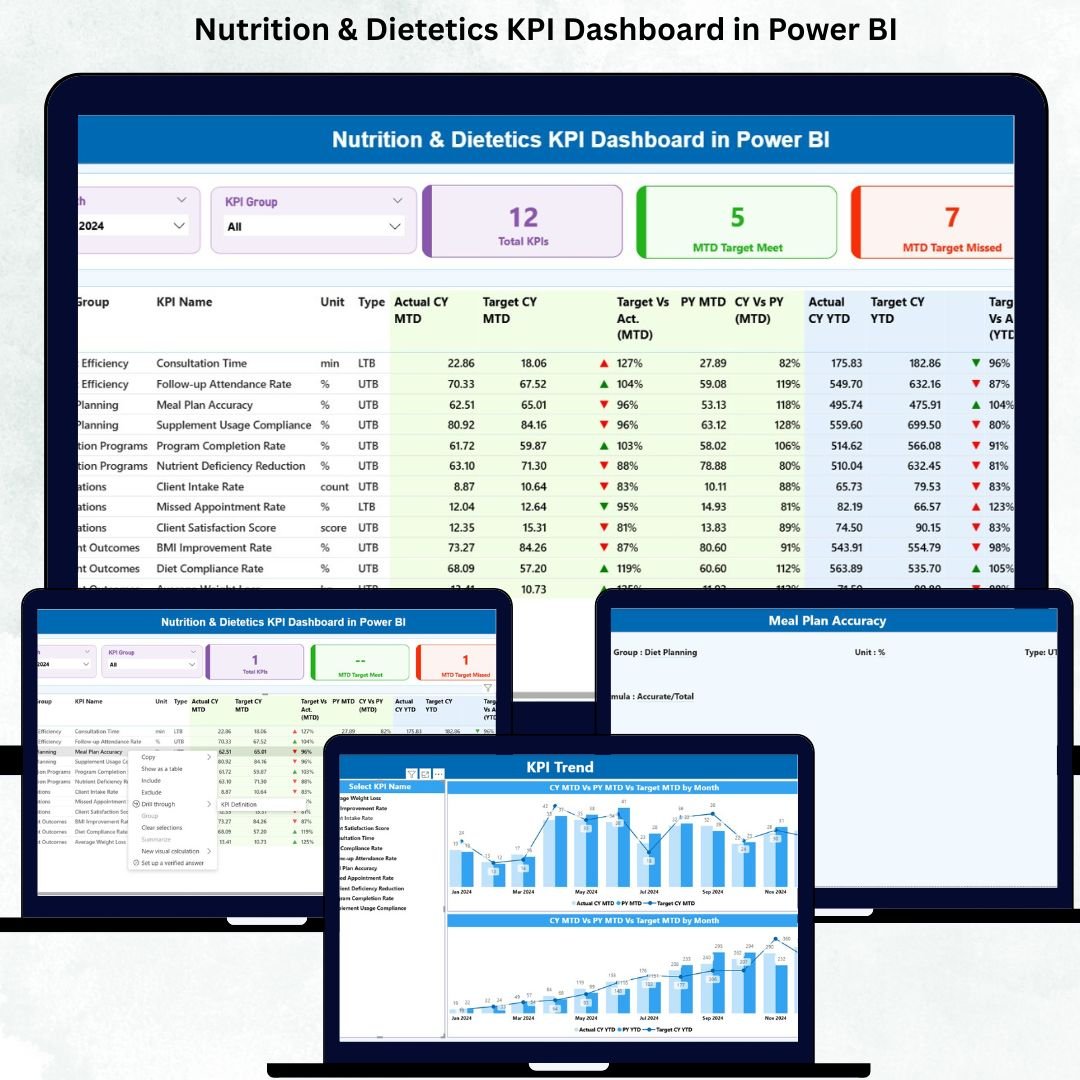
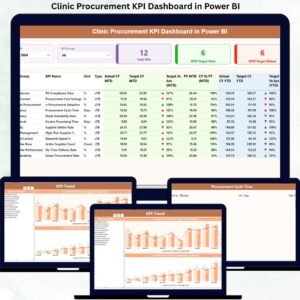
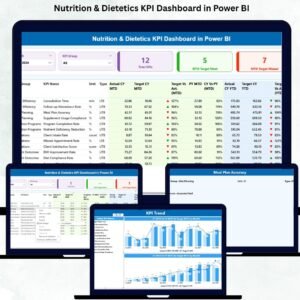
Managing nutrition and dietetics performance becomes effortless when you have the right analytical system to track results. The Nutrition & Dietetics KPI Dashboard in Power BI is a ready-to-use reporting solution designed for dietitians, nutrition managers, hospital teams, wellness centers, and community nutrition programs. It centralizes all important KPIs such as diet adherence, client satisfaction, calorie intake accuracy, case progress, nutrient balance, and clinical efficiency—all inside a clean, interactive Power BI dashboard.Nutrition & Dietetics KPI Dashboard in Power BI.
This powerful dashboard replaces scattered spreadsheets and gives teams a structured, visual, and intelligent way to monitor performance. With slicers, KPI cards, automated comparisons, trend charts, and drill-through definitions, you can analyze progress in seconds. Whether you want MTD performance, YTD progress, target gaps, or previous-year comparison, everything appears instantly with one click.Nutrition & Dietetics KPI Dashboard in Power BI
Below, you will discover every important detail about this product—its features, contents, usage, and who will benefit the most.
👉 Key Features of the Nutrition & Dietetics KPI Dashboard in Power BI
This dashboard comes with smart visuals and actionable insights to help nutrition teams perform better. Here are the major highlights:
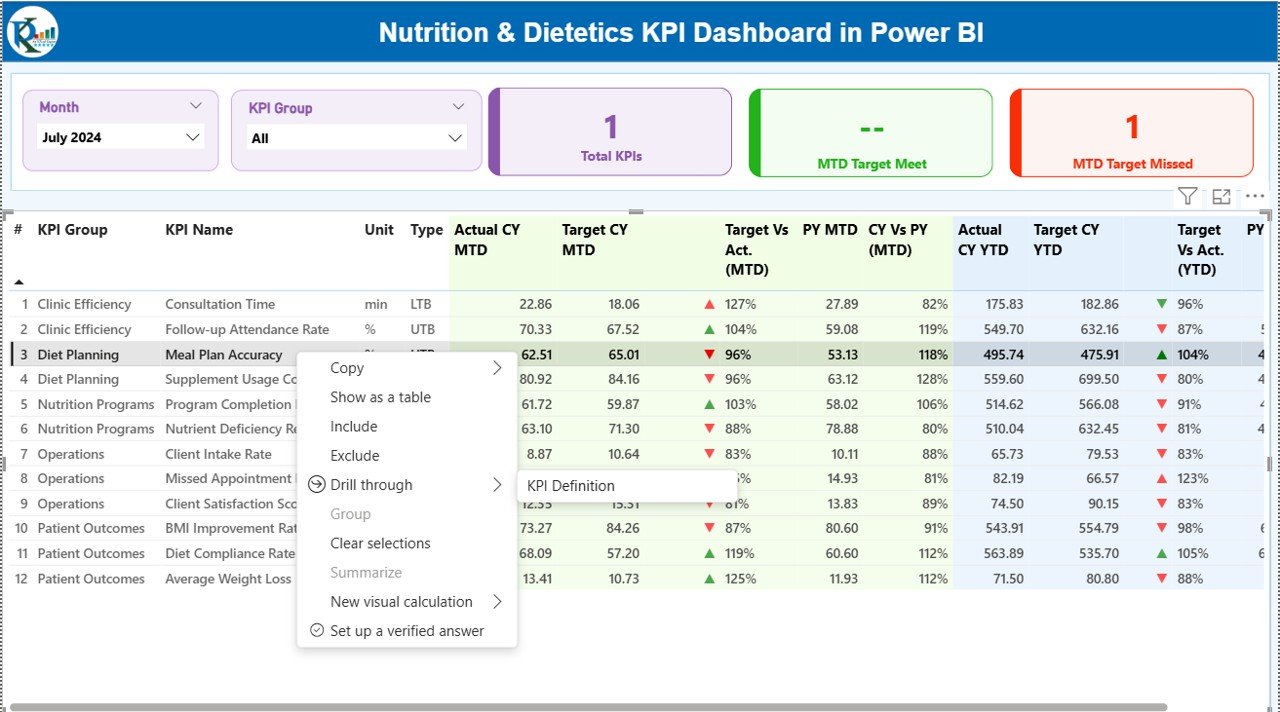
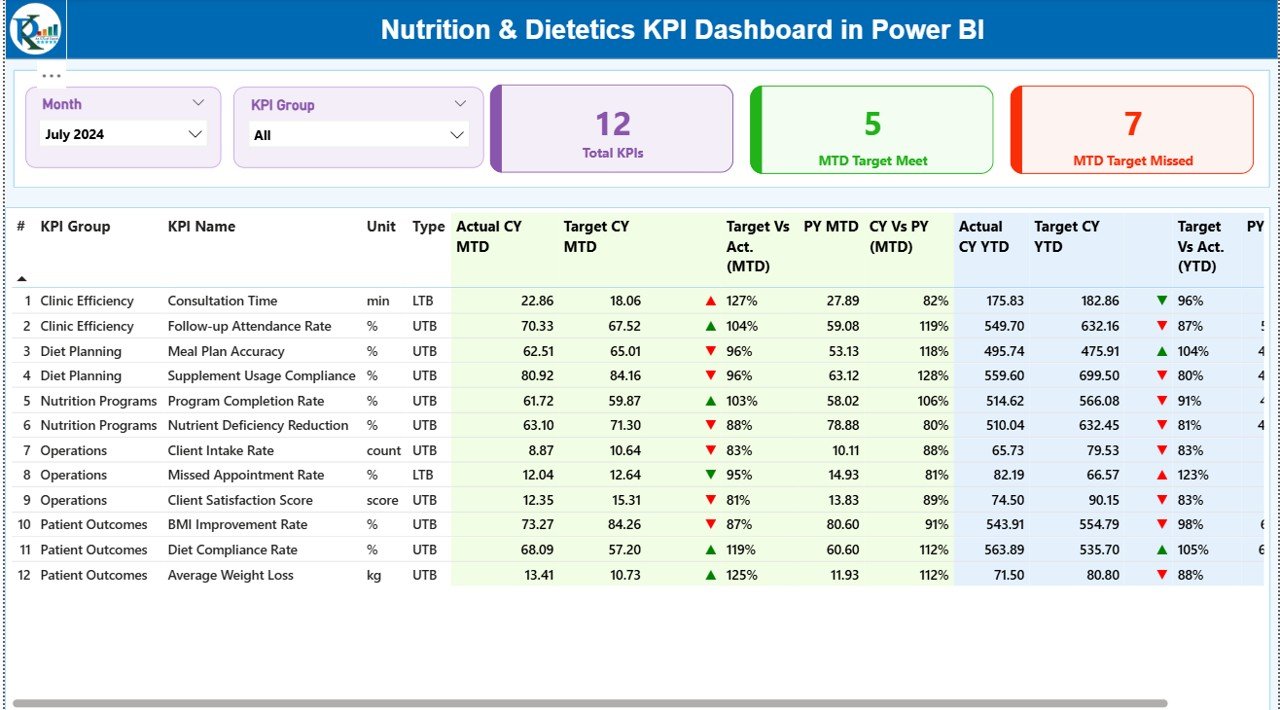
📌 Interactive Summary Page
-
Month-wise and KPI Group slicers
-
Cards showing Total KPIs, MTD Target Met, MTD Target Missed
-
Full KPI table with Actuals, Targets, PY comparison, and color-coded icons
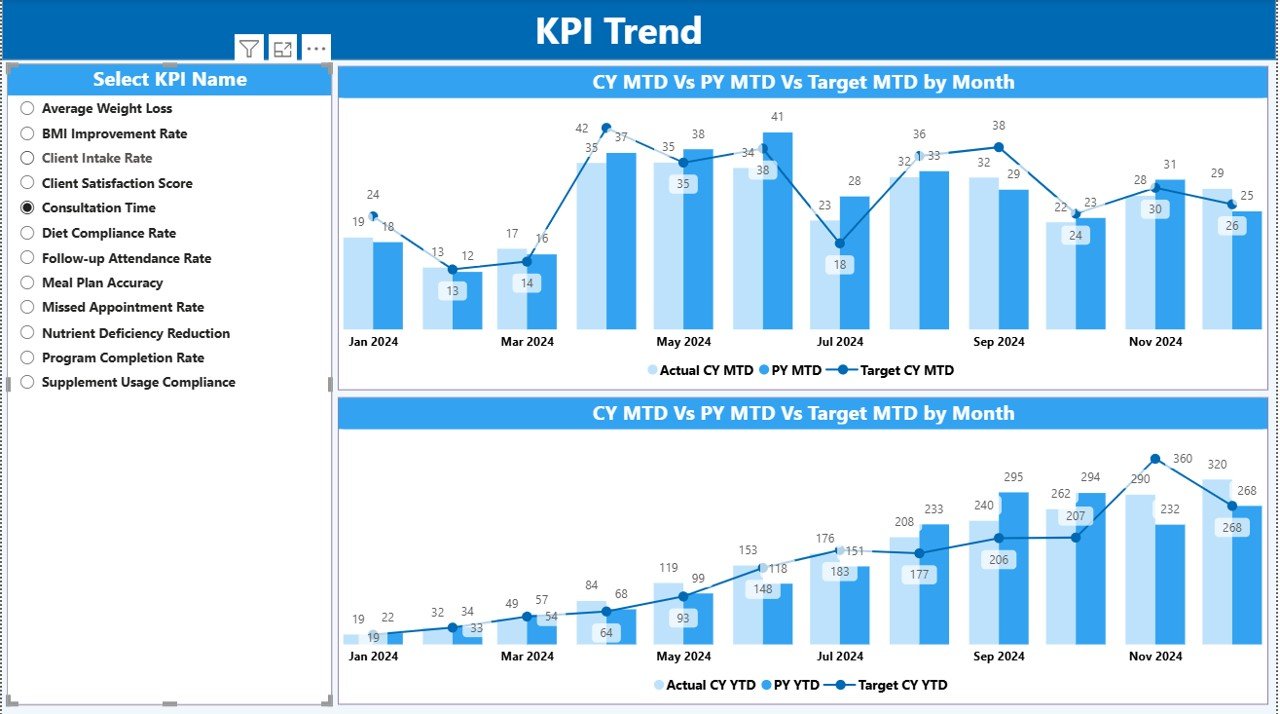
📌 Trend Analysis Page
-
Two powerful combo charts
-
Monthly comparison of Actual vs Target vs Previous Year
-
Separate MTD and YTD trends
-
KPI selector for focused analysis
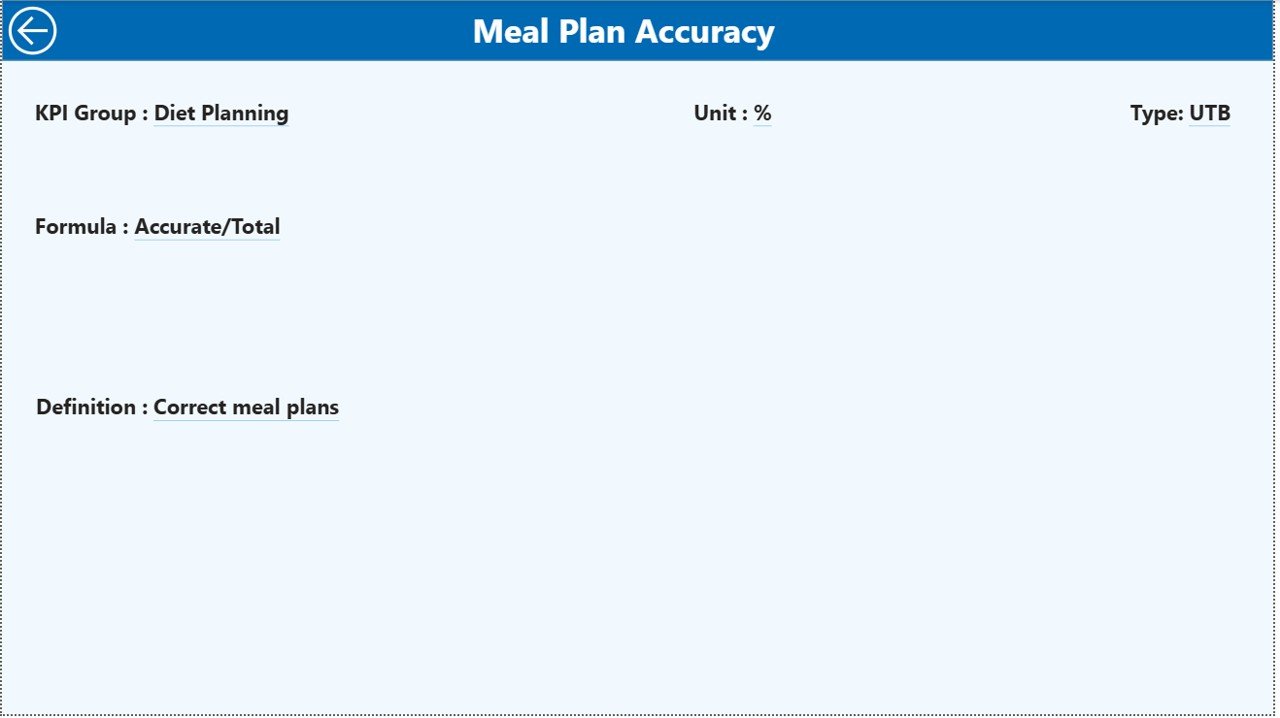
📌 KPI Definition Page
-
Drill-through view for formulas, definitions, units, and business logic
-
Supports transparency and audit readiness
-
Helps maintain standard KPI rules
📌 Excel-Driven Data Structure
-
Simple Input_Actual sheet
-
Clean Input_Target sheet
-
Detailed KPI Definition sheet
-
Easy monthly updates—no technical skills needed
👉 What’s Inside the Nutrition & Dietetics KPI Dashboard in Power BI
Your download includes everything you need to start tracking performance immediately:
📄 1. Power BI Dashboard File (.PBIX)
A fully designed and ready-to-use dashboard with all visuals, slicers, and navigations pre-built.Nutrition & Dietetics KPI Dashboard in Power BI
📊 2. Input Excel File
Containing:
-
KPI actual values
-
KPI targets
-
KPI definitions (Unit, Formula, Type, Group)
📘 3. Documentation & Instructions
Step-by-step guidelines on how to update, refresh, and maintain the dashboard.
🔄 4. Built-in Drill-Through Logic
Deep KPI-level insights to help teams understand formulas and definitions clearly.
🧭 5. Navigation Buttons
Quick access to Summary, Trends, and Definition pages.
👉 How to Use the Nutrition & Dietetics KPI Dashboard in Power BI
Using this dashboard is extremely simple and beginner-friendly:
✏️ Step 1: Update Excel Sheets
Enter your MTD and YTD values in the “Input_Actual” sheet.
Enter your monthly targets in “Input_Target.”
🔄 Step 2: Refresh Power BI
Power BI automatically updates all charts, tables, and cards.
🎯 Step 3: Apply Filters
Use slicers to select Month or KPI Group.
📉 Step 4: View Trends & Gaps
Check MTD/YTD trends and compare with previous-year values.
🔍 Step 5: Drill Through for Definitions
Right-click any KPI to view Formula, Definition, Group, and Unit.
📥 Step 6: Export or Share
Export the dashboard as PDF or share it via Power BI Desktop.
👉 Who Can Benefit from This Nutrition & Dietetics KPI Dashboard in Power BI?
This dashboard is ideal for all nutrition monitoring activities:Nutrition & Dietetics KPI Dashboard in Power BI
🏥 Hospitals & Clinical Nutrition Teams
Track diet adherence, nutrient balance, client feedback, and treatment outcomes.
🥗 Diet Clinics & Wellness Centers
Monitor consultation rates, client progress, and success of diet programs.
🏫 School & Community Nutrition Programs
Measure program effectiveness, reach, and compliance.
📊 Nutrition Managers & Healthcare Planners
Evaluate operational KPIs, quality measures, and monthly performance.
🧑⚕️ Individual Dietitians & Health Coaches
Analyze client adherence, calorie performance, and satisfaction trends.
With this dashboard, every nutrition-focused professional can enhance performance and make better decisions.
### Click here to read the detailed blog post
Watch the step-by-step video tutorial:


Reviews
There are no reviews yet.