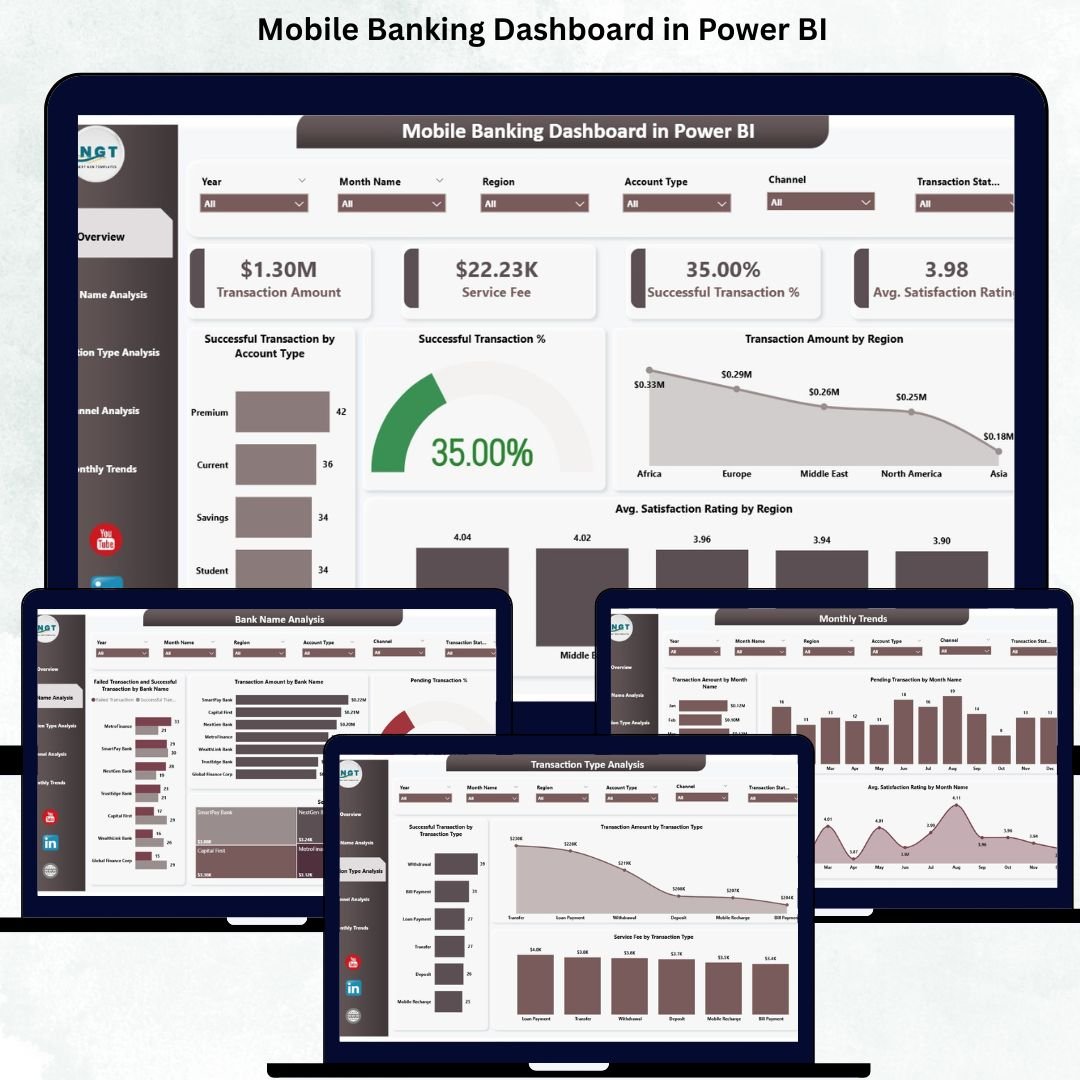
The digital banking world moves at lightning speed. Customers expect instant money transfers, smooth payments, secure transactions, and seamless access from anywhere. With thousands of transactions happening every minute, banks can’t afford blind spots. They need real-time visibility, accurate insights, and instant performance monitoring. That is exactly why the Mobile Banking Dashboard in Power BI is a game-changing solution for modern financial institutions.
This ready-to-use dashboard converts complex mobile banking data into clear, interactive visuals. It helps banks understand how well their mobile channels perform, which regions drive the highest usage, which transaction types generate revenue, and where failures or delays occur. With powerful slicers, drill-down capabilities, and dynamic charts, this dashboard gives every stakeholder—from IT teams to senior leadership—the clarity they need to improve digital banking efficiency.
Whether you’re analyzing transaction volumes, customer satisfaction, channel behavior, or service fee contributions, this dashboard makes reporting simple, fast, and reliable.
✨ Key Features of Mobile Banking Dashboard in Power BI
This dashboard is designed with real banking challenges in mind and offers all essential analytics in one place.
📊 Unified Performance Monitoring
Track all major KPIs—transaction amounts, service fees, success rates, customer satisfaction, and pending transactions—within a single dashboard.
📱 Channel Insights & Comparison
Analyze Mobile App, Internet Banking, USSD, ATM-linked channels, Merchant POS usage, and more with precise charts.
🏦 Bank-Level Performance View
Understand which banks have the highest activity, biggest failures, highest service fees, or pending transactions.
📈 Transaction Type Analysis
Fund transfers, recharges, bill payments, deposits, withdrawals—view performance for every digital service category.
🌍 Region-Wise Reporting
Identify top-performing regions, understand customer behavior, and detect areas needing improvement.
📅 Monthly Trend Charts
Track long-term digital banking patterns for transactions, satisfaction, and pending issues.
🟢🔴 Instant KPI Indicators
Success and failure visuals allow teams to act quickly on problem areas.
This dashboard gives banks the accuracy and speed needed for today’s digital environment.
📦 What’s Inside the Mobile Banking Dashboard in Power BI
The dashboard includes five detailed reporting pages, each designed to answer specific questions:
1️⃣ Overview Page – The Central Performance Hub
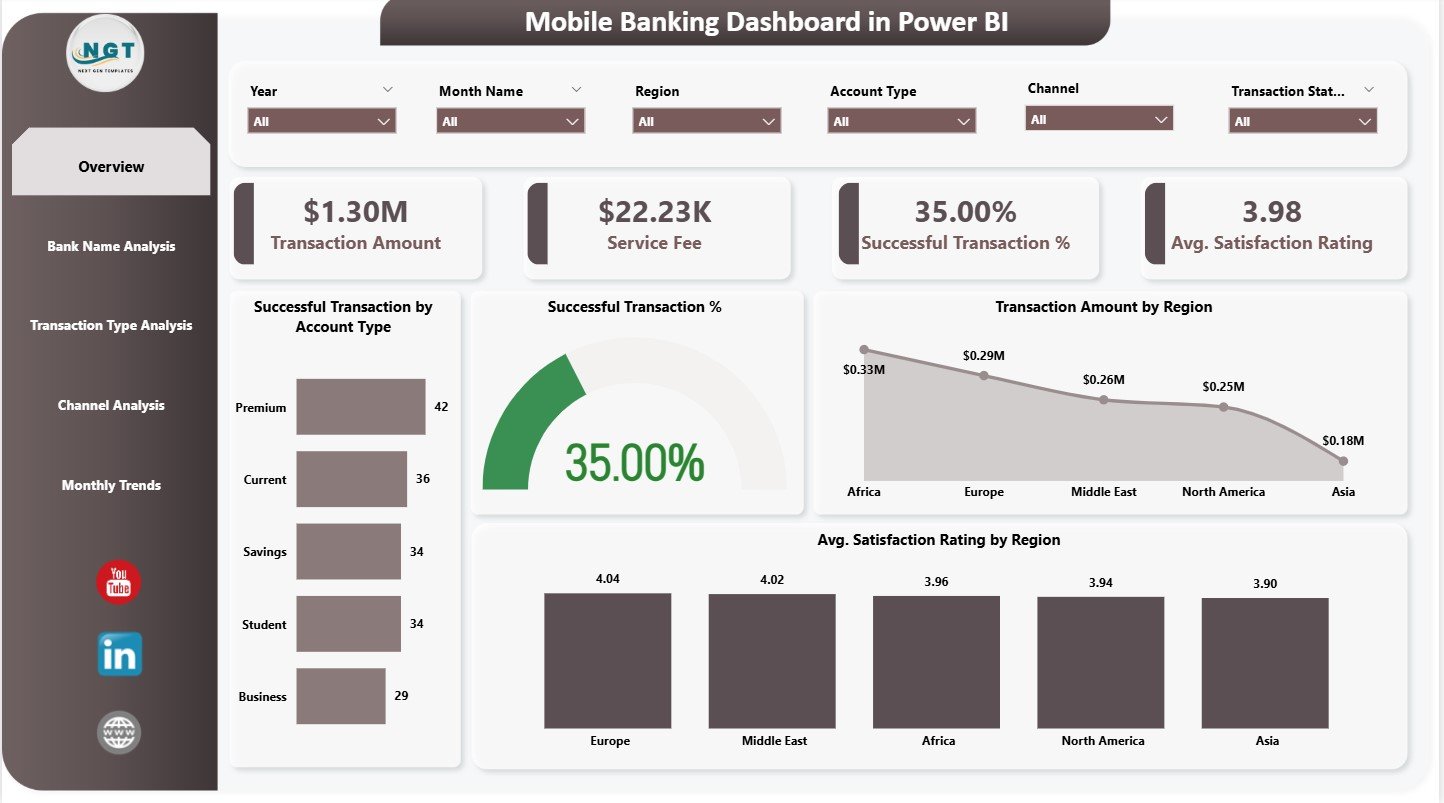
Shows four key KPI cards:
-
Transaction Amount
-
Service Fee Revenue
-
Successful Transactions
-
Average Satisfaction Rating
Includes charts for regional performance, account types, and customer satisfaction.
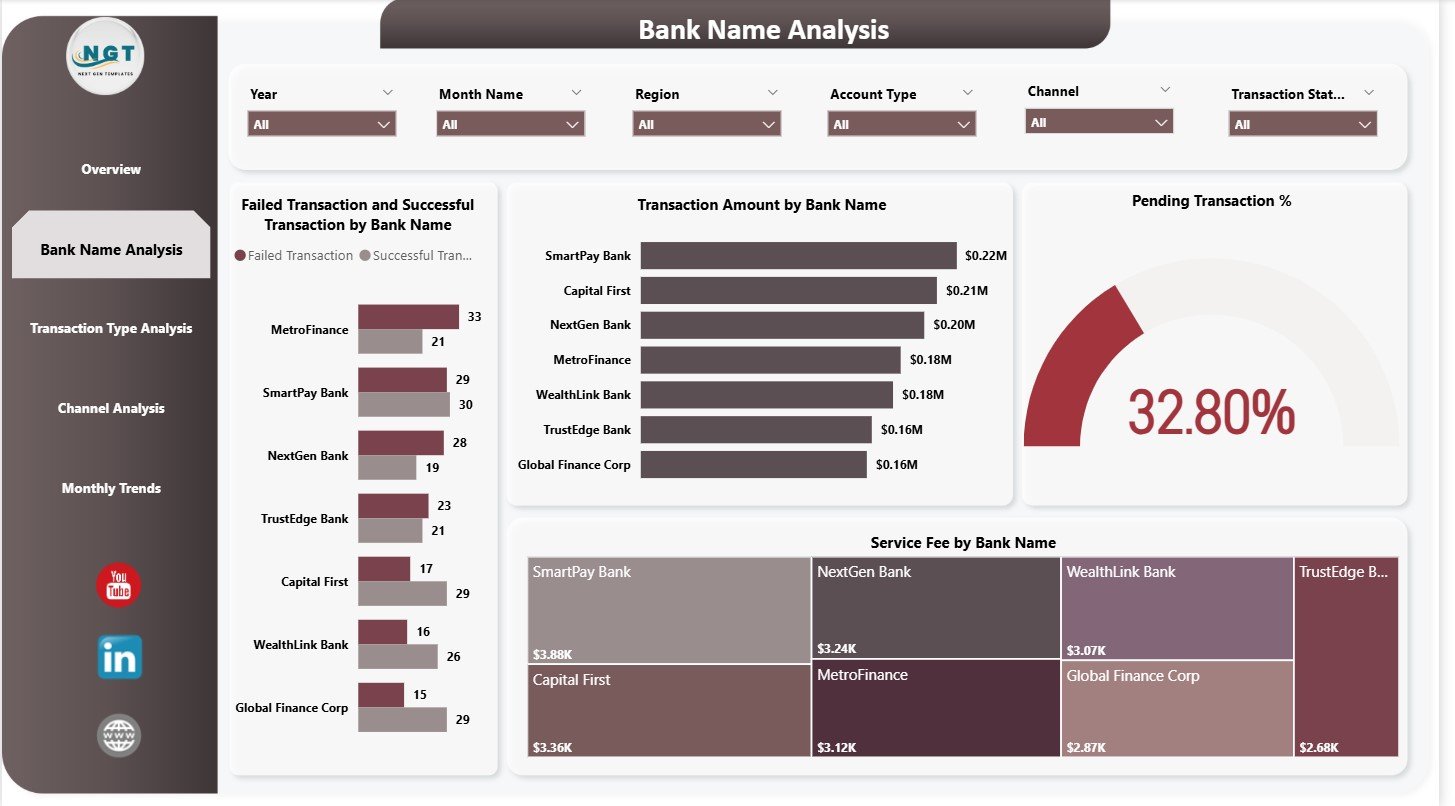
2️⃣ Bank Name Analysis Page – Compare Banks Easily
Charts include:
-
Failed vs Successful Transactions
-
Transaction Amount by Bank
-
Pending Transaction Percentage
-
Service Fee Contribution
Perfect for multi-bank ecosystems and partner evaluations.
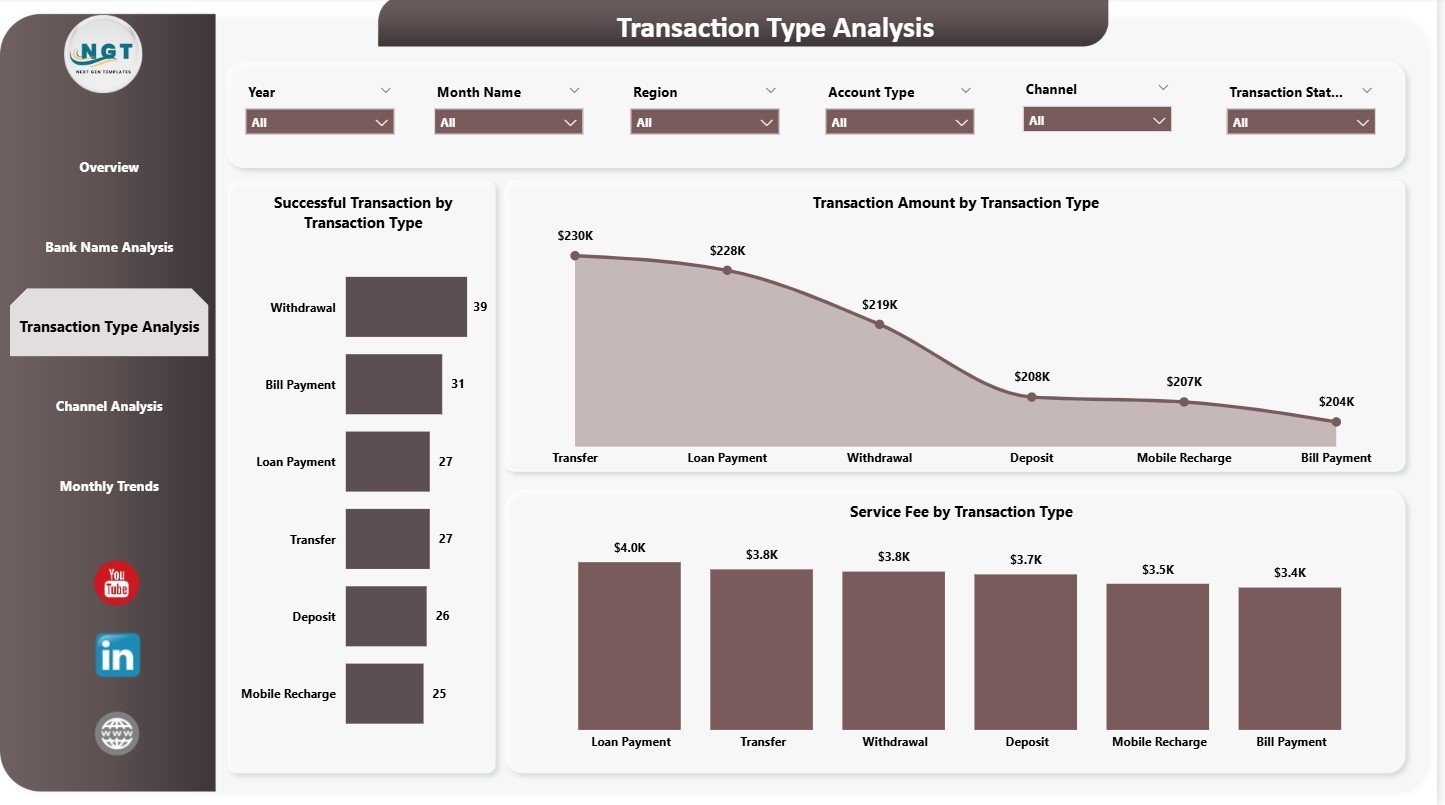
3️⃣ Transaction Type Analysis Page – Understand Customer Usage
Shows which banking services customers use the most and which generate the highest values and fees.
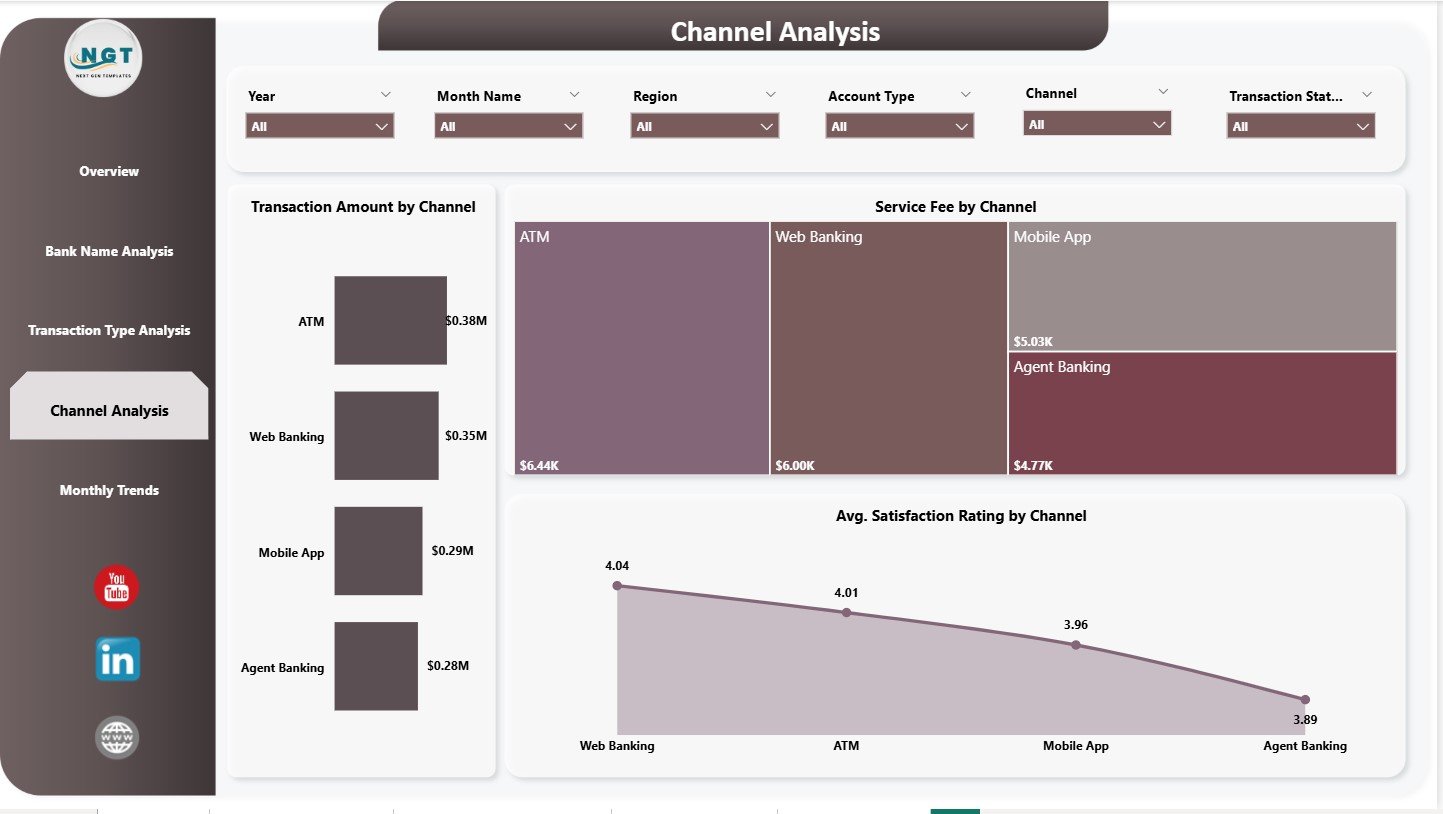
4️⃣ Channel Analysis Page – Evaluate Digital Platforms
Charts reveal:
-
Most used channels
-
Channel-wise service fee
-
Satisfaction rating by channel
Ideal for improving mobile app, internet banking, and digital infrastructure.
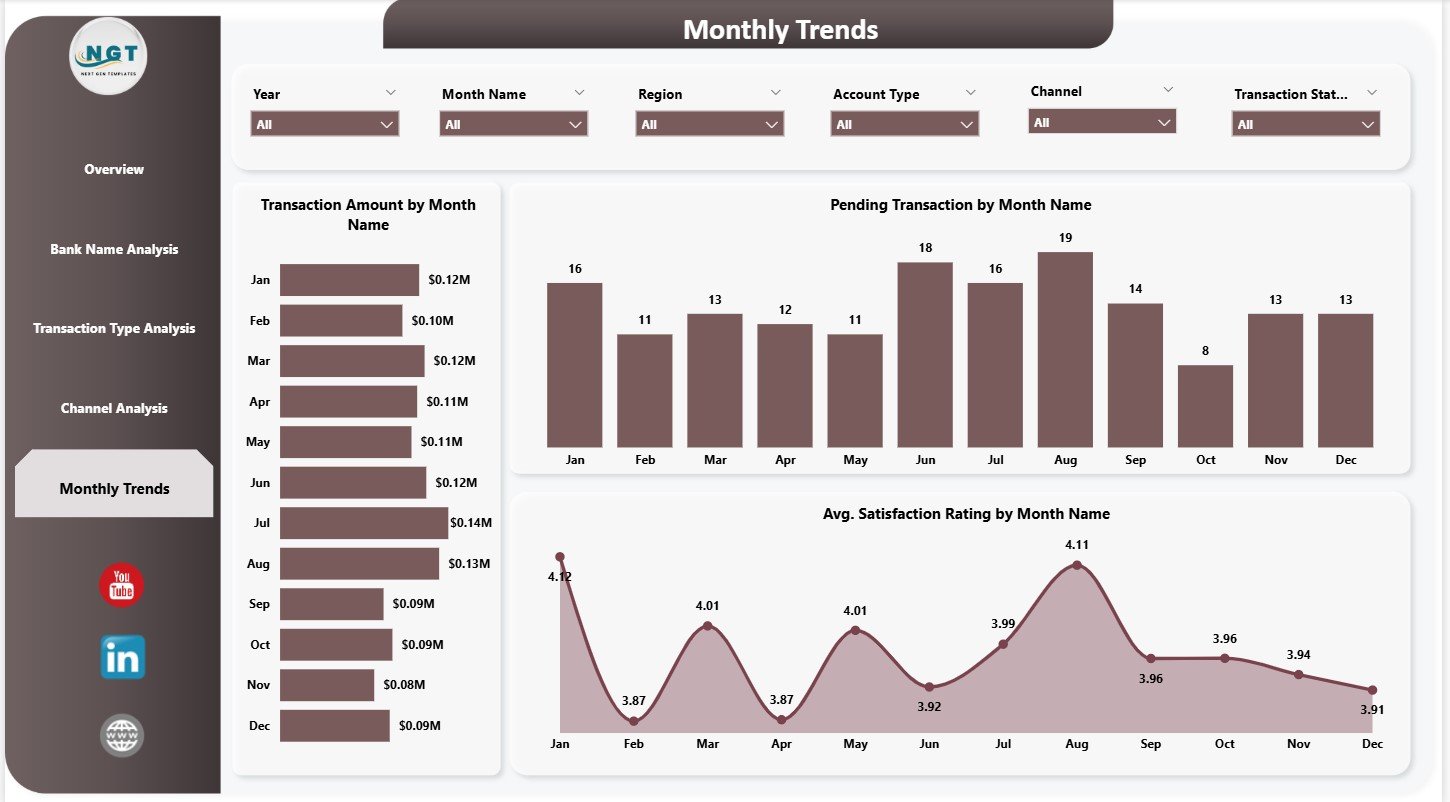
5️⃣ Monthly Trends Page – Detect Patterns Quickly
Understand monthly changes in:
-
Transaction Amount
-
Pending Transactions
-
Satisfaction Rating
Great for forecasting and operational planning.
🛠️ How to Use the Mobile Banking Dashboard
Using this dashboard is simple—even for non-technical users.
👉 Step 1: Connect Data
Use your bank’s structured transaction data as input.
👉 Step 2: Refresh Power BI
Instantly update visuals with real-time numbers.
👉 Step 3: Use Slicers
Filter by month, region, bank name, transaction type, or channel.
👉 Step 4: Explore Visuals
Analyze KPIs using cards, bar charts, line charts, and donut charts.
👉 Step 5: Identify Issues & Improve
Use failure, pending, and rating information to fix problems quickly.
👉 Step 6: Use for Review Meetings
Perfect for digital banking reviews, IT evaluations, and performance presentations.
👥 Who Can Benefit from This Dashboard
This dashboard is powerful and relevant for:
🏦 Digital Banking Teams
Track performance across every digital service.
🛠️ IT & System Reliability Teams
Identify failure hotspots and channel issues.
📣 Customer Experience Teams
Improve satisfaction with region and channel insights.
📈 Product Managers
Understand customer behavior and high-value services.
💰 Finance Departments
Monitor service fee revenue and financial growth.
🧑💼 Senior Leadership
Get a complete view of mobile banking health in seconds.
Banks aiming for fast, accurate, and customer-friendly digital services will find this dashboard indispensable.


Reviews
There are no reviews yet.