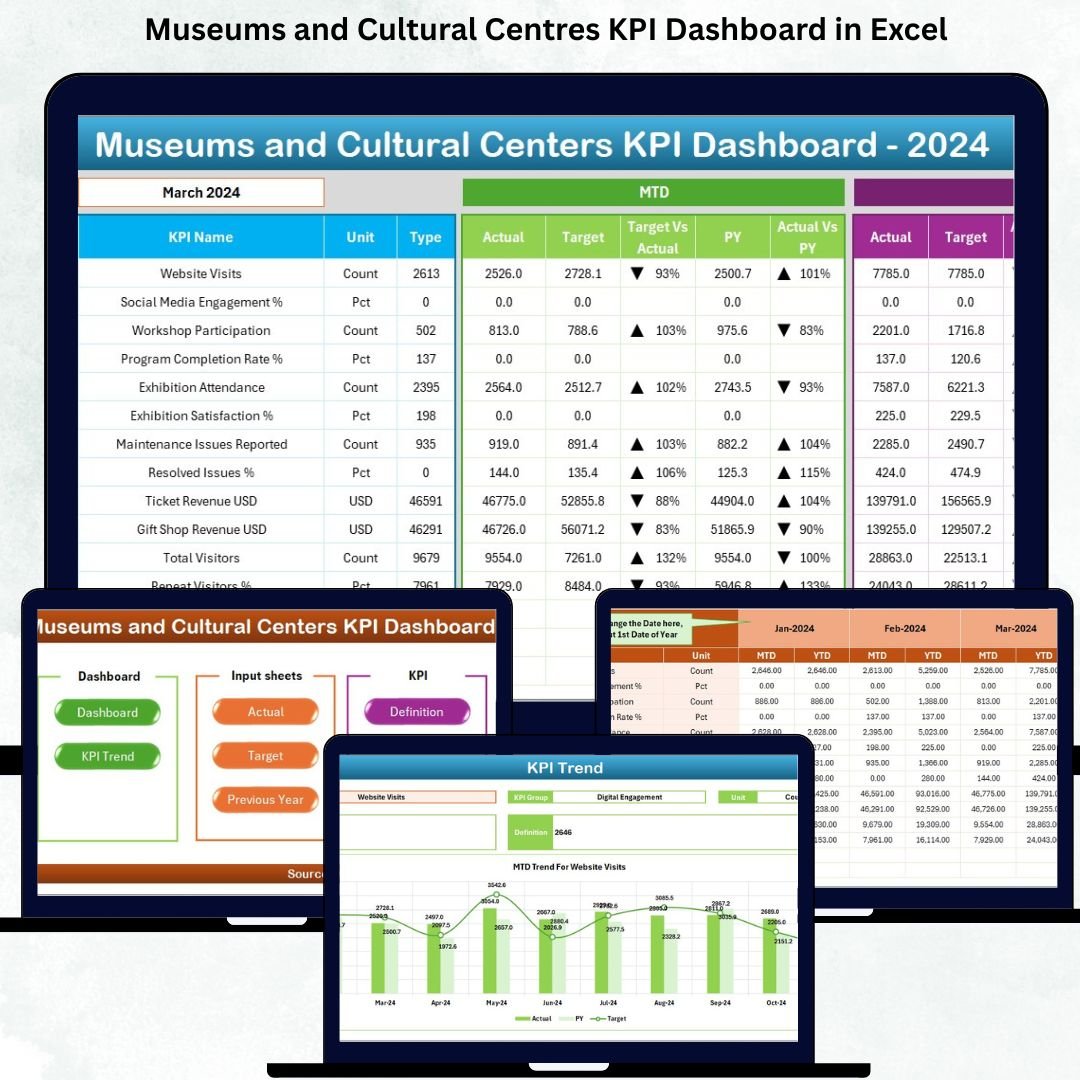


Running a museum or cultural centre involves far more than managing exhibitions and welcoming visitors. Museums and Cultural Centres KPI Dashboard in Excel Behind every successful cultural institution lies an enormous amount of operational work—visitor tracking, membership monitoring, event performance, educational programs, donation management, collection maintenance, and community engagement. Museums and Cultural Centres KPI Dashboard in Excel Without clear analytics, these numbers turn into guesswork. Museums and Cultural Centres KPI Dashboard in Excel That’s why the Museums and Cultural Centres KPI Dashboard in Excel becomes an essential tool. It gives leaders real-time clarity, helps teams stay aligned, and supports data-driven decisions that directly improve cultural impact.
Museums and Cultural Centres KPI Dashboard in Excel This ready-to-use dashboard brings together all major museum KPIs into one interactive platform. Museums and Cultural Centres KPI Dashboard in Excel with dynamic charts, dropdown filters, conditional formatting, and structured input sheets, this Excel dashboard makes performance tracking simple—even for users with basic Excel skills. Whether you manage a national museum, local cultural centre, or educational gallery, this dashboard helps you improve visibility, planning, and long-term strategic outcomes.
✨ Key Features of Museums and Cultural Centres KPI Dashboard in Excel
This dashboard is packed with powerful features designed to make museum reporting effortless and insightful.
📊 Centralized KPI Monitoring
Track visitor numbers, event participation, exhibit engagement, memberships, donations, financial KPIs, and operational metrics in one single dashboard.
📅 Month Selector for Instant Analysis
Choose any month using a dropdown, and the entire dashboard updates instantly including KPIs, charts, and performance indicators.
📈 MTD & YTD Comparisons
View Month-to-Date and Year-to-Date performance for Actual, Target, and Previous Year values—ideal for reviews and forecasting.
🟢🔴 Smart Performance Indicators
Up and down arrows automatically highlight performance gaps and improvements.
📉 Trend Analysis Page
View MTD and YTD trend charts for any KPI—perfect for understanding seasonal patterns, visitor cycles, and program growth.
📋 Transparent KPI Definitions
Each KPI includes clear formulas, definitions, units, and type (LTB/UTB) for perfect cross-team alignment.
🔗 Simple Excel-Based Data Entry
Update Actual, Target, and Previous Year sheets—no technical knowledge required. Refreshing is automatic.
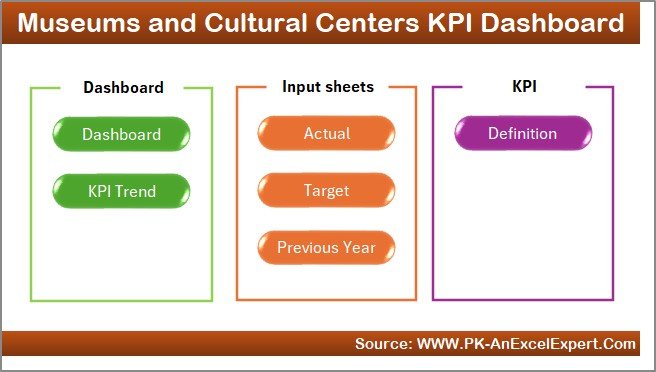
📦 What’s Inside the Museums and Cultural Centres KPI Dashboard
This dashboard includes 7 professionally structured worksheets; each created for accuracy and ease of use:
1️⃣ Home Sheet – Quick Navigation Hub
A clean, button-based index page that lets users jump directly to Dashboard, KPI Trends, Input Sheets, and Definitions.
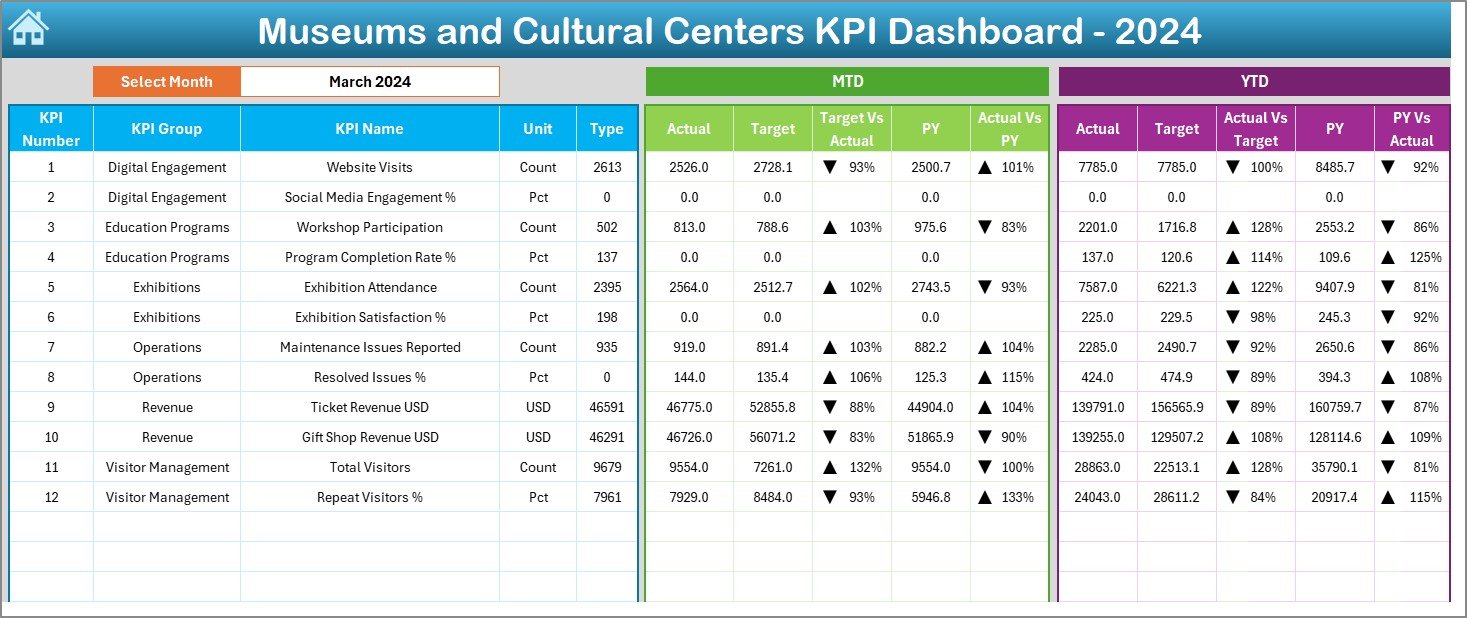
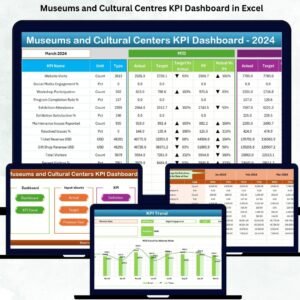
2️⃣ Dashboard Sheet – Main Reporting View
The core reporting area displaying:
-
MTD Actual, Target & Previous Year
-
YTD Actual, Target & Previous Year
-
Percentage comparisons
-
Smart conditional arrows
-
Month filter to instantly update all values
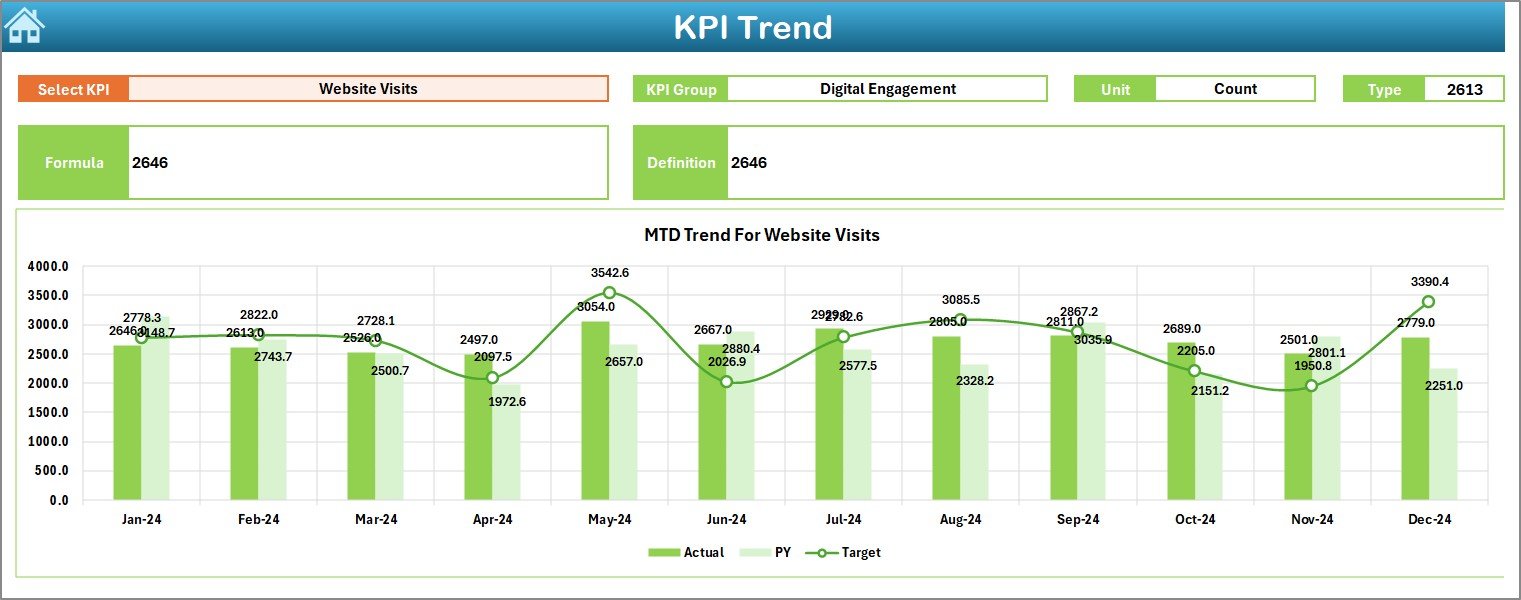
3️⃣ KPI Trend Sheet – Deep Performance Insights
Select any KPI from a dropdown and instantly view:
-
KPI Group
-
Formula, Definition & Unit
-
MTD Trend Chart
-
YTD Trend Chart
This helps museum teams understand long-term patterns and performance shifts.
4️⃣ Actual Numbers Input Sheet
Enter actual monthly values for all KPIs—visitor data, donor contributions, event attendance, gift shop revenue, etc.
5️⃣ Target Sheet – Performance Goals
Set realistic monthly and yearly targets for every department.
6️⃣ Previous Year Numbers Sheet
Store last year’s KPIs for performance comparison and growth analysis.
7️⃣ KPI Definition Sheet
Detailed KPI formulas and descriptions ensuring clarity across departments.
🛠️ How to Use the Museums and Cultural Centres KPI Dashboard
Using this dashboard is simple and intuitive:
👉 Step 1: Enter Actual Numbers
Fill the Actual Input sheet monthly with MTD and YTD values.
👉 Step 2: Update Targets
Set or adjust monthly and yearly targets.
👉 Step 3: Enter Previous Year Values
Add last year’s metrics for historical comparison.
👉 Step 4: Choose a Month in the Dashboard
The entire dashboard updates instantly based on your selection.
👉 Step 5: Analyze KPIs & Trends
Use charts, arrows, and performance summaries to make smarter decisions.
👉 Step 6: Drive Improvements
Use insights for planning events, improving visitor experiences, and boosting financial performance.
👥 Who Can Benefit from This KPI Dashboard
This dashboard is perfect for:
🏛️ Museum Directors & CEOs
Get a complete performance snapshot for board reporting and strategy.
📚 Education Program Managers
Track attendance, engagement, and outreach impact.
🎨 Exhibit & Event Teams
Analyze visitor participation, event performance, and engagement levels.
💼 Finance & Fundraising Teams
Monitor revenue, donations, and shop sales.
📊 Operations & Administration
Track staffing, maintenance, costs, and efficiency KPIs.
Any cultural institution aiming to improve impact, visibility, and performance will benefit from this dashboard.


Reviews
There are no reviews yet.