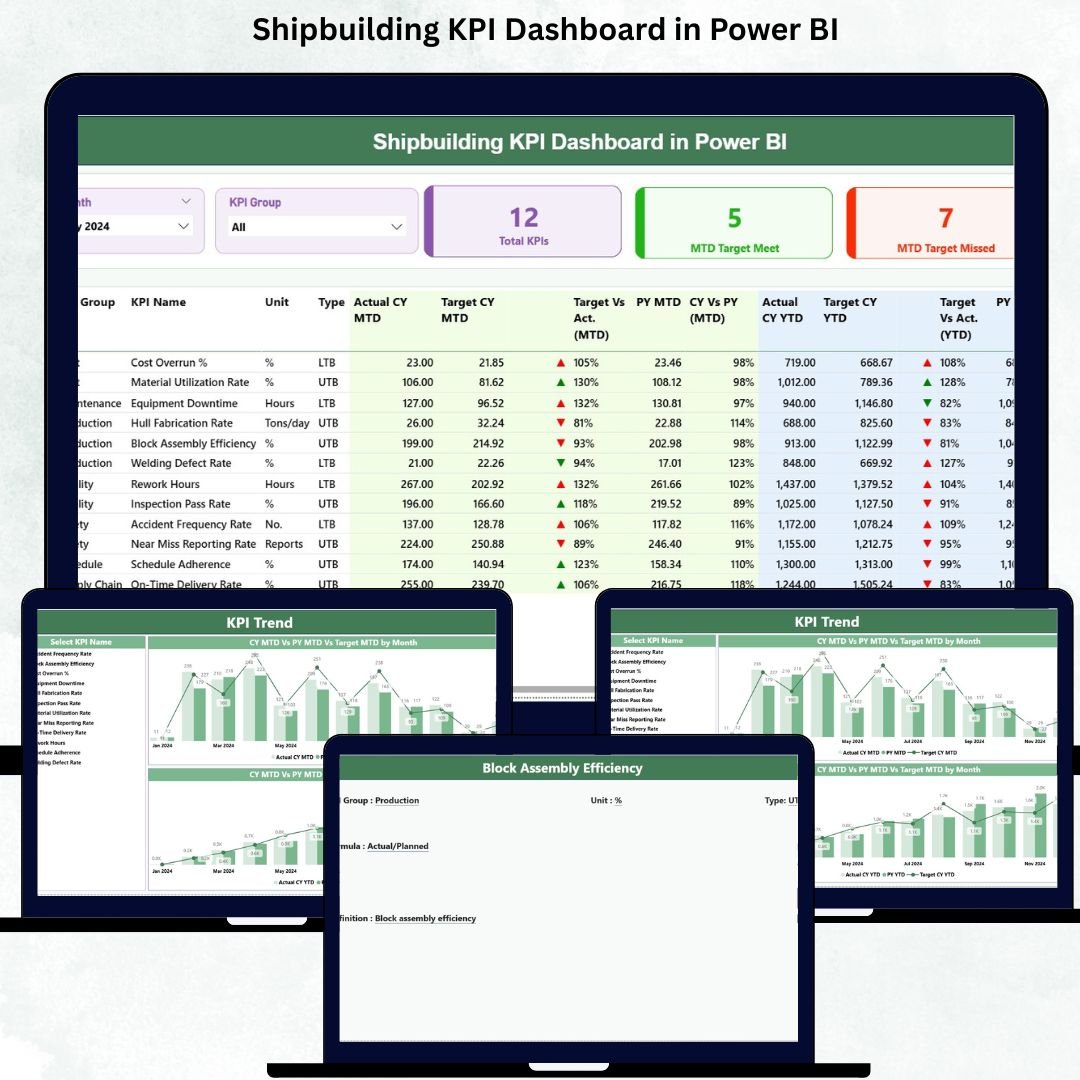
Shipbuilding projects are among the most complex engineering operations on the planet. Every shipyard handles thousands of activities daily—steel cutting, block fabrication, welding, painting, outfitting, safety checks, inspections, and final delivery milestones. Managing all these KPIs manually becomes overwhelming, slow, and error prone. That is exactly why the Shipbuilding KPI Dashboard in Power BI is the ultimate performance-monitoring solution for modern shipyards.
This ready-to-use Power BI dashboard helps shipyards gain complete visibility into production efficiency, project timelines, resource usage, safety performance, and quality metrics. Shipbuilding KPI Dashboard in Power BI With smart visuals, slicers, trend charts, and drill-through definitions, this dashboard delivers clarity, accuracy, and speed—helping leaders make confident decisions at every stage of shipbuilding.
Whether you manage fabrication lines, welding teams, assembly blocks, or overall shipyard operations, this dashboard gives you everything you need in one powerful system.
⚙️ Key Features of Shipbuilding KPI Dashboard in Power BI
This dashboard is designed to simplify complex shipyard reporting and bring all critical KPIs into one interactive platform.
📊 Unified KPI Monitoring
Track Production, Quality, Safety, Energy, Supply Chain, Dock Operations, Fabrication, and Welding KPIs from a single view.
📅 MTD, YTD & PY Comparisons
Monitor Month-to-Date, Year-to-Date, and Previous Year performance instantly to identify trends and deviations.
🟩🟥 Smart KPI Indicators
Green and red arrow icons make it easy to detect improvement or decline at a glance.
🧭 Interactive Slicers
Switch between months and KPI groups effortlessly—no manual filtering required.
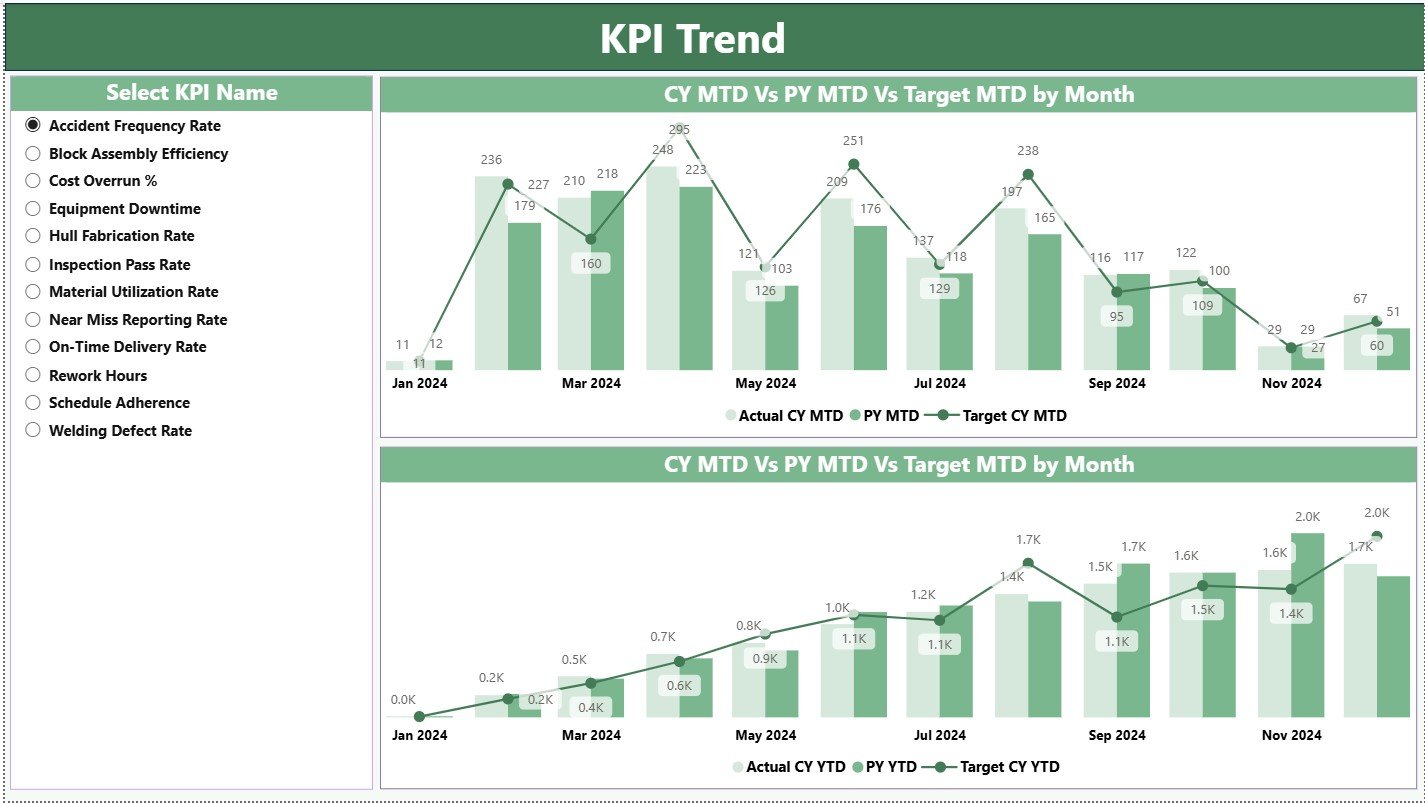
📈 Trend Charts for Deeper Analysis
Combo charts show Actual vs Target vs Previous Year analytics for MTD and YTD performance.
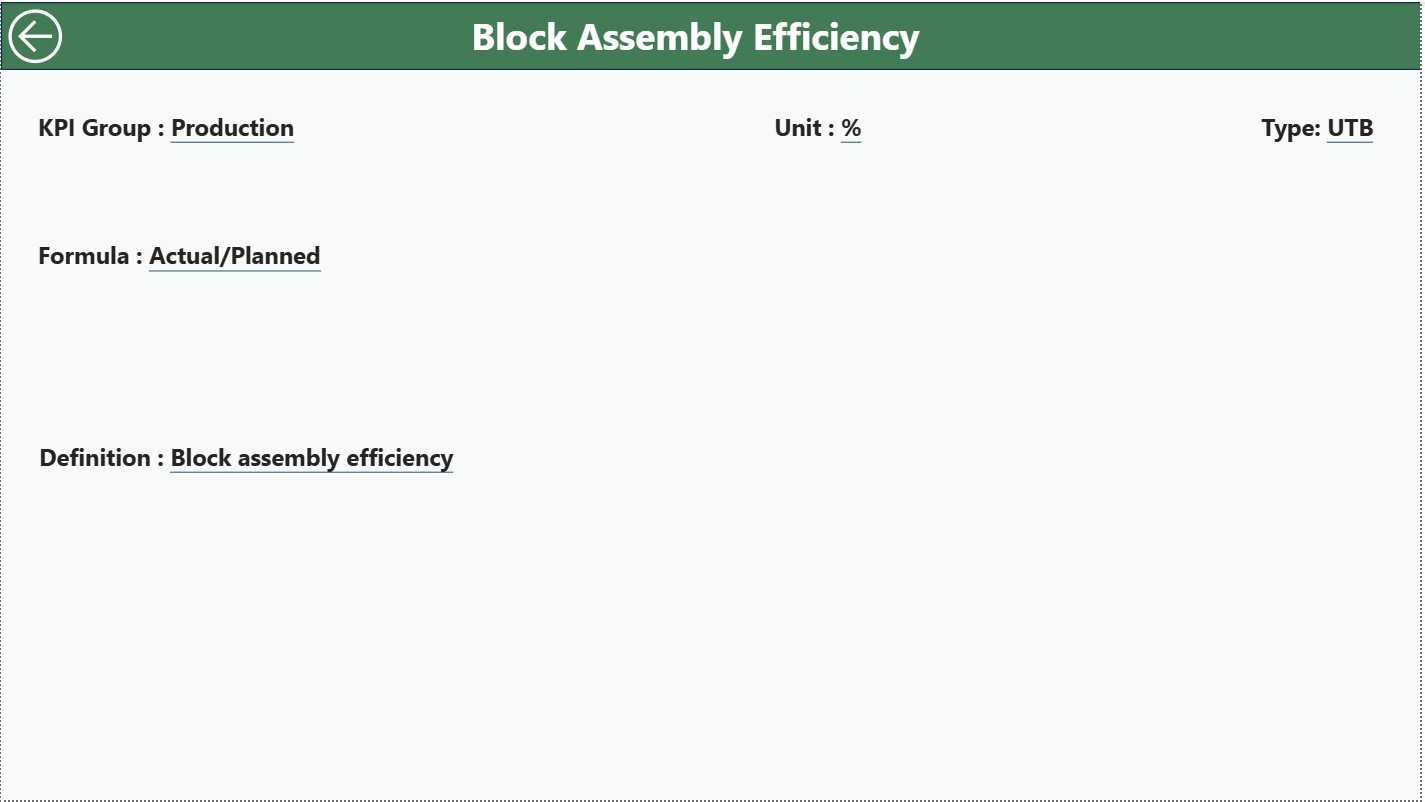
🔍 Drill-Through KPI Definition Page
Right-click to view detailed KPI formulas, definitions, and type (LTB/UTB)—perfect for alignment across departments.
🔗 Excel-Connected & Auto-Updating
Just update the Excel sheets → refresh in Power BI → dashboard updates instantly.
This dashboard transforms raw numbers into meaningful insights within seconds.
📦 What’s Inside the Shipbuilding KPI Dashboard
When you get this product, you receive a complete reporting ecosystem designed specifically for shipyards.
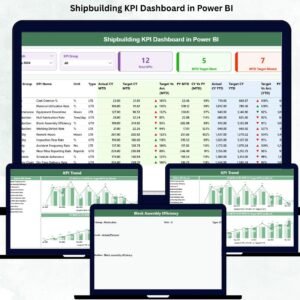
1️⃣ Summary Page – Main Control Center
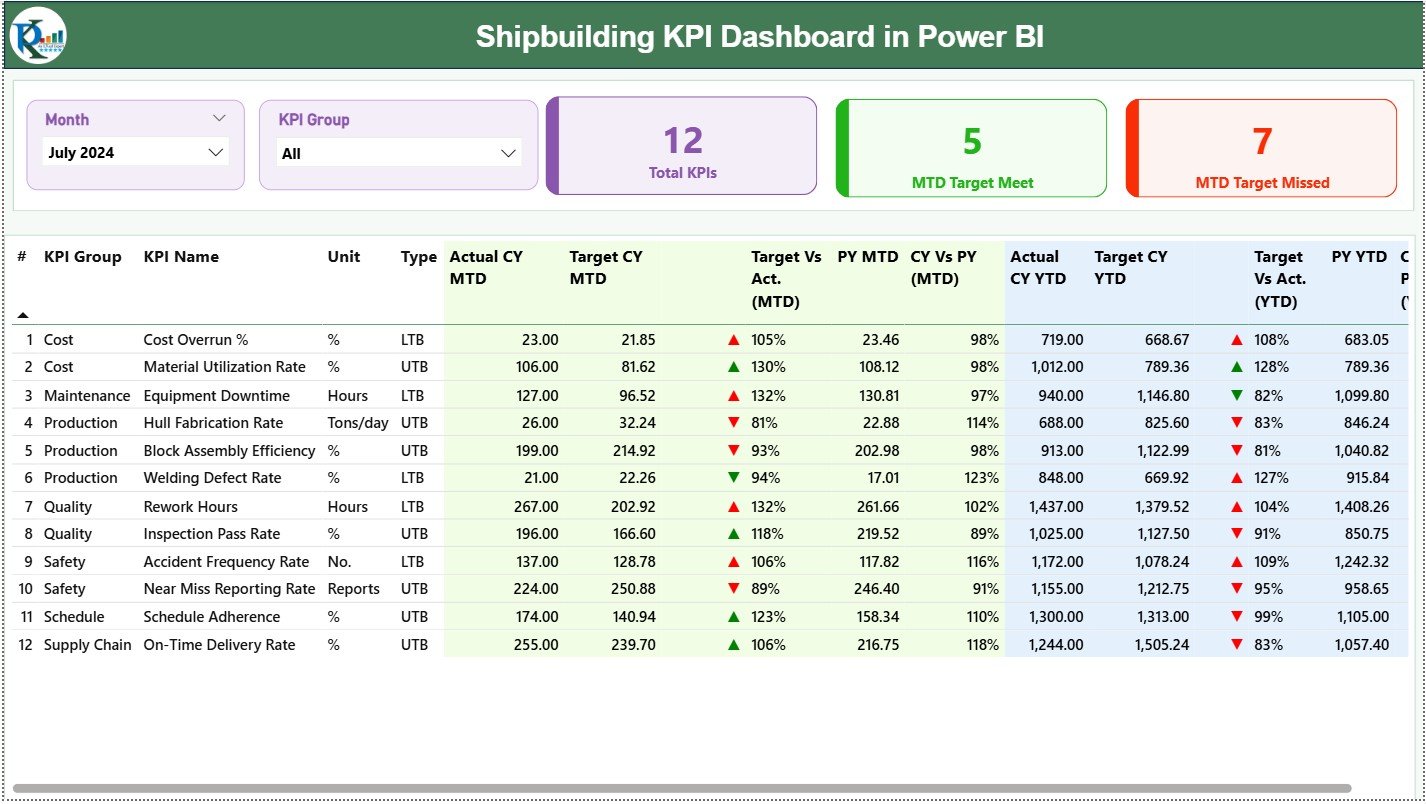
Shows KPI cards, slicers, and a detailed KPI table covering:
-
Actual vs Target (MTD & YTD)
-
Previous Year comparison
-
KPI Status Icons
-
KPI Numbers, Groups & Units
Perfect for daily monitoring and management reviews.
2️⃣ KPI Trend Page – Visual Performance Tracking
Two combo charts display MTD and YTD trends with Actual CY, Target CY, and Actual PY values.
Ideal for:
-
Welding efficiency
-
Block assembly progress
-
Outfitting completion
-
Safety trends
-
Dock usage
-
Steel cutting and fabrication
3️⃣ KPI Definition Page – Full KPI Clarity
Includes KPI Name, Group, Unit, Formula, Definition, and Type.
Helps eliminate confusion and create organization-wide KPI alignment.
4️⃣ Excel Data Files
Structured sheets for Actuals, Targets, and Definitions—simple to update, even for non-technical users.
🛠️ How to Use the Shipbuilding KPI Dashboard
Using this dashboard is incredibly simple, even for beginners.
👉 Step 1:
Enter Actual and Target values in the Excel sheets.
👉 Step 2:
Click Refresh in Power BI Desktop.
👉 Step 3:
Use Month and KPI Group slicers to explore performance.
👉 Step 4:
Analyze trends using the MTD and YTD charts.
👉 Step 5:
Drill through to check KPI definitions before making decisions.
👉 Step 6:
Use charts and insights for monthly and annual review meetings.
Within minutes, you’ll have a complete performance snapshot of your shipyard.
👥 Who Can Benefit from This Dashboard
The Shipbuilding KPI Dashboard in Power BI is designed for multiple departments, including:
🏭 Production Teams
Track steel cutting, welding hours, block assembly, outfitting progress.
🧪 Quality Control Teams
Monitor defect rate, rework hours, and inspection pass percentage.
🦺 Safety Departments
Track incidents, near misses, and compliance indicators.
🚢 Project Management
Monitor timeline variance, milestones, and delivery progress.
🔩 Supply Chain Teams
Track material availability, crane usage, dock occupancy, and logistics KPIs.
📊 Senior Leadership
Review entire shipyard performance in one interactive dashboard.
This dashboard helps every team stay aligned and informed.


Reviews
There are no reviews yet.