Channel sales are the backbone of many businesses—whether you’re selling through retail stores, distributors, wholesalers, online platforms, or direct channels. But when sales data sits in different files and disconnected reports, teams quickly lose visibility. This leads to delays in decision-making, poor forecasting, inaccurate analysis, and missed growth opportunities.
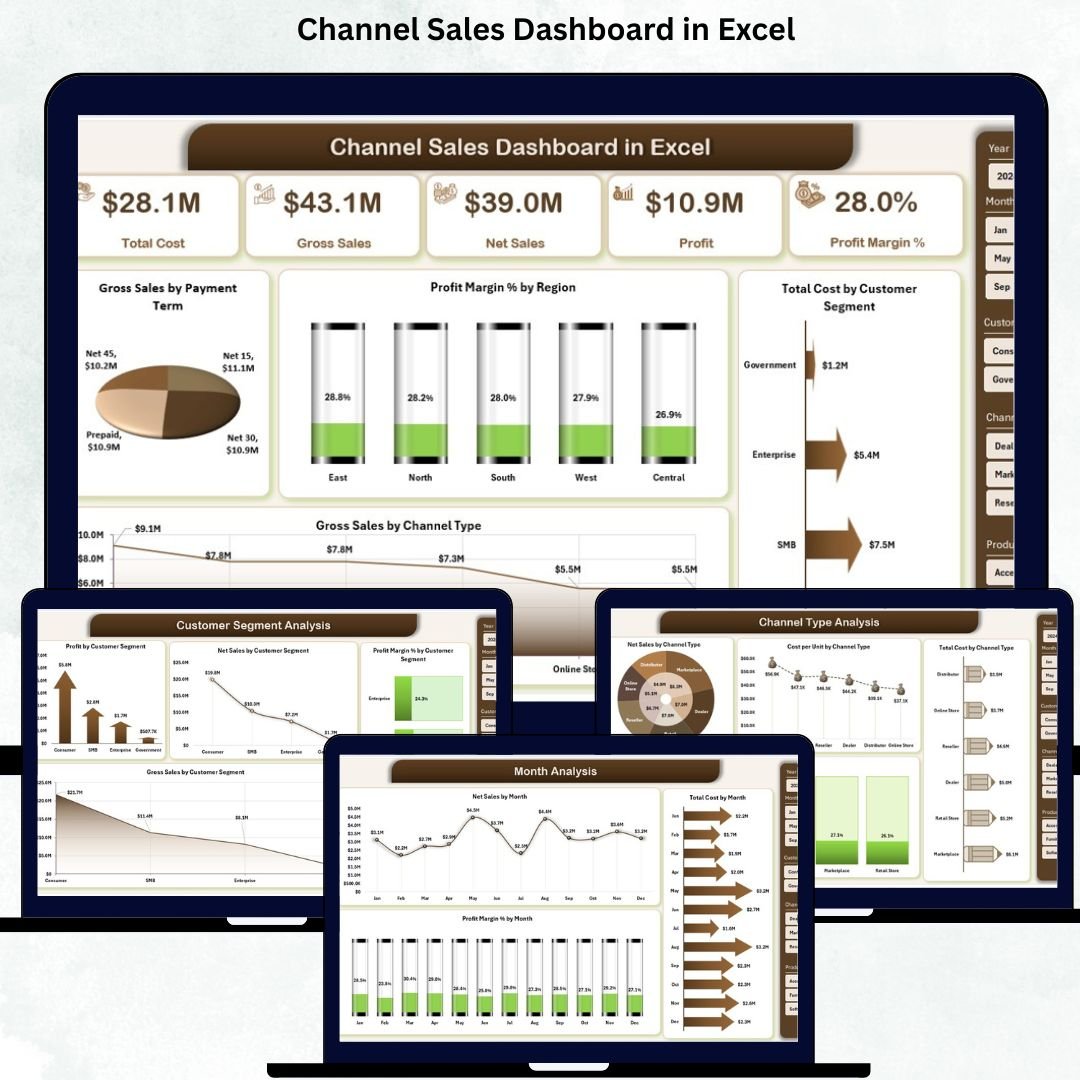
The Channel Sales Dashboard in Excel solves this problem instantly. It brings all important KPIs, trends, and channel comparisons into one clean, interactive dashboard. With dynamic visuals, slicers, navigation buttons, and automated calculations, managers get a complete view of performance across every channel. Designed for brands, sales teams, distributors, and business leaders, this dashboard delivers clarity, speed, and data-backed insights—all inside Microsoft Excel.
Built with a professional layout and easy-to-use structure, the dashboard pulls data from a simple Data Sheet. Once you enter or update your numbers, the dashboard updates automatically. You get instant insights across gross sales, net sales, profit margin %, product category performance, customer segment contribution, and month-wise patterns. This helps you make informed decisions, improve sales strategy, and strengthen channel partnerships.
📊 Key Features of the Channel Sales Dashboard in Excel
This dashboard comes with five advanced analysis pages, each designed to improve visibility and decision-making.
⭐ 1. Overview Page – Your Main Control Center
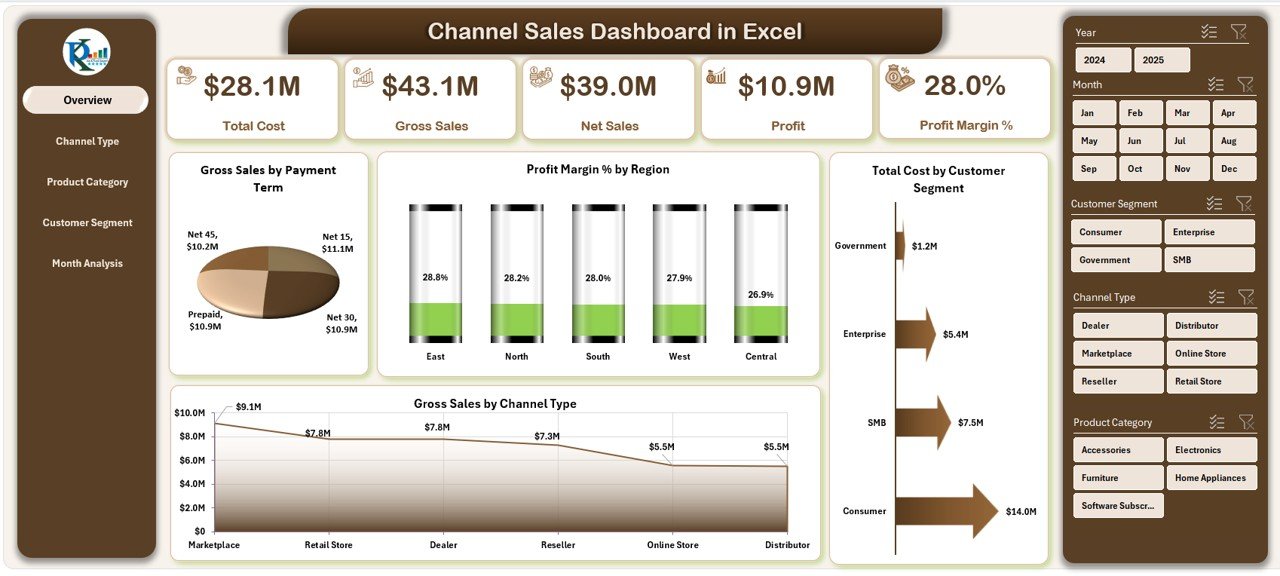
The Overview Page gives a complete snapshot of overall business performance.
It includes:
-
✔ Page Navigator on the left
-
✔ Five Insight Cards showing key KPIs
-
✔ Four powerful charts:
-
Gross Sales by Payment Term
-
Profit Margin % by Region
-
Total Cost by Customer Segment
-
Gross Sales by Channel Type
-
This page helps you instantly identify your top-performing channels, cost-heavy segments, and profitable regions—all in one place.
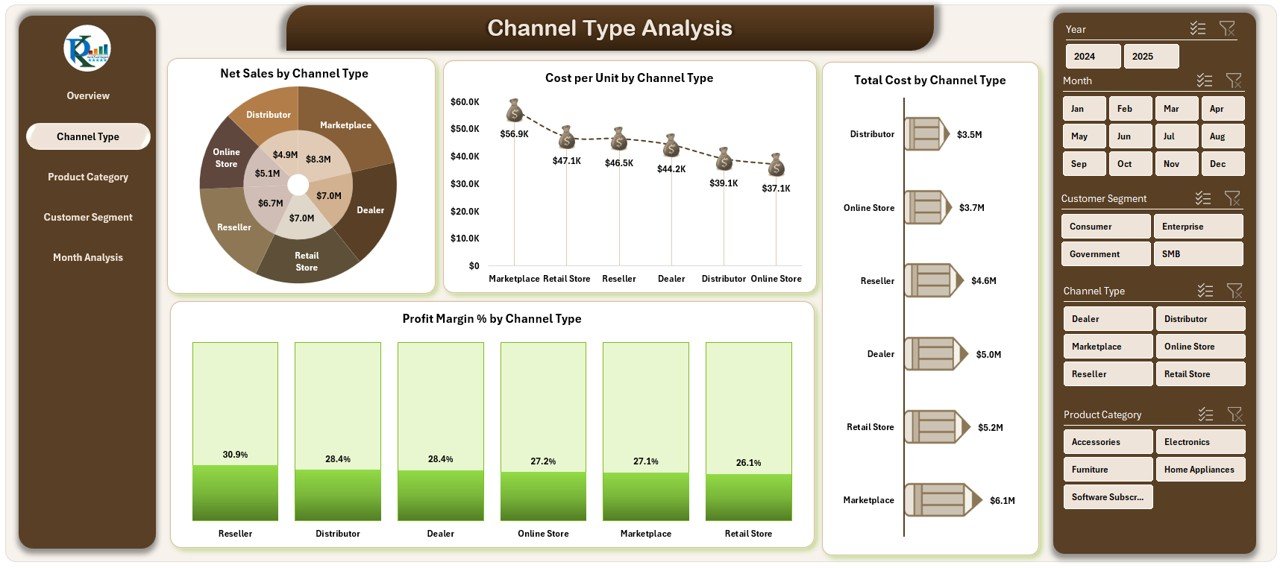
⭐ 2. Channel Type Analysis Page – Compare Channel Performance
This page helps you compare every sales channel individually.
You can view:
-
✔ Net Sales by Channel Type
-
✔ Cost per Unit by Channel Type
-
✔ Total Cost by Channel Type
-
✔ Profit Margin % by Channel Type
These insights help you optimize channel strategies, focus on profitable channels, and reduce losses from low-performing ones.
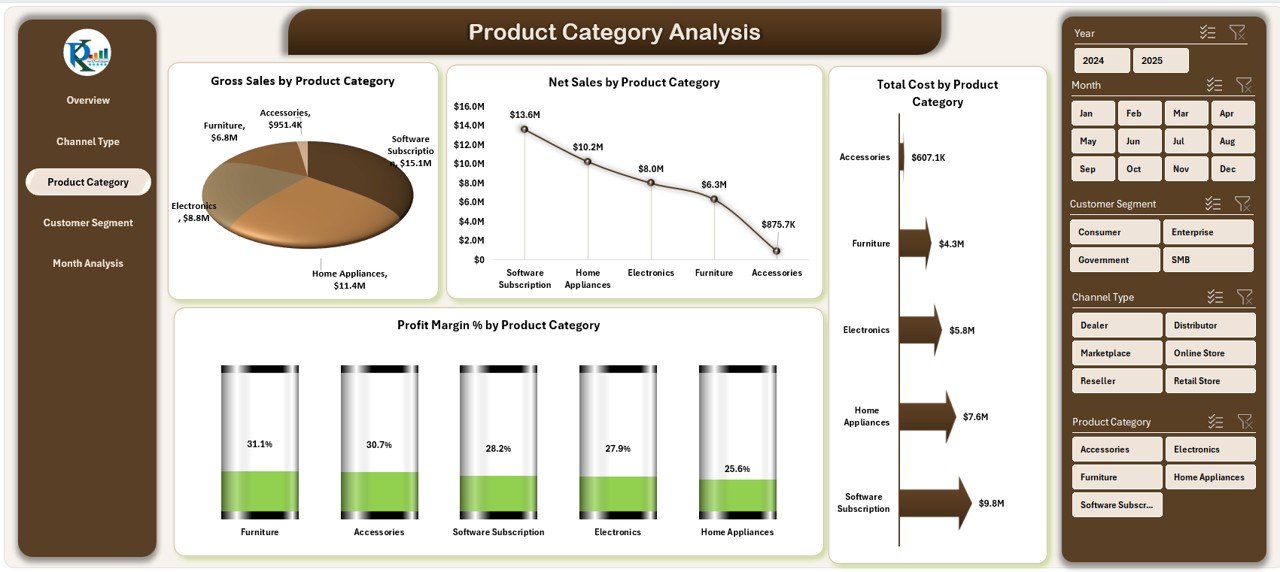
⭐ 3. Product Category Analysis Page – Discover Which Categories Drive Growth
Every product category behaves differently. This page gives clarity on category-level performance with visuals for:
-
✔ Gross Sales by Product Category
-
✔ Net Sales by Product Category
-
✔ Total Cost by Product Category
-
✔ Profit Margin % by Product Category
You can easily identify high-growth categories and reduce spending on underperforming ones.
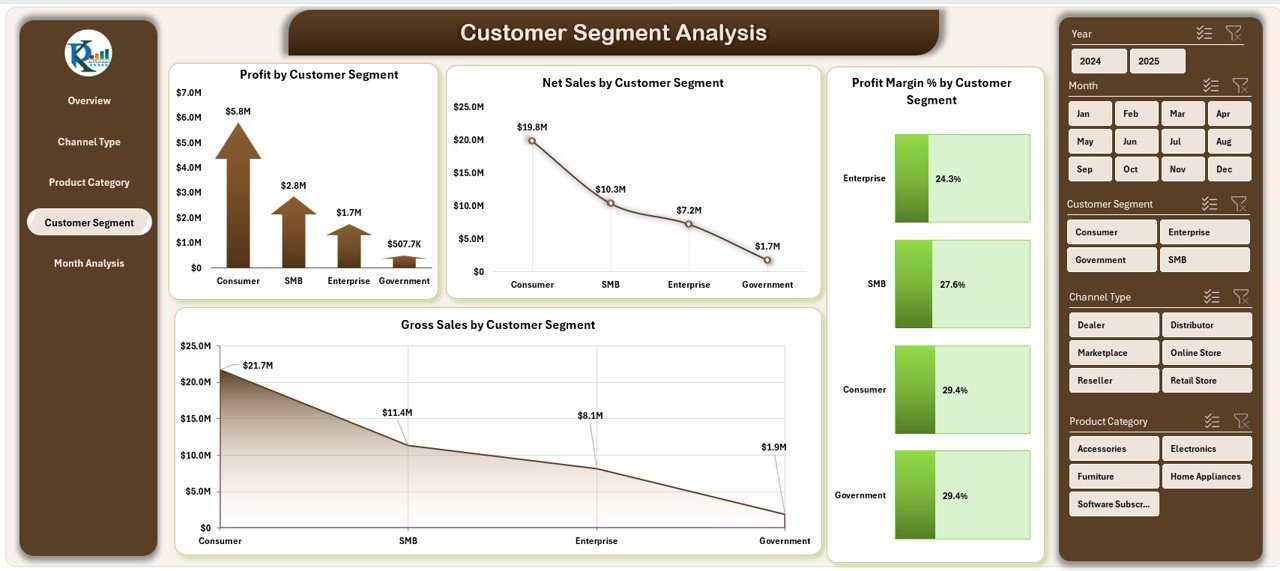
⭐ 4. Customer Segment Analysis Page – Understand Your Best Customers
Customer segments influence sales volume, profitability, and demand.
This page includes:
-
✔ Profit by Customer Segment
-
✔ Net Sales by Customer Segment
-
✔ Profit Margin % by Customer Segment
-
✔ Gross Sales by Customer Segment
These insights reveal which segments generate the most revenue and which require new strategies.
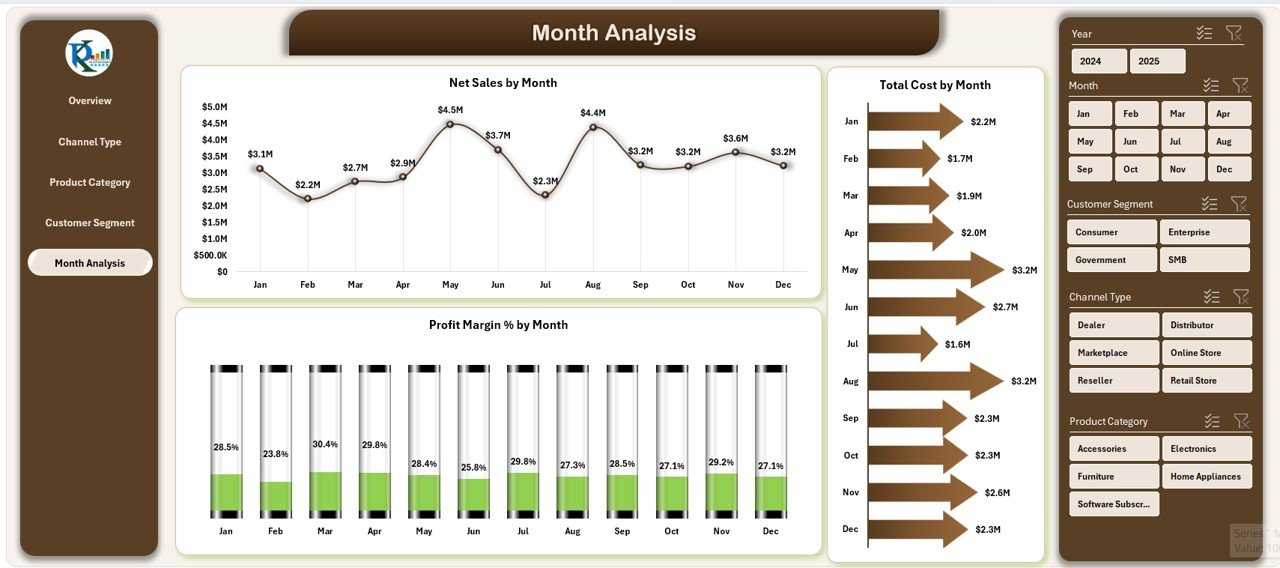
⭐ 5. Month Analysis Page – Track Performance Trends Over Time
Monthly analysis helps you understand seasonality, growth, and cost patterns.
This page shows:
-
✔ Net Sales by Month
-
✔ Total Cost by Month
-
✔ Profit Margin % by Month
You can compare monthly results, monitor growth trends, and plan future sales strategies more accurately.
📦 What’s Inside the Channel Sales Dashboard in Excel
When you download this dashboard, you receive:
-
A professionally designed Excel dashboard with 5 analysis pages
-
A Data Sheet where you enter raw numbers
-
Auto-refresh visuals
-
KPI cards for quick monitoring
-
Navigation buttons for smooth movement between pages
-
Clean charts and comparisons for every channel
-
Fully customizable layouts
All you need to do is update the Data Sheet—and the rest updates automatically.
🧩 How to Use the Channel Sales Dashboard Effectively
Using the dashboard is extremely simple:
-
📥 Enter your sales data in the Data Sheet
-
🔄 Refresh the dashboard
-
🎚 Filter results by channel, region, customer segment, or month
-
📊 Compare gross sales, net sales, and profit margins
-
🔍 Review product categories and customer insights
-
🚀 Adjust sales strategies based on performance
-
📈 Track monthly progress and improve forecasting
No coding or advanced Excel knowledge required.
👤 Who Can Benefit from This Channel Sales Dashboard
This dashboard is perfect for:
-
🧑💼 Sales Managers
-
📦 Distributor & Retail Managers
-
🛒 E-Commerce Teams
-
📊 Sales Analysts
-
🧭 Business Leaders
-
📈 Revenue & Finance Teams
-
🏷 Brand Managers
Anyone involved in sales planning, analysis, or decision-making will find this dashboard extremely valuable.
### Click hare to read the Detailed blog post
Visit our YouTube channel to learn step-by-step video tutorials
👉 Youtube.com/@PKAnExcelExpert


Reviews
There are no reviews yet.