The textiles and apparel industry runs on speed, accuracy, and perfect coordination. Production teams race to hit deadlines, quality teams monitor defects every hour, and management needs real-time visibility before making any decision. When information sits in multiple spreadsheets and emails, delays and errors quickly pile up.Textiles & Apparel Manufacturing KPI Dashboard in Power BI
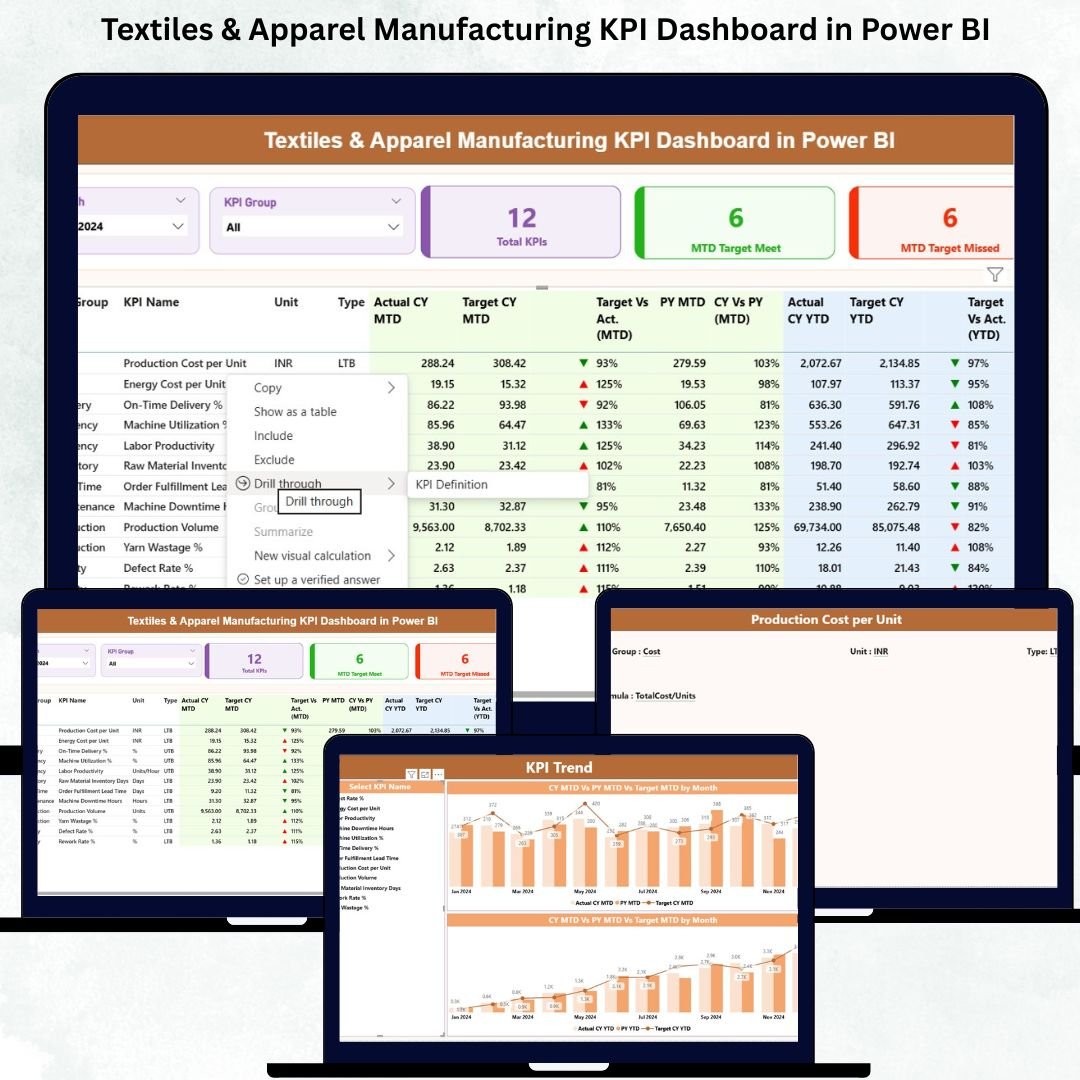
That’s exactly where the Textiles & Apparel Manufacturing KPI Dashboard in Power BI becomes a game-changer. This ready-to-use dashboard centralizes your production, quality, supply chain, efficiency, and cost KPIs into one powerful analytics system. No more guesswork. No more scattered data. Just clean insights that help every department take smarter, faster decisions.
Designed for textile mills, garment manufacturers, export houses, and apparel factories, this dashboard converts your Excel data into live visuals, interactive filters, drill-through pages, and a complete performance story. Whether you monitor monthly trends or compare year-to-date progress, Power BI gives you the clarity and automation needed to stay ahead of competition.
✨ Key Features of the Textiles & Apparel Manufacturing KPI Dashboard in Power BI
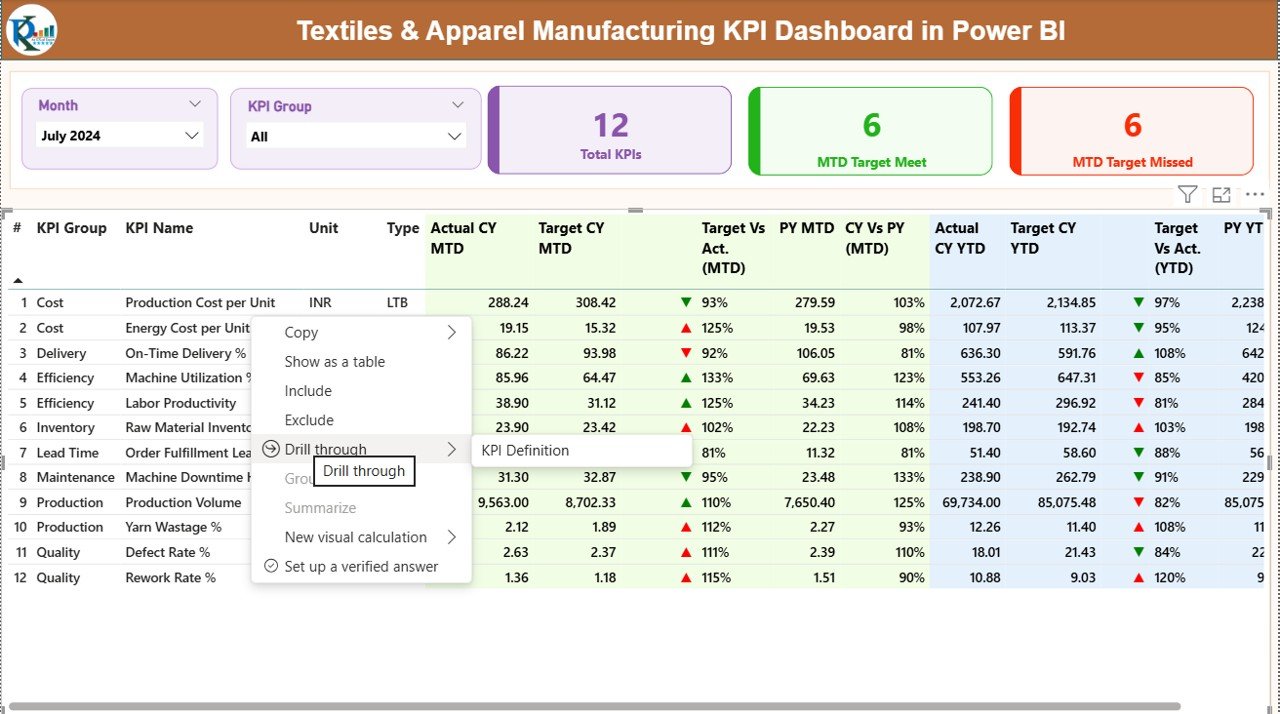
🚀 1. Summary Page – Your Central Control Panel
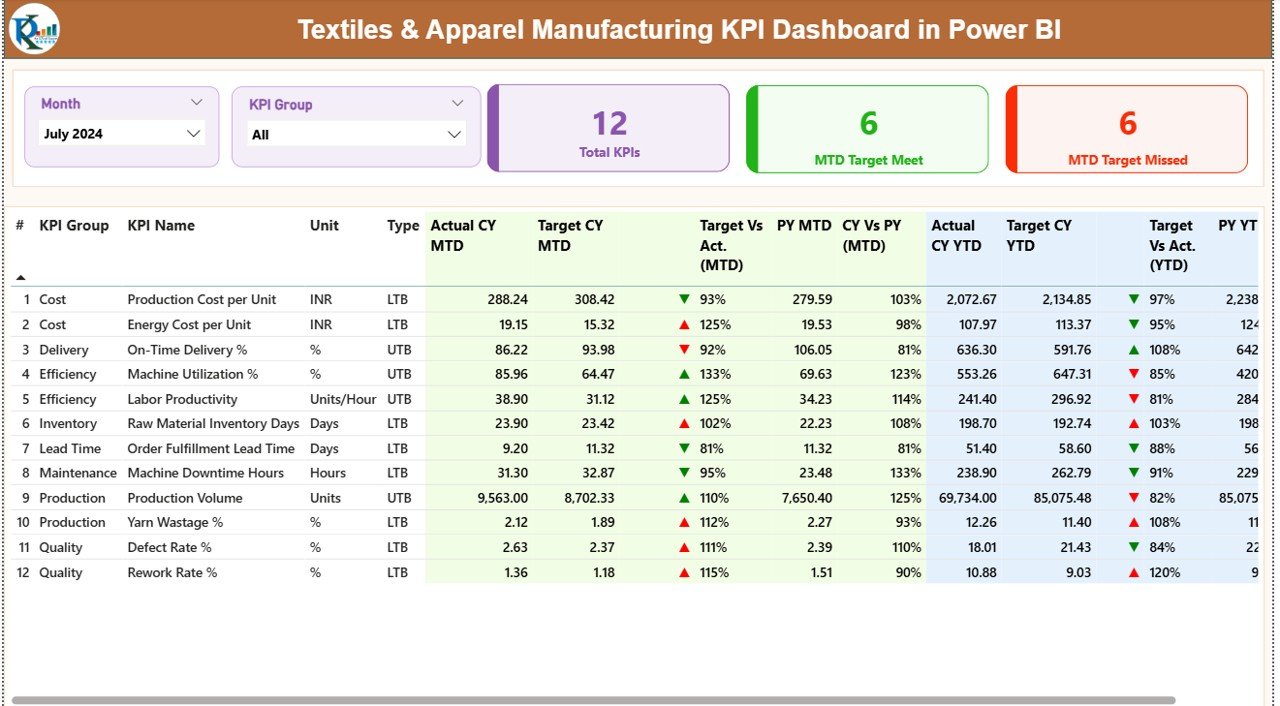
The Summary Page gives you instant visibility into production, quality, efficiency, cost, and delivery KPIs.
You get:
-
Month & KPI Group slicers for quick filteringTextiles & Apparel Manufacturing KPI Dashboard in Power BI
-
Performance cards showing Total KPIs, MTD Target Met, and MTD Target Missed
-
Detailed KPI table with MTD, YTD, Target, PY comparison, and trend icons (▲▼)
This page instantly highlights what’s working and what needs immediate attention—helping managers act faster.
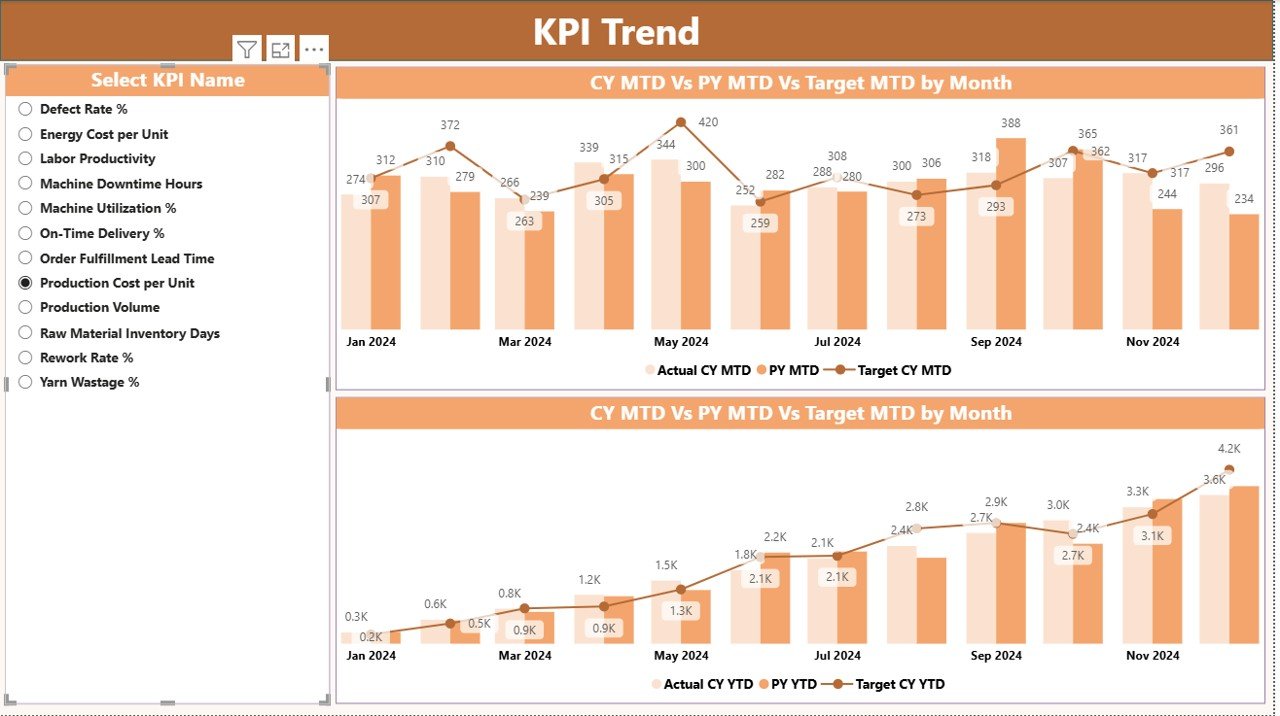
📈 2. KPI Trend Page – Track Patterns & Seasonal Changes
Spot performance shifts with two dynamic combo charts:
-
MTD Trend – Actual vs Target vs Previous Year
-
YTD Trend – Cumulative performance comparison
This helps you understand seasonal fluctuations, identify bottlenecks, predict capacity, and plan future orders accurately.
Textiles & Apparel Manufacturing KPI Dashboard in Power BI
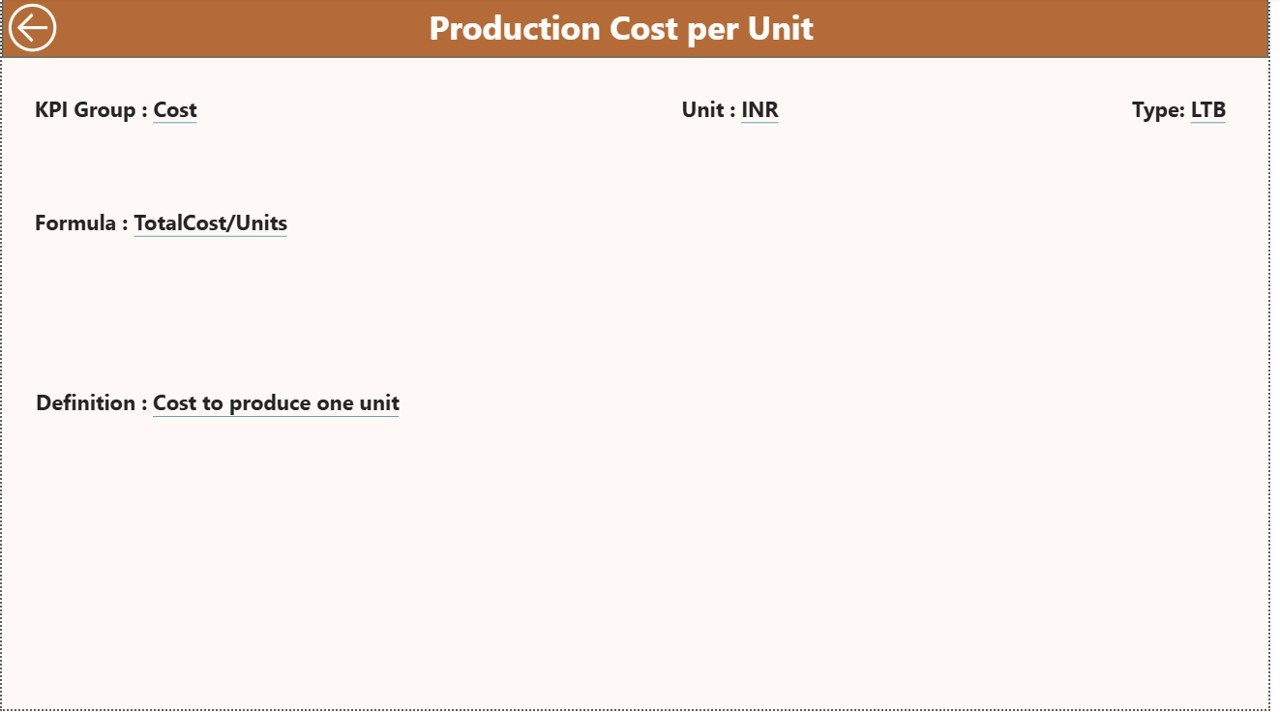
📘 3. KPI Definition Page – Understand Every KPI Clearly
To avoid confusion across departments, this drill-through page displays:
-
KPI Formula
-
KPI Definition
-
KPI Group & Type (LTB/UTB)
Every team follows the same meaning and measurement—ensuring data accuracy and alignment.
📦 What’s Inside the Textiles & Apparel Manufacturing KPI Dashboard
You get a complete Power BI dashboard powered by a well-structured Excel file. The dataset includes:
-
Input Actual Sheet – CY MTD, CY YTD, monthly actuals
-
Input Target Sheet – Target MTD & YTDTextiles & Apparel Manufacturing KPI Dashboard in Power BI
-
KPI Definition Sheet – Units, formulas, definitions, KPI type
This structure makes updating data extremely simple—just replace numbers in Excel and refresh Power BI.
🛠 How to Use the Textiles & Apparel Manufacturing KPI Dashboard
Step 1: Update Excel Data
Fill in the monthly Actual & Target values for every KPI.
Textiles & Apparel Manufacturing KPI Dashboard in Power BI
Step 2: Refresh Power BI
Hit refresh and the entire dashboard updates instantly.
Step 3: Select Month & KPI Group
Use slicers to view performance category-wise or month-wise.
Step 4: Study Summary Page
Quickly identify areas where performance is dropping or improving.
Step 5: Explore Trends
Use the KPI Trend Page to evaluate seasonal shifts or workflow bottlenecks.
Step 6: Drill Through Definitions
Click any KPI to understand formula, definition, unit, and type.
Textiles & Apparel Manufacturing KPI Dashboard in Power BI
This smooth workflow removes manual effort and keeps your reporting real-time.
🎯 Who Can Benefit from This Dashboard?
👕 Production Managers
Track fabric output, stitching lines, machine efficiency, and daily operations.
🧵 Quality Teams
Analyze defect rates, rework, first pass yield, and defect trends across machines/lines.
🚚 Supply Chain Teams
Monitor lead times, supplier scores, material availability, and delivery performance.
💰 Finance Departments
Review waste %, labor cost per output, energy cost, and cost per unit.
📈 Senior Management & Business Owners
Make data-driven decisions with complete visibility across the manufacturing cycle.
### Click here to read the Detailed blog post
Watch the step-by-step video tutorial:


Reviews
There are no reviews yet.