Managing a brand becomes easier when you have clear, accurate, and timely data. Companies run ads, launch campaigns, promote different products, and build brand awareness every single day. But when information sits across scattered spreadsheets, disconnected tools, and incomplete reports, teams lose visibility and waste countless hours. This leads to slow decisions, poor campaign execution, and missed growth opportunities.
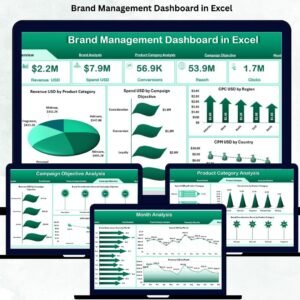
The Brand Management Dashboard in Excel solves these challenges instantly. It gives you a clean, interactive, and data-driven way to monitor brand performance across regions, product categories, months, and campaign objectives. Instead of guessing what works, your team can see the truth with clear charts, KPIs, and powerful slicers—all inside Excel, without any technical skills.
This dashboard transforms raw marketing data into meaningful insights such as revenue, spend, brand awareness score, brand consideration score, brand preference score, CPM, CPU, conversion rate, and more. Whether you’re a brand manager, marketing analyst, product owner, or leadership professional, this dashboard becomes your complete command center for managing brand success.
📊 Key Features of the Brand Management Dashboard in Excel
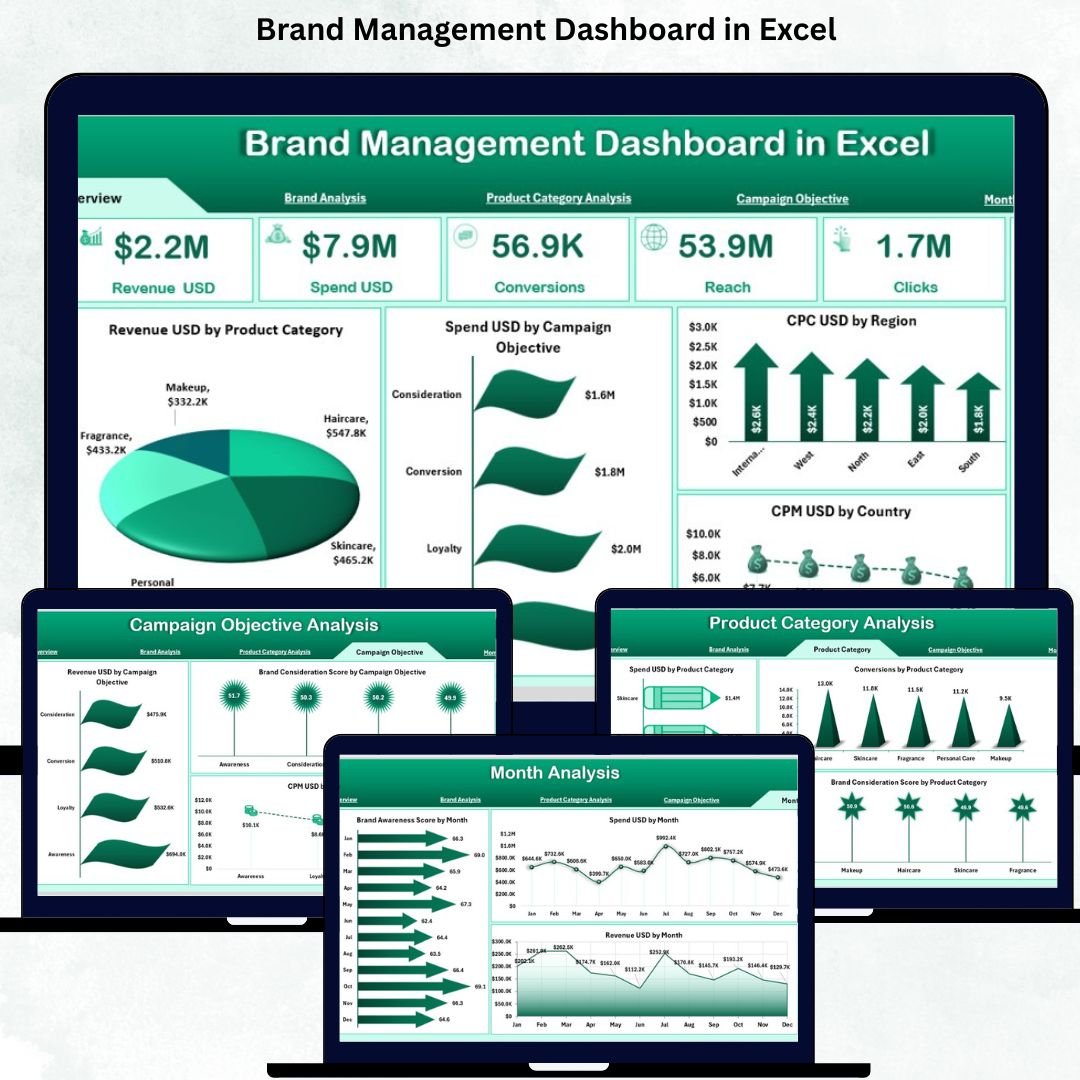
The dashboard includes a left-side Page Navigator that allows you to move quickly between different views. With five analytical pages and a dedicated data structure, it becomes a powerful tool for analyzing every part of your branding strategy.
⭐ 1. Overview Page – Your Brand’s Performance in One Place
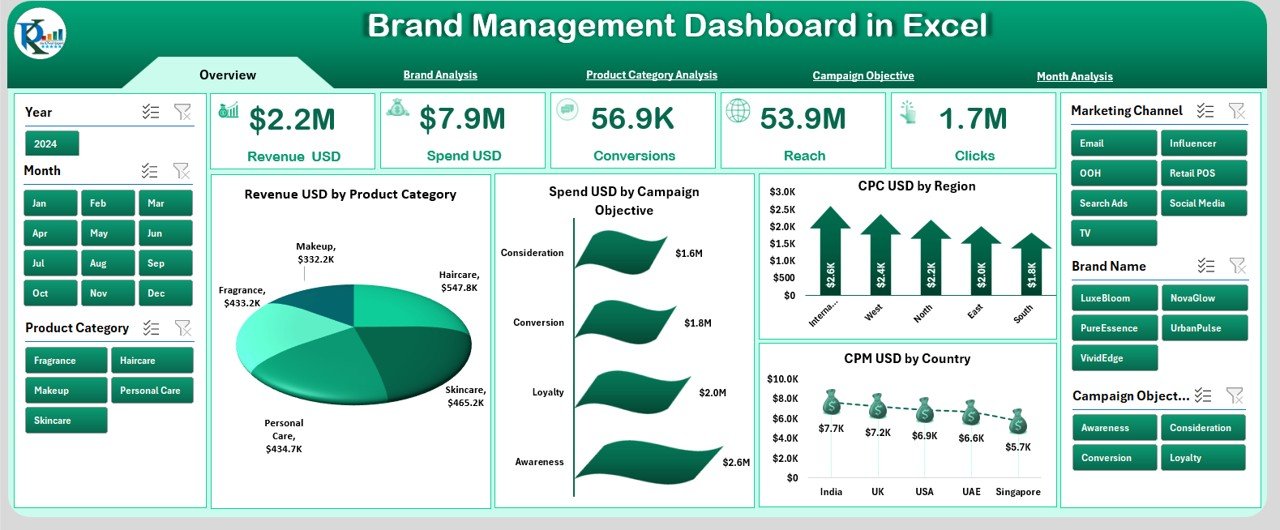
The Overview Page is the most important screen of the dashboard.
It includes:
-
✔ Right-side Slicer Panel to filter by region, country, brand, product category, month, and campaign objective
-
✔ Five KPI Cards showing:
-
Revenue (USD)
-
Spend (USD)
-
CPU (Cost per Unit)
-
CPM (Cost per Thousand Impressions)
-
Overall Brand Performance Score
-
-
✔ Four key charts displaying:
-
Revenue by Product Category
-
Spend by Campaign Objective
-
CPU by Region
-
CPU by Country
-
This page helps you instantly understand where your brand is performing well and where attention is required.
⭐ 2. Brand Analysis Page – See How Each Brand Performs
This page helps you compare different brands inside your portfolio.
It includes:
-
✔ Filtering options
-
✔ Three powerful charts:
-
Spend (USD) by Brand Name
-
Revenue (USD) by Brand Name
-
Brand Preference Score by Brand Name
-
You can clearly identify your top-performing brands and spot those that need improvement.
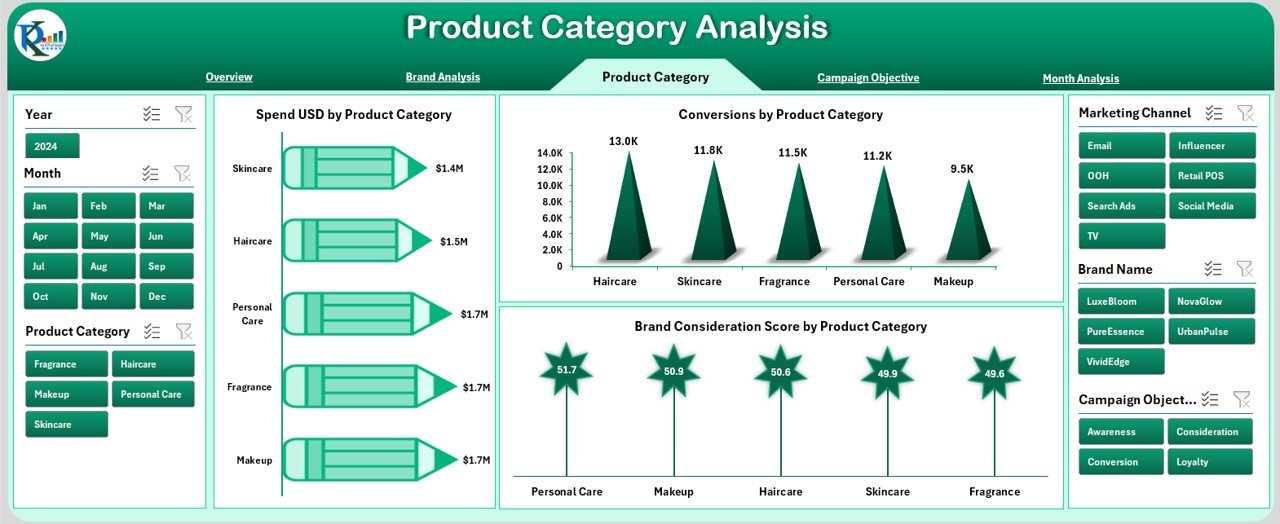
⭐ 3. Product Category Analysis Page – Discover Winning Categories
Every product category behaves differently.
This page tracks:
-
✔ Spend by Product Category
-
✔ Conversion Rate by Product Category
-
✔ Brand Consideration Score by Product Category
It helps you see which categories give high revenue, high conversions, or better market perception.
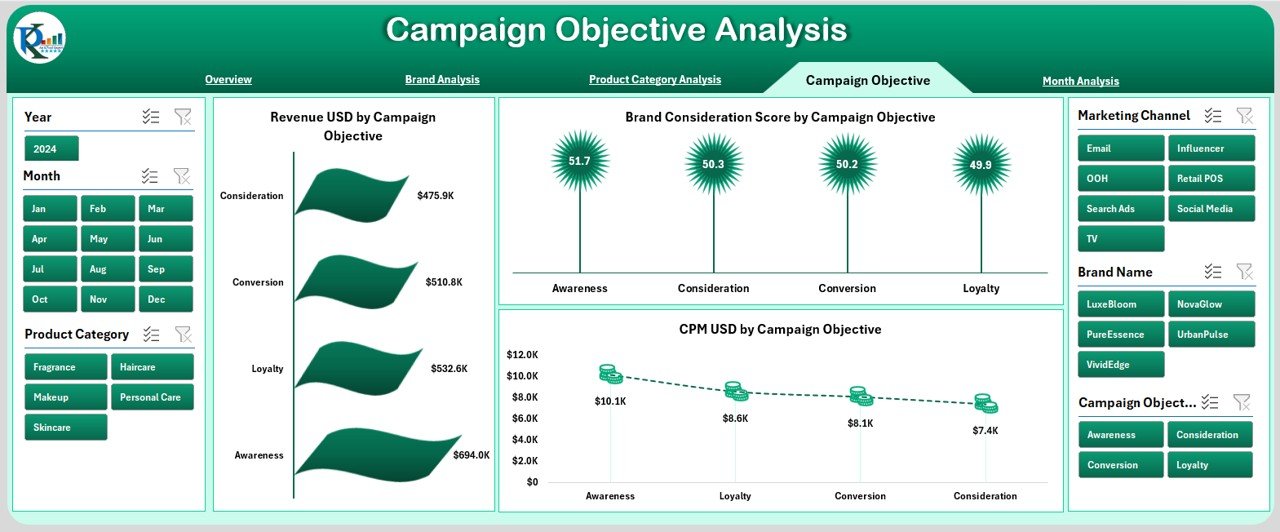
⭐ 4. Campaign Objective Analysis Page – Measure Campaign Effectiveness
Campaigns such as awareness, conversion, or engagement behave differently.
This page shows:
-
✔ Revenue by Campaign Objective
-
✔ Brand Consideration Score
-
✔ CPM
These visuals help you understand which campaign objectives deliver value and which ones waste budget.
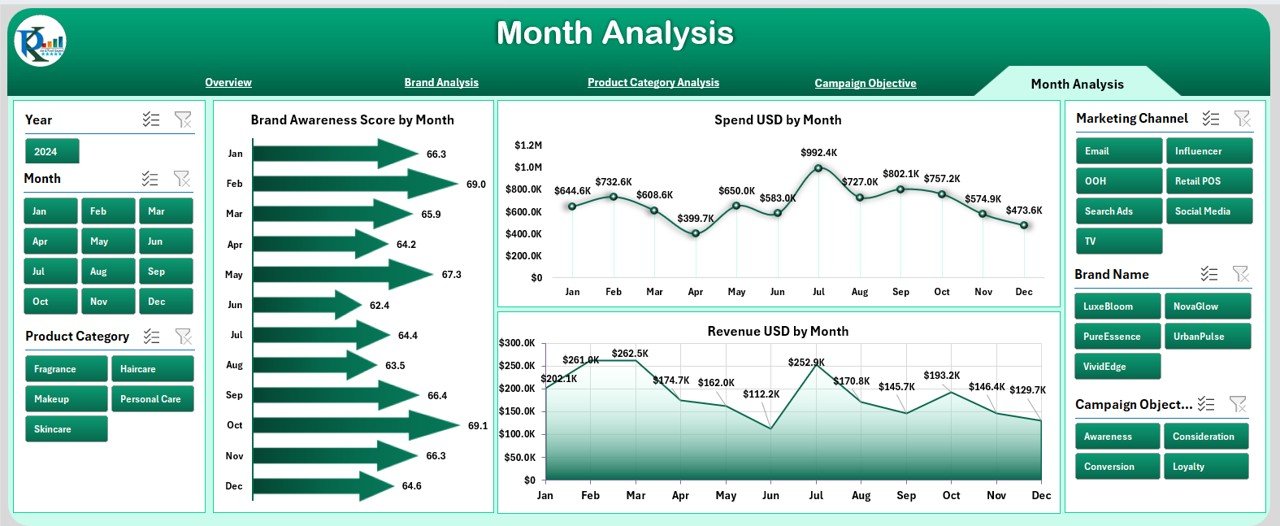
⭐ 5. Month Analysis Page – Track Trends and Seasonal Behavior
Month-wise performance is critical in brand planning.
This page includes:
-
✔ Brand Awareness Score by Month
-
✔ Spend by Month
-
✔ Revenue by Month
You can easily compare performance across months to identify growth and seasonal demand.
📦 What’s Inside the Brand Management Dashboard in Excel
When you download this dashboard, you get:
-
A professionally designed Excel dashboard
-
Five analytical pages
-
Fully functional KPI cards
-
Interactive charts and slicers
-
A structured Data Sheet for raw inputs
-
A Support Sheet for dropdown values
-
Automatically updating calculations
-
A clean navigational layout
No coding is needed—simply enter your data and refresh the pivot tables.
🧩 How to Use the Brand Management Dashboard in Excel
Using this dashboard is extremely simple:
-
📥 Enter your data in the Data Sheet
-
🔄 Refresh the dashboard
-
🎚 Use slicers to filter brand, month, region, or campaign objective
-
📊 Compare KPIs and identify performance gaps
-
🚀 Optimize campaigns, spending, and product strategies
-
📈 Use monthly trends for forecasting and planning
Everything works smoothly within Excel, even for beginners.
👤 Who Can Benefit from This Brand Management Dashboard
This dashboard is ideal for:
-
🧑💼 Brand Managers
-
📈 Marketing Teams
-
📦 Product Managers
-
🧠 Strategy Leaders
-
👨💻 Analysts
-
💼 Senior Management
-
📊 Advertising & Media Teams
Anyone responsible for brand planning, performance review, or marketing execution will benefit from this tool.
### Click hare to read the Detailed blog post
Visit our YouTube channel to learn step-by-step video tutorials
👉 Youtube.com/@PKAnExcelExpert


Reviews
There are no reviews yet.