
Chemical manufacturing operations generate massive amounts of data every single day—production cycles, batch results, safety checks, energy usage, equipment downtime, compliance reports, and more. But when this information stays inside spreadsheets or unstructured reports, decision-makers struggle to understand what’s happening on the shop floor. That’s exactly why the Chemical Manufacturing KPI Dashboard in Power BI is the ultimate solution. It transforms raw Excel data into powerful, interactive visuals that give you real-time insight into your entire manufacturing process.
Perfect for leaders, supervisors, analysts, and plant managers—this dashboard helps you track the KPIs that matter the most so you can improve efficiency, reduce costs, enhance safety, and maintain compliance with ease. Whether you run batch-based operations, continuous processing, or multi-stage production lines, this dashboard gives you clarity and control at every level.
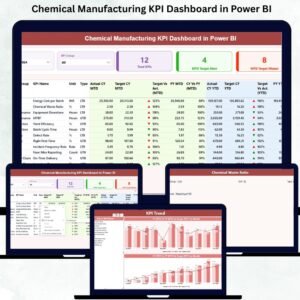
This digital product is designed to give you fast, accurate, and actionable insights without spending hours in Excel. With just a click, you can monitor Month-to-Date (MTD), Year-to-Date (YTD), Previous Year trends, and Target achievements for every KPI in one place.
✨ Key Features of the Chemical Manufacturing KPI Dashboard in Power BI
This dashboard comes with powerful, analytics-ready features designed to help you take complete control of your plant performance.
✔️ Real-Time KPI Visibility
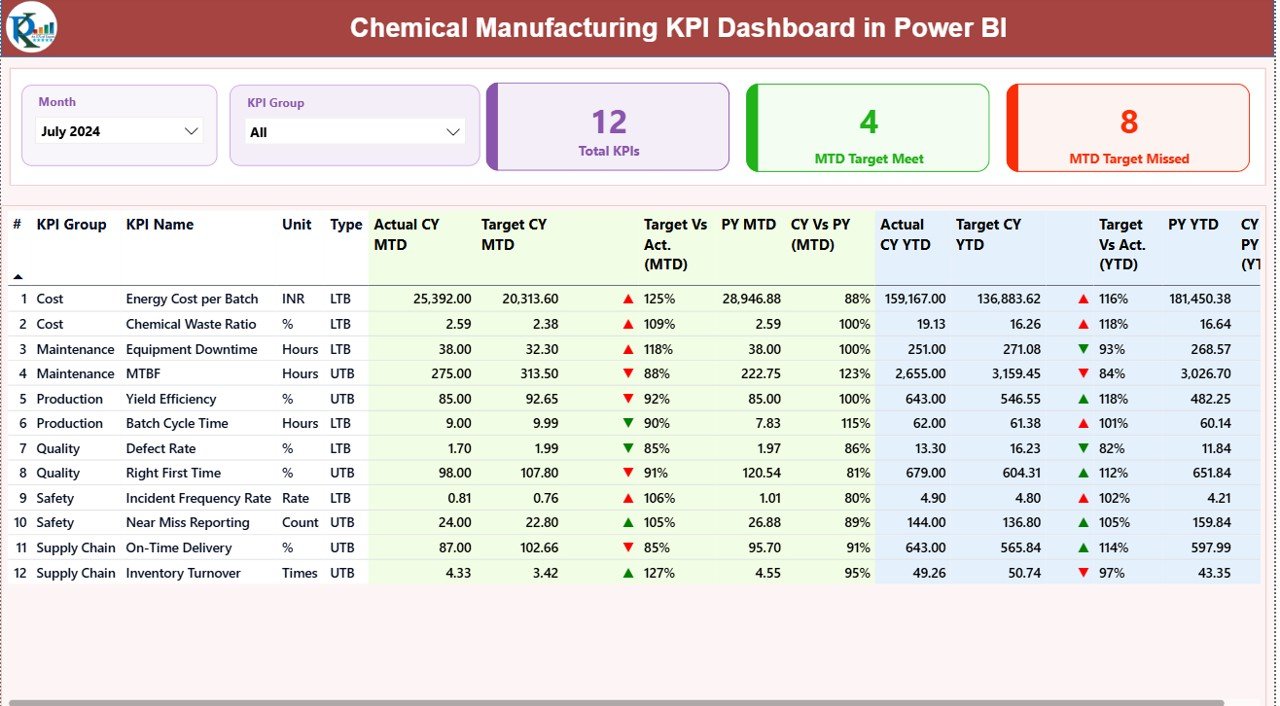
Track production, quality, safety, and cost indicators instantly through dynamic visuals and clean KPI cards.
✔️ Advanced MTD & YTD Analysis
Compare Actual vs Target and Current Year vs Previous Year for performance monitoring.
✔️ Interactive Slicers
Choose any month or KPI category to filter the entire dashboard instantly.
✔️ Smart Icons & Color Coding
Green ▲ for target achieved and Red ▼ for missed KPIs—making analysis fast and simple.
✔️ 3 Powerful Dashboard Pages
-
Summary Page (All KPIs at a glance)
-
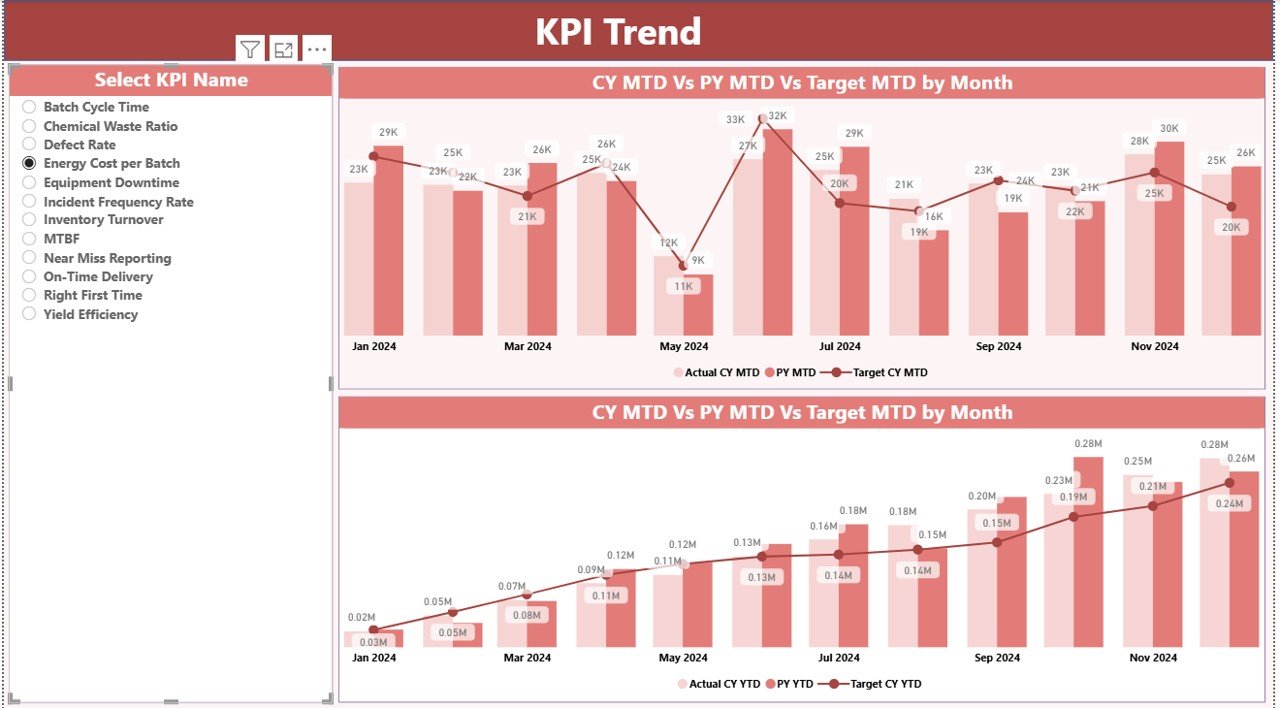
KPI Trend Page (MTD & YTD trends)
-
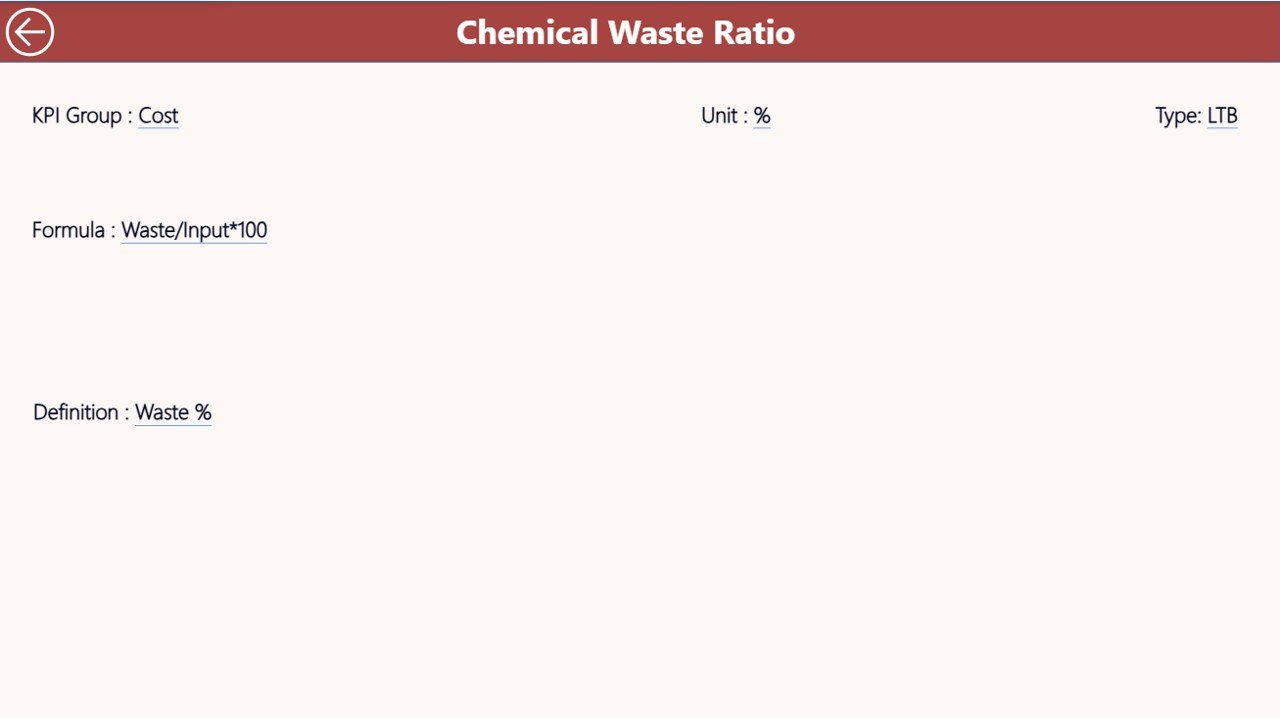
KPI Definition Page (formula, type, and meaning)
✔️ Excel-Based Source Data
Easily update all KPIs through three input sheets: Actual, Target, and Definitions.
📦 What’s Inside the Chemical Manufacturing KPI Dashboard
This digital download includes everything you need for smooth KPI tracking and reporting.
🔹 Power BI Dashboard File (.pbix)
Fully designed, clean, interactive, and ready to use.
🔹 Excel Input File (.xlsx)
With the following sheets:
-
Input_Actual – Fill monthly actuals
-
Input_Target – Fill target values
-
KPI Definition – Add formulas, units & KPI types
🔹 KPI Categories Covered
-
Production KPIs
-
Quality KPIs
-
Safety KPIs
-
Cost & Efficiency KPIs
-
Environmental KPIs
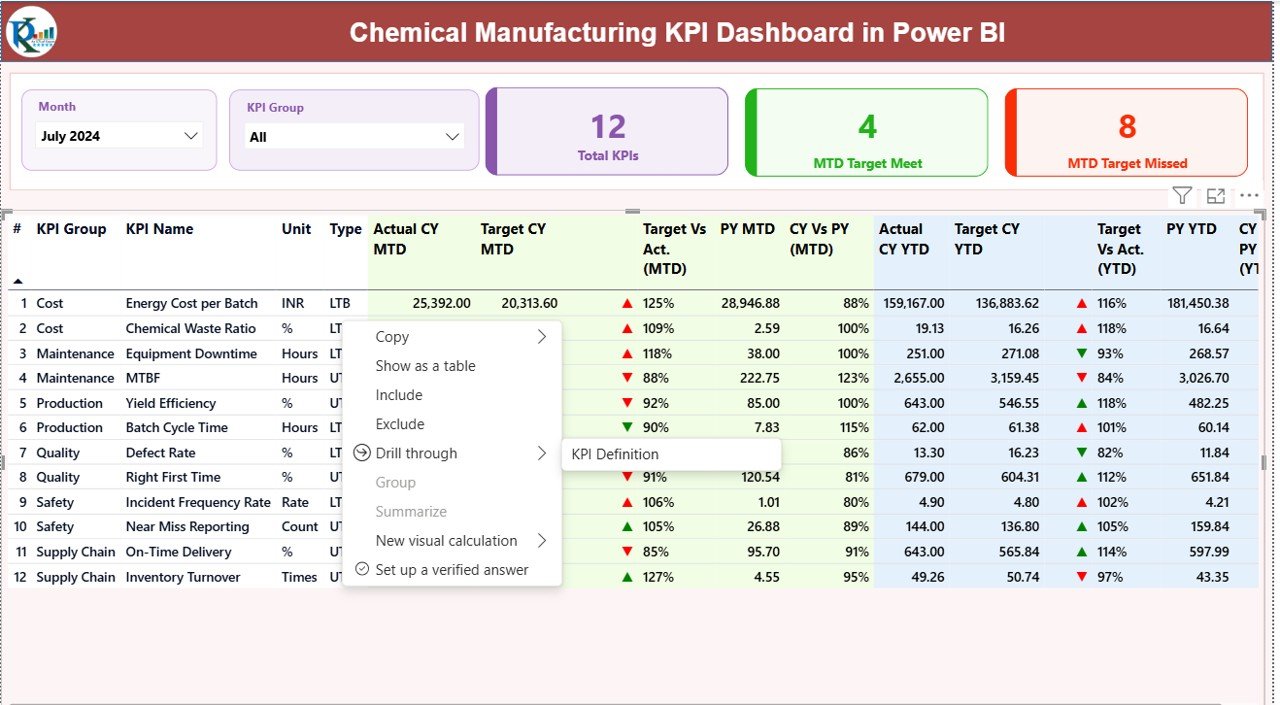
🔹 Drill-Through Page for KPI Definition
Understand each KPI deeply—formula, logic, and meaning.
🔹 Dataset + Instruction Notes
To ensure easy updates and zero confusion.
🛠 How to Use the Chemical Manufacturing KPI Dashboard
Using this dashboard is extremely simple—even if you are not a Power BI expert.
🚀 Step 1: Update the Excel File
Enter Actual, Target, and KPI details in the input sheets.
🚀 Step 2: Refresh Power BI
Click Refresh—the dashboard updates instantly.
🚀 Step 3: Select Month & KPI Group
Use slicers to filter data for fast analysis.
🚀 Step 4: Review MTD & YTD Performance
Check green/red icons and percentage comparisons.
🚀 Step 5: Analyze KPI Trends
Use the Trend Page to compare CY vs PY and Actual vs Target.
🚀 Step 6: Drill-Through for KPI Details
Understand KPI formulas, logic, and classification.
This workflow allows anyone to generate management-ready reports in minutes.
👥 Who Can Benefit from This Chemical Manufacturing KPI Dashboard
This dashboard is designed for every role in chemical plant operations:
👨🏭 Production Managers
Track cycle times, yield, capacity utilization, and bottlenecks.
🧪 Quality Teams
Monitor OOS incidents, defect rates, RFT%, and complaints.
🦺 Safety Officers
Get clear insights into incident trends and safety compliance.
💰 Cost & Operations Teams
Analyze wastage, downtime, consumption, and energy cost.
📊 Business Analysts & MIS Teams
Create fast, automated monthly reports without manual work.
🏭 Plant Heads & Leadership Teams
Get accurate insights for strategic decisions.
Whether you manage a single plant or multiple facilities, this dashboard brings transparency, speed, and efficiency to your reporting process.
### Click here to read the Detailed blog post
Watch the step-by-step video tutorial:


Reviews
There are no reviews yet.