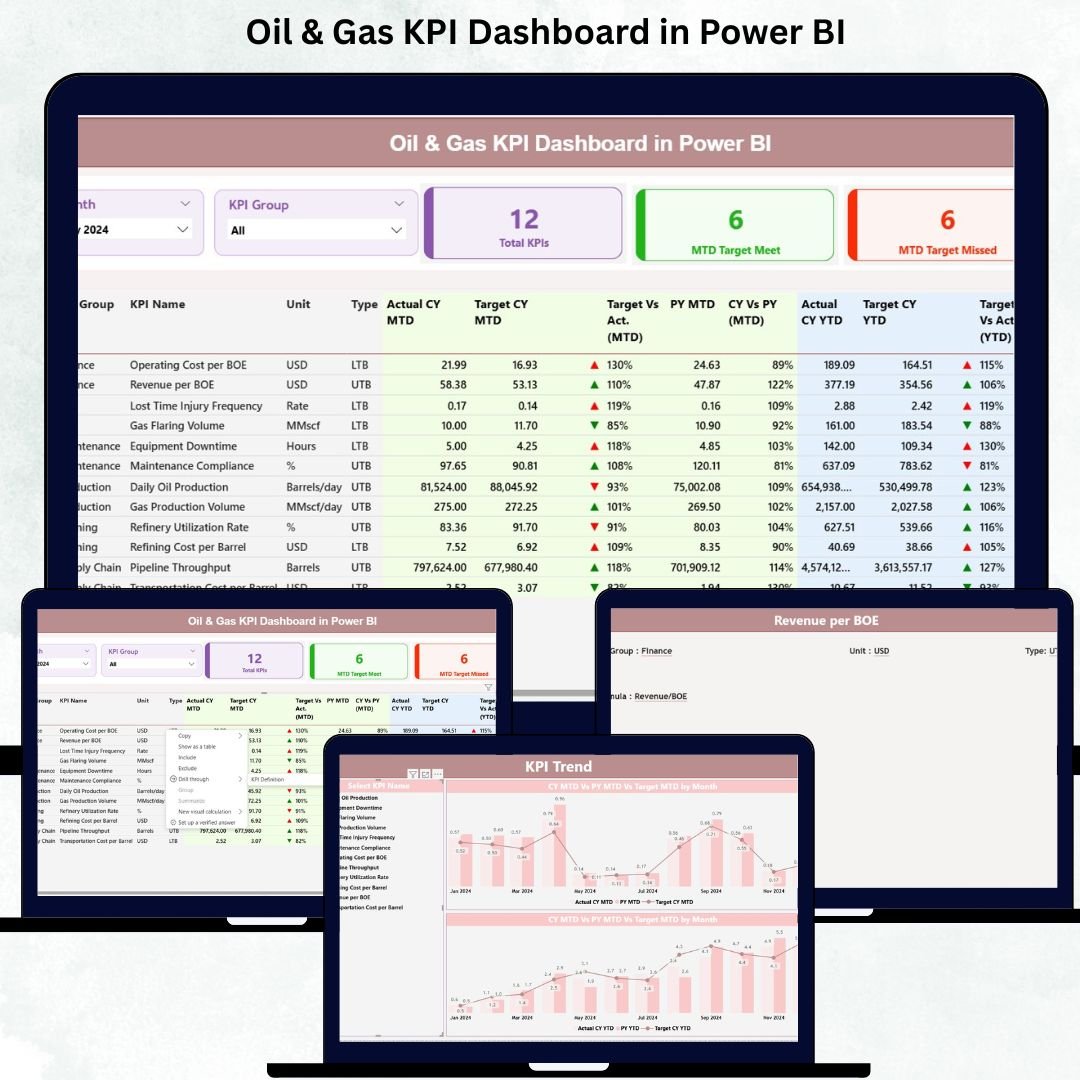
Managing oil and gas operations requires fast decisions, accurate insights, and complete visibility across production, drilling, costs, safety, and compliance. Traditional spreadsheets slow down the process, creating delays and errors. That’s why we created the Oil & Gas KPI Dashboard in Power BI — a ready-to-use analytical solution designed to give you real-time clarity, visual insights, and performance tracking in a single dashboard.
This powerful dashboard transforms your Excel data into interactive Power BI visuals, helping teams monitor production, safety, operational metrics, and financial KPIs effortlessly. Whether you’re tracking MTD progress, YTD results, or comparing your current performance with previous years, this dashboard delivers everything you need in one clean and intuitive interface.
With actionable insights, color-coded indicators, and drill-through pages, your entire team can make faster, smarter decisions — without any technical expertise.
✨ Key Features of the Oil & Gas KPI Dashboard in Power BI
📊 Real-Time KPI Tracking
Monitor production, drilling efficiency, equipment performance, safety indicators, and financial KPIs with instant clarity.
🟢🔴 Smart Red–Green Performance Icons
Visual indicators (▲ / ▼) quickly show whether KPIs are meeting targets or falling behind.
📅 Month & KPI Group Filters
Use slicers to switch between months and KPI categories like Production, Safety, Maintenance, Operations, or Finance.
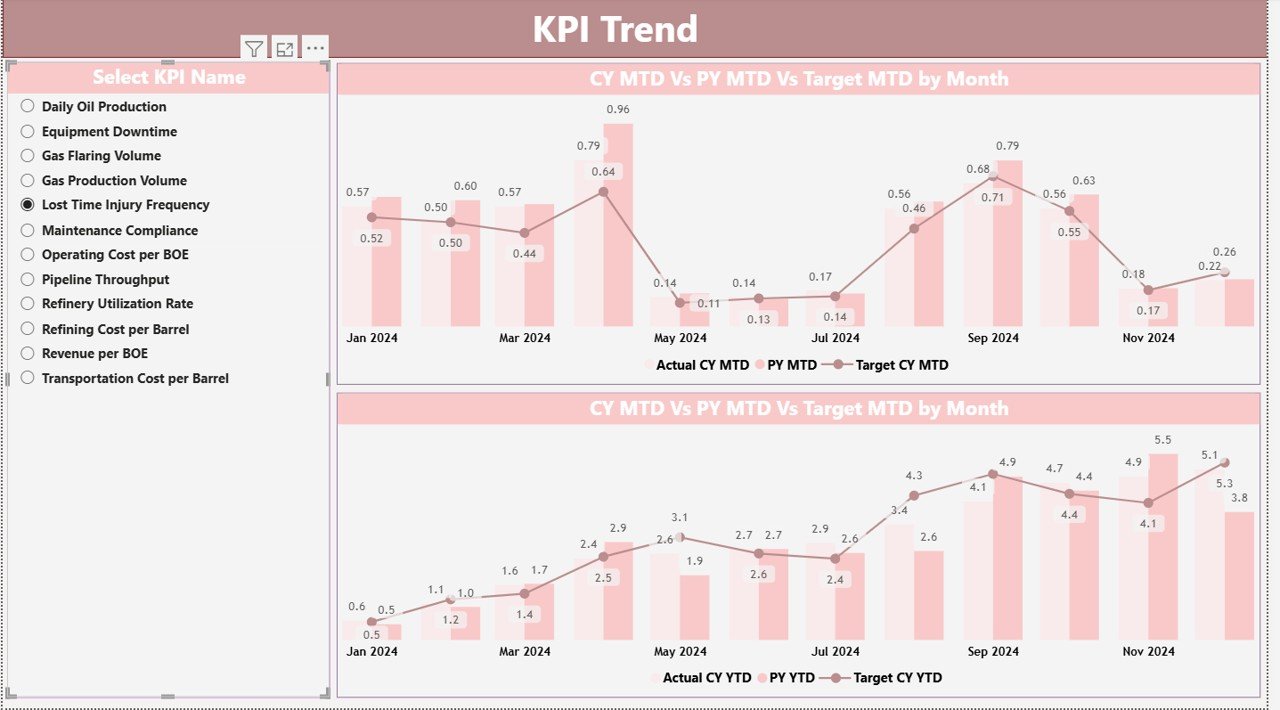
📈 Powerful Trend Analytics
The Trend Page gives a clear comparison of actual vs target vs previous year data for any KPI you select.
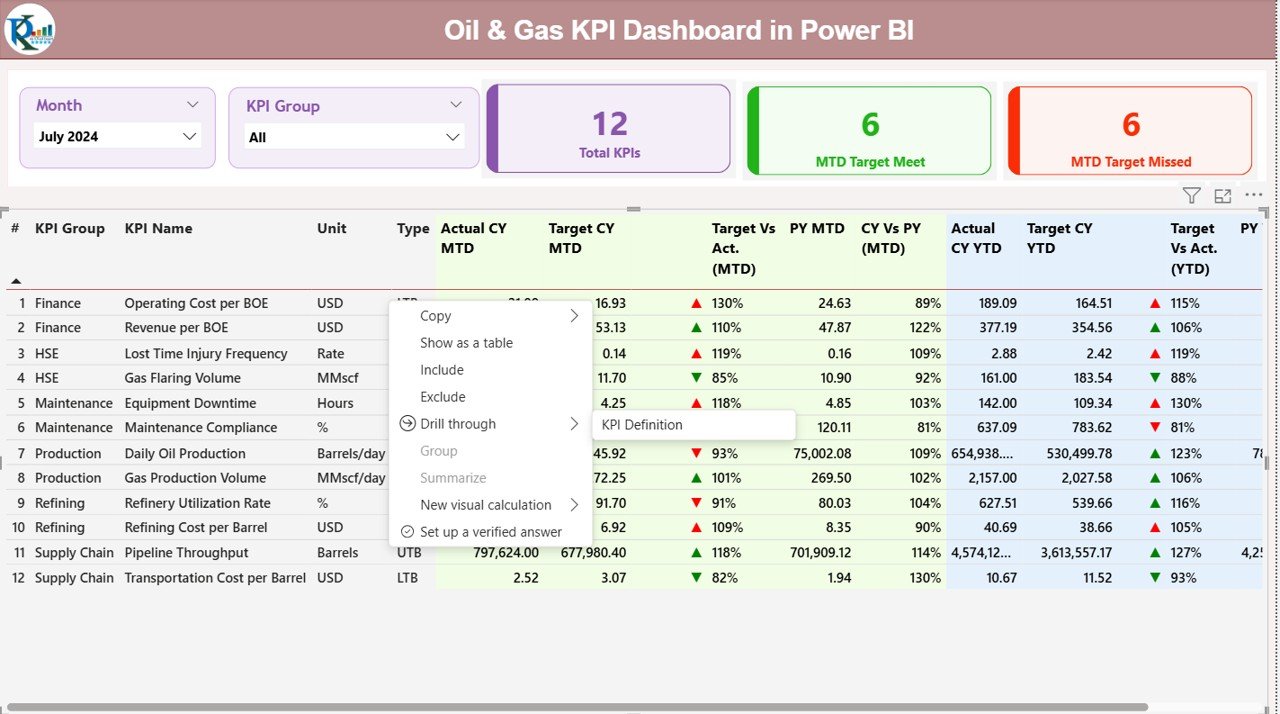
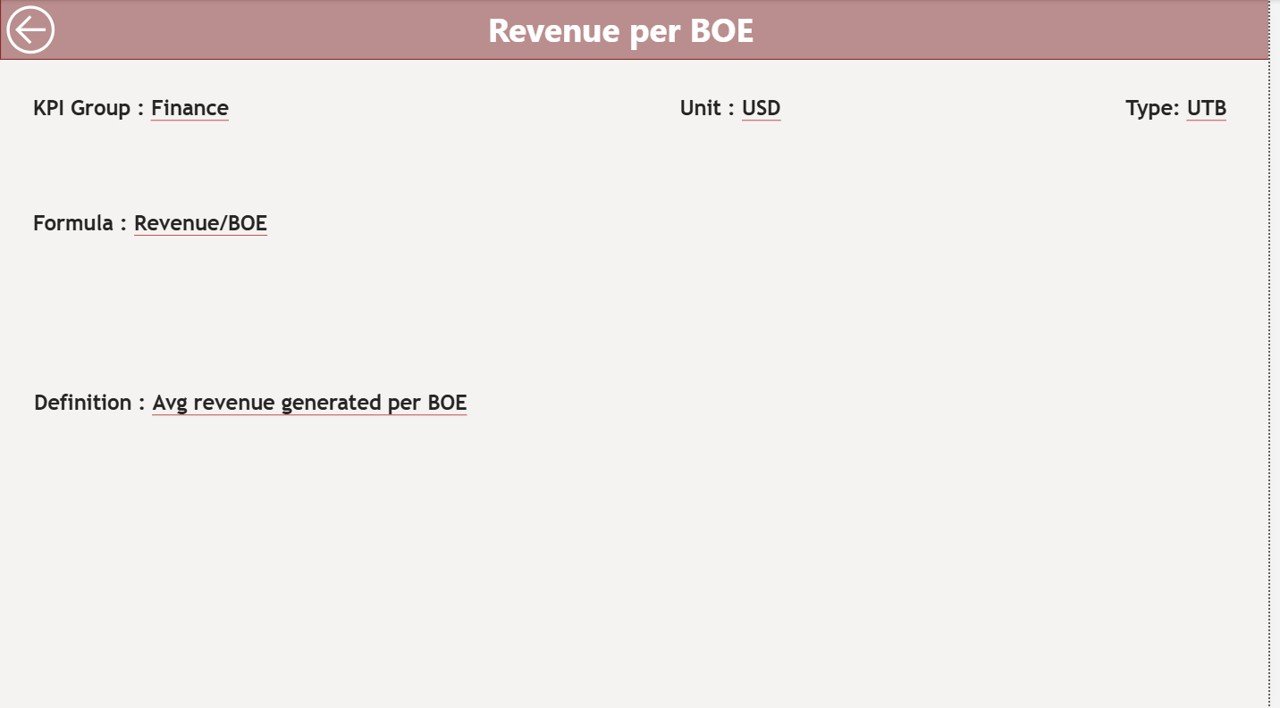
📘 Detailed KPI Definition Page
Explore every KPI’s formula, definition, and type (LTB/UTB) using the built-in drill-through functionality.
📦 What’s Inside the Oil & Gas KPI Dashboard
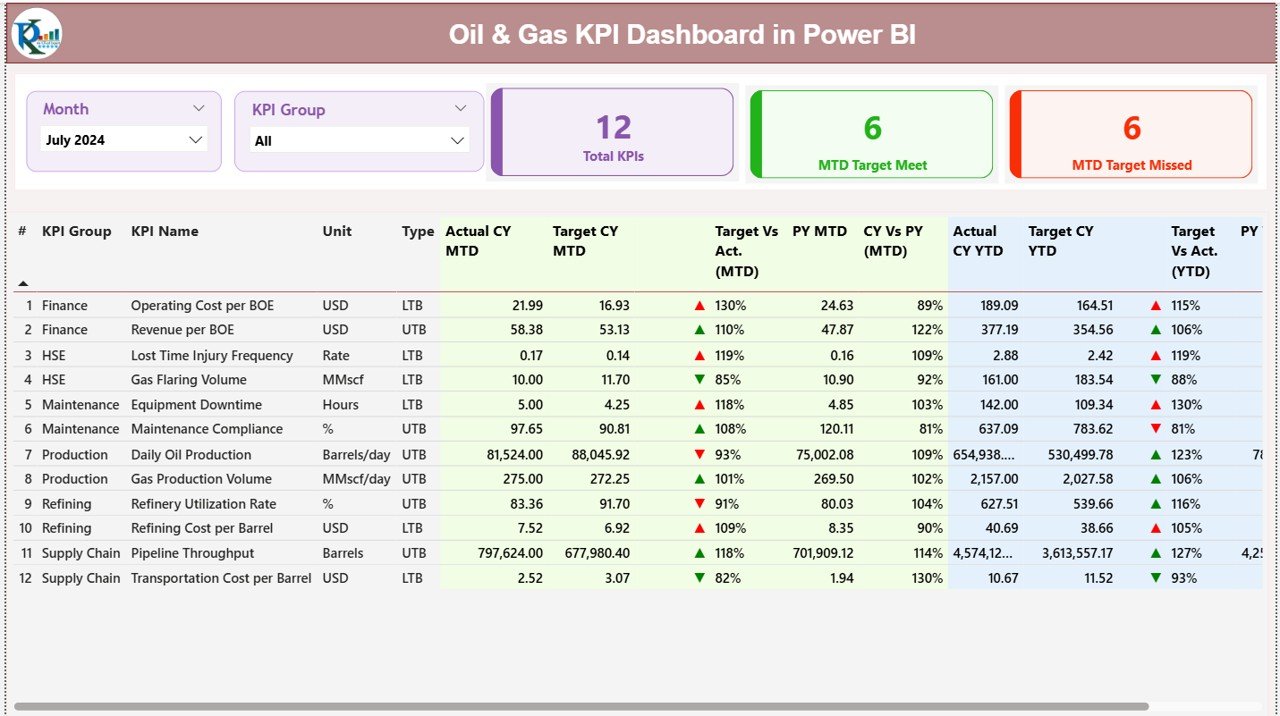
✔ Summary Page
A central page that shows key KPI cards, smart indicators, and a detailed KPI table including:
-
KPI Number
-
KPI Name
-
KPI Group
-
Unit
-
Actual MTD & YTD
-
Target MTD & YTD
-
Previous Year Comparisons
-
Target % Achievement
-
Trend Icons
✔ KPI Trend Page
Interactive combo charts showing:
-
CY Actual
-
PY Actual
-
Target Values
Perfect for trend analysis, seasonal performance, and long-term planning.
✔ KPI Definition Page
A fully detailed breakdown including:
-
Formula
-
KPI Meaning
-
Calculation Method
-
KPI Type
✔ Excel Data Source
The dashboard reads data from three structured sheets:
-
Input_Actual
-
Input_Target
-
KPI_Definition
Update these sheets, refresh Power BI, and your dashboard updates automatically.
🛠️ How to Use the Oil & Gas KPI Dashboard in Power BI
🔧 Step 1: Update Your Excel Sheets
Enter your monthly MTD + YTD values, target numbers, and KPI definitions.
📤 Step 2: Load Excel into Power BI
The dashboard automatically reads and transforms your data.
📍 Step 3: Apply Filters & View Insights
Use slicers to explore performance by month or KPI category.
📈 Step 4: Track Trends
Select any KPI to view performance trend lines, target comparisons, and year-over-year progress.
📘 Step 5: Review Definitions
Use drill-through to understand KPI calculations, ensuring accurate interpretation.
👥 Who Can Benefit from This Dashboard
🛢 Production Teams
Track well performance, downtime, output, and operational efficiency.
🔧 Maintenance Teams
Monitor equipment failure trends, maintenance delays, and readiness levels.
🦺 Safety & Compliance Teams
Review incident rates, training hours, and safety benchmarks.
💰 Finance Departments
Track costs, variances, cost per barrel, and profitability metrics.
👨💼 Senior Management
View consolidated performance metrics to support strategic decision-making.
This dashboard provides clarity and consistency across all departments.
### 📘 Click here to read the detailed blog post
Watch the step-by-step video tutorial:


Reviews
There are no reviews yet.