Modern businesses are expected not only to deliver financial results but also to create a meaningful impact on society. Organizations today focus on sustainability, environmental responsibility, ethical leadership, employee well-being, and community development. But managing CSR activities generates large volumes of data—energy usage, compliance checks, volunteer hours, diversity metrics, community programs, recycling numbers, and more. When these numbers remain scattered across files, understanding true CSR performance becomes difficult.Corporate Social Responsibility (CSR) KPI Dashboard in Power BI
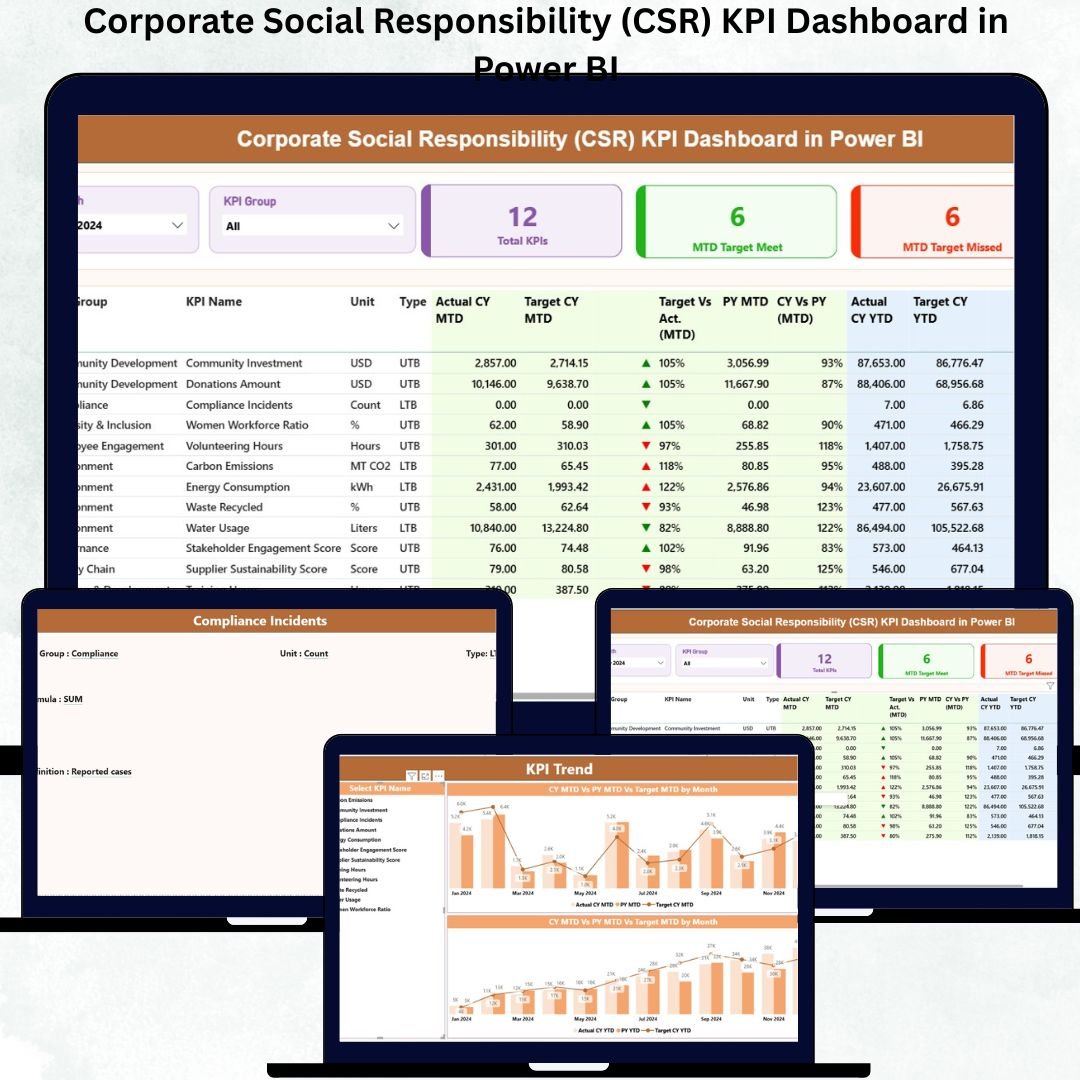
✨ That’s exactly why we created the Corporate Social Responsibility (CSR) KPI Dashboard in Power BI—a complete, ready-to-use reporting solution designed to simplify CSR tracking, strengthen decision-making, and give businesses a clear view of their social impact. This dashboard converts complex CSR data into clean, interactive visuals that help leaders analyze performance with confidence. With just one click, you can compare actual vs. target, review year-over-year results, track sustainability initiatives, and measure progress in real time.Corporate Social Responsibility (CSR) KPI Dashboard in Power BI
Whether your business wants to follow ESG goals, maintain compliance, or showcase CSR performance to stakeholders, this dashboard makes reporting easier, faster, and more reliable.Corporate Social Responsibility (CSR) KPI Dashboard in Power BI.
✨ Key Features of the CSR KPI Dashboard in Power BI
The dashboard comes with a set of powerful features that help CSR teams evaluate performance instantly:Corporate Social Responsibility (CSR) KPI Dashboard in Power BI
🌍 Complete CSR Overview – View all environmental, social, governance, and community KPIs in one place.
📊 Interactive Visuals & Cards – Track MTD and YTD targets, actuals, variances, and performance indicators using easy-to-read visuals.Corporate Social Responsibility (CSR) KPI Dashboard in Power BI.Corporate Social Responsibility (CSR) KPI Dashboard in Power BI.
🎛️ Dynamic Slicers – Filter results by Month or KPI Group to focus on specific CSR areas.
📈 Trend Analysis – Understand how every KPI performs month-by-month through detailed combo charts.
🔍 Drill-Through KPI Insights – Click any KPI to view its definition, formula, unit, and performance details.Corporate Social Responsibility (CSR) KPI Dashboard in Power BI
📘 Excel-Based Data Source – Update three simple worksheets (Actuals, Targets, Definitions) and refresh the report instantly.
✔️ Targets vs. Actuals Indicators – Green and red icons help you quickly identify areas meeting goals and areas needing attention.
📦 What’s Inside the CSR KPI Dashboard
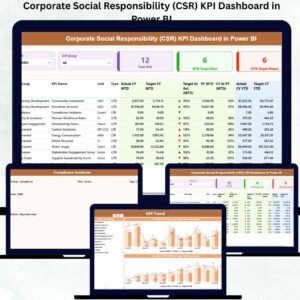
This product includes a fully structured and professional dashboard with three dedicated pages inside Power BI:
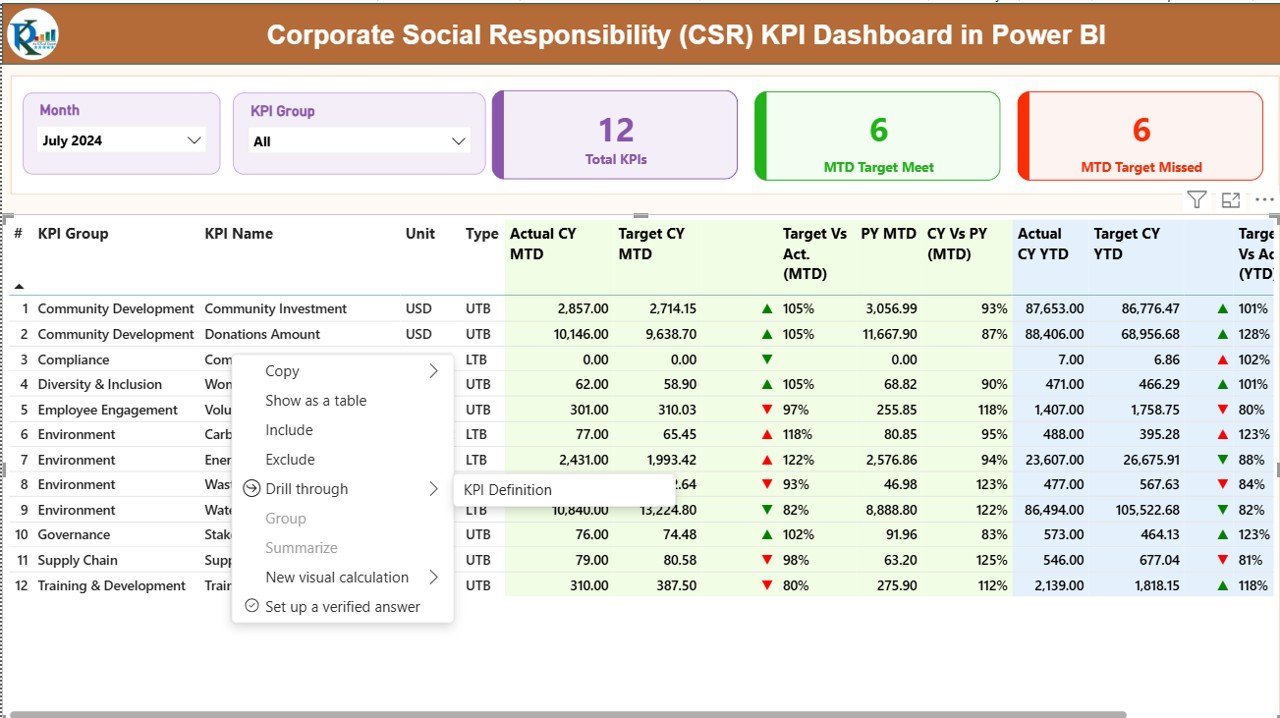
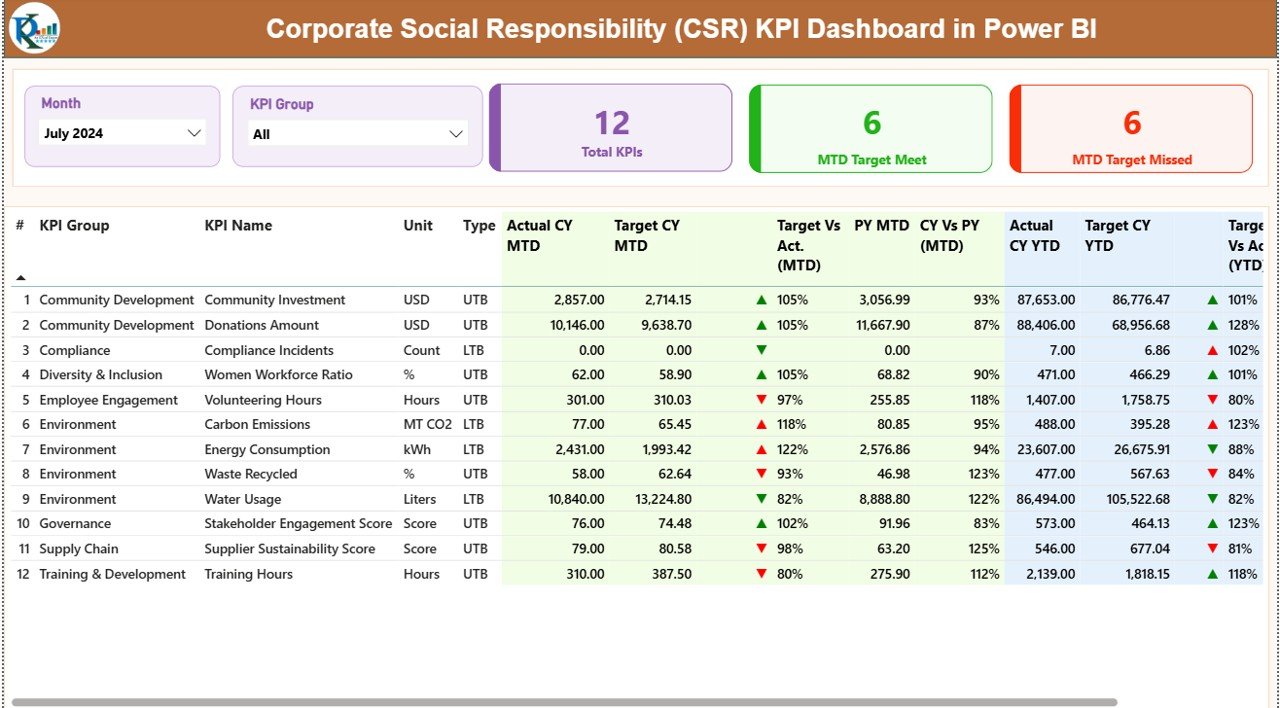
1️⃣ Summary Page
The control center of the dashboard displaying:Corporate Social Responsibility (CSR) KPI Dashboard in Power BI
-
Total KPI Count
-
MTD Target Met Count
-
MTD Target Missed Count
-
A complete KPI table with Actuals, Targets, PY comparisons, Variance %, trend icons, and more.
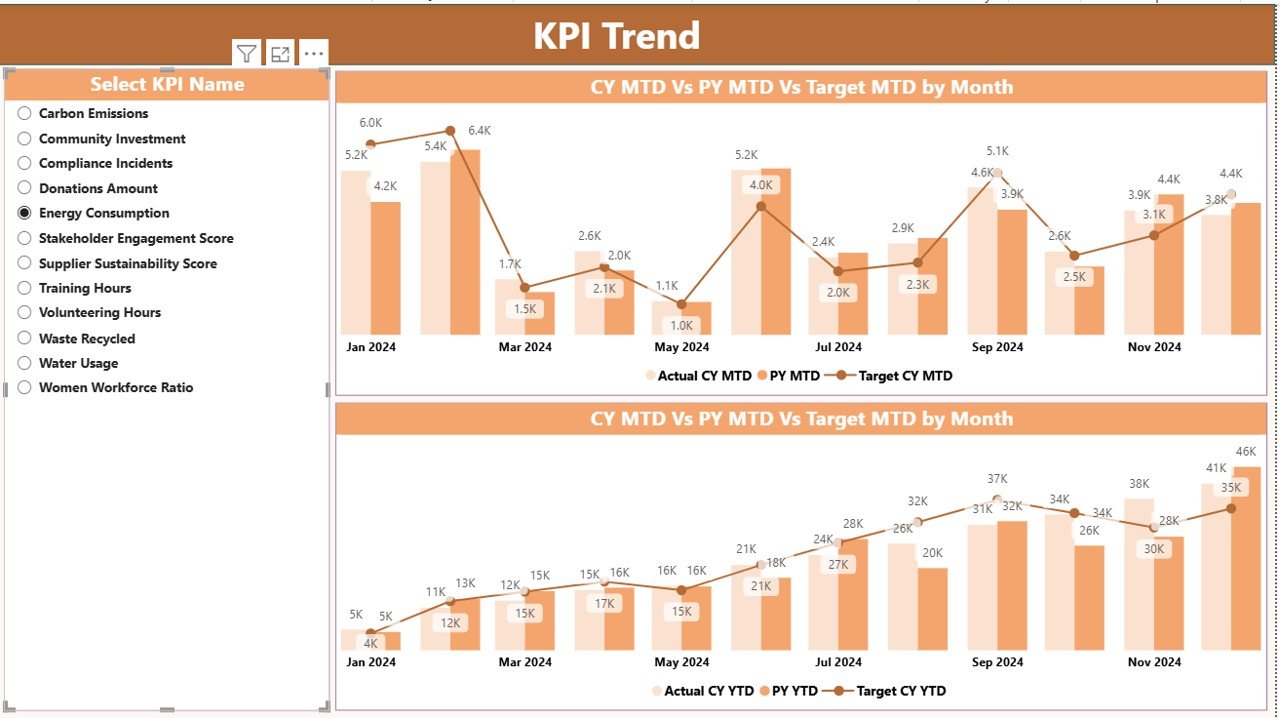
2️⃣ KPI Trend Page
Helps you analyze performance over time using:
-
Combo charts for CY vs. PY
-
MTD & YTD comparisons
-
Target trend lines
-
KPI selection slicer
- Corporate Social Responsibility (CSR) KPI Dashboard in Power BI
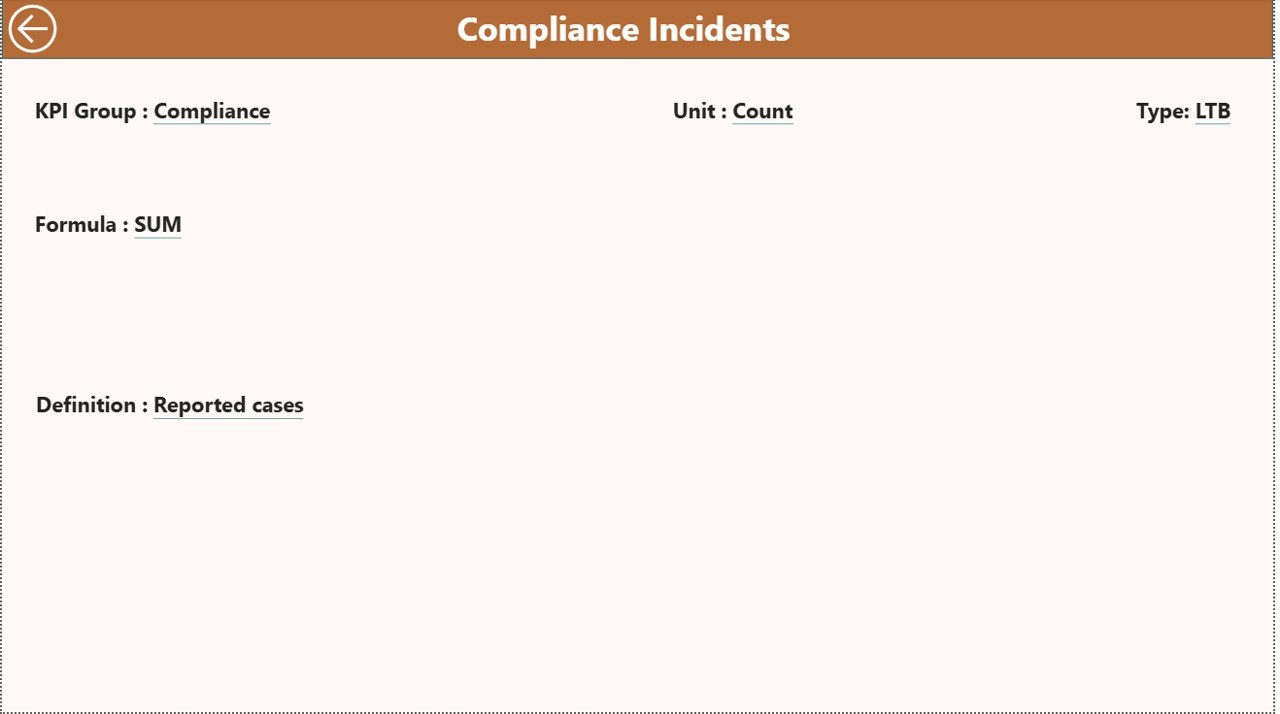
3️⃣ KPI Definition Page
A detailed reference page showing:
-
Formula
-
Definition
-
KPI Number
-
Unit
-
KPI Group
-
Type (UTB / LTB)
- Corporate Social Responsibility (CSR) KPI Dashboard in Power BI
This ensures your entire CSR team uses consistent KPI definitions and calculations.
🛠️ How to Use the CSR KPI Dashboard in Power BI
Using this dashboard is extremely simple—even for non-technical users:
1️⃣ Fill the Input_Actual Worksheet with MTD & YTD values.
2️⃣ Update the Input_Target Worksheet with monthly targets.
3️⃣ Define all KPIs in the KPI Definition sheet.
4️⃣ Open Power BI → Click Refresh → Your dashboard updates instantly.
5️⃣ Use Month and KPI Group slicers to explore insights.
6️⃣ Click any KPI to open the drill-through KPI Definition Page.
No coding. No DAX formulas required. Everything works automatically.
🎯 Who Can Benefit from This CSR Dashboard
This CSR KPI Dashboard is ideal for:
🏢 Corporate CSR Teams – Track sustainability and compliance performance easily.
🌱 ESG Analysts – Measure environmental impact and social responsibility KPIs.
🔍 Auditors & Compliance Managers – Ensure standards are met across departments.
📊 Executives & Leadership Teams – Review performance before publishing CSR reports.
💼 Consulting Firms – Deliver ready-to-use CSR reporting to clients.Corporate Social Responsibility (CSR) KPI Dashboard in Power BI
🏭 Small, Medium & Large Businesses – Suitable for all industries and sizes.
A Corporate Social Responsibility (CSR) KPI Dashboard in Power BI


Reviews
There are no reviews yet.