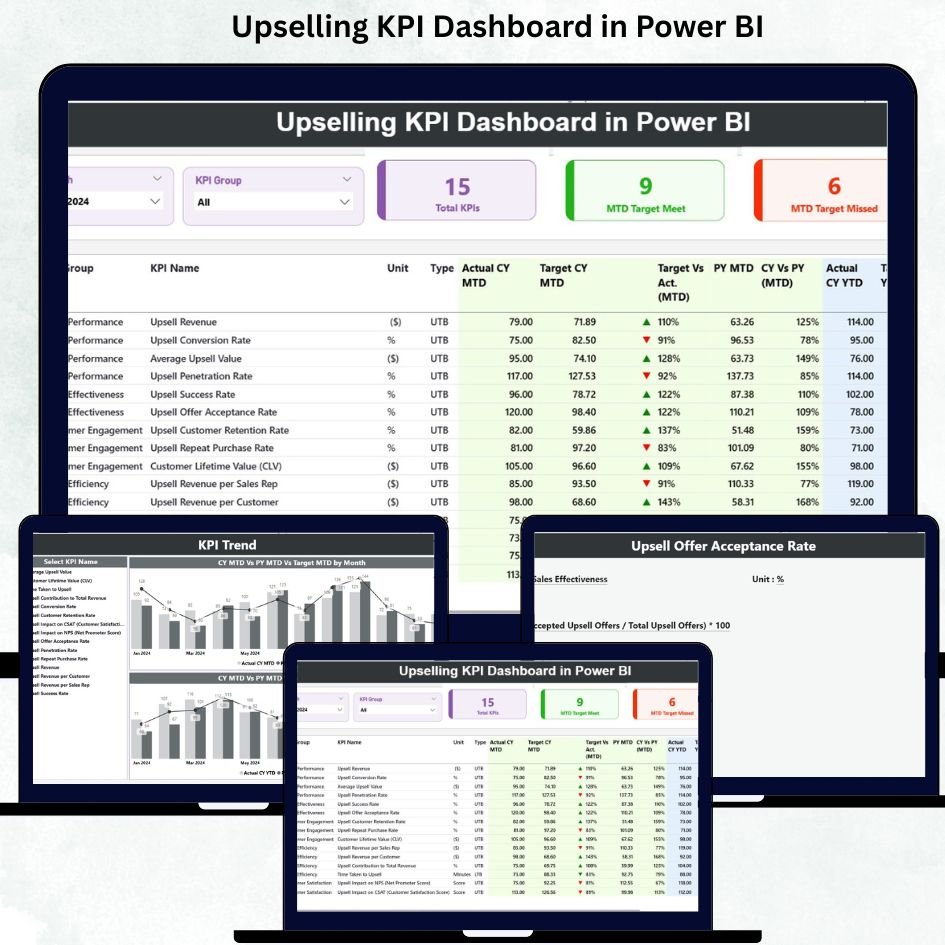
Running a sales team without real-time insights can feel like driving a car with no dashboard 🚗. You move forward, but you never know how fast you are going, when to stop, or which direction to turn. That’s why Upselling KPI Dashboard in Power BI is a game-changer for businesses looking to boost upsell revenue efficiently and effectively.
This ready-to-use Power BI dashboard connects with Excel data and provides a visual, interactive way to monitor every critical upselling KPI in real time. No more scattered spreadsheets, lost opportunities, or hidden trends. With this dashboard, decision-makers, sales managers, and business owners can track monthly and yearly performance, compare against targets, analyze trends, and take action immediately.
Key Features of Upselling KPI Dashboard in Power BI
-
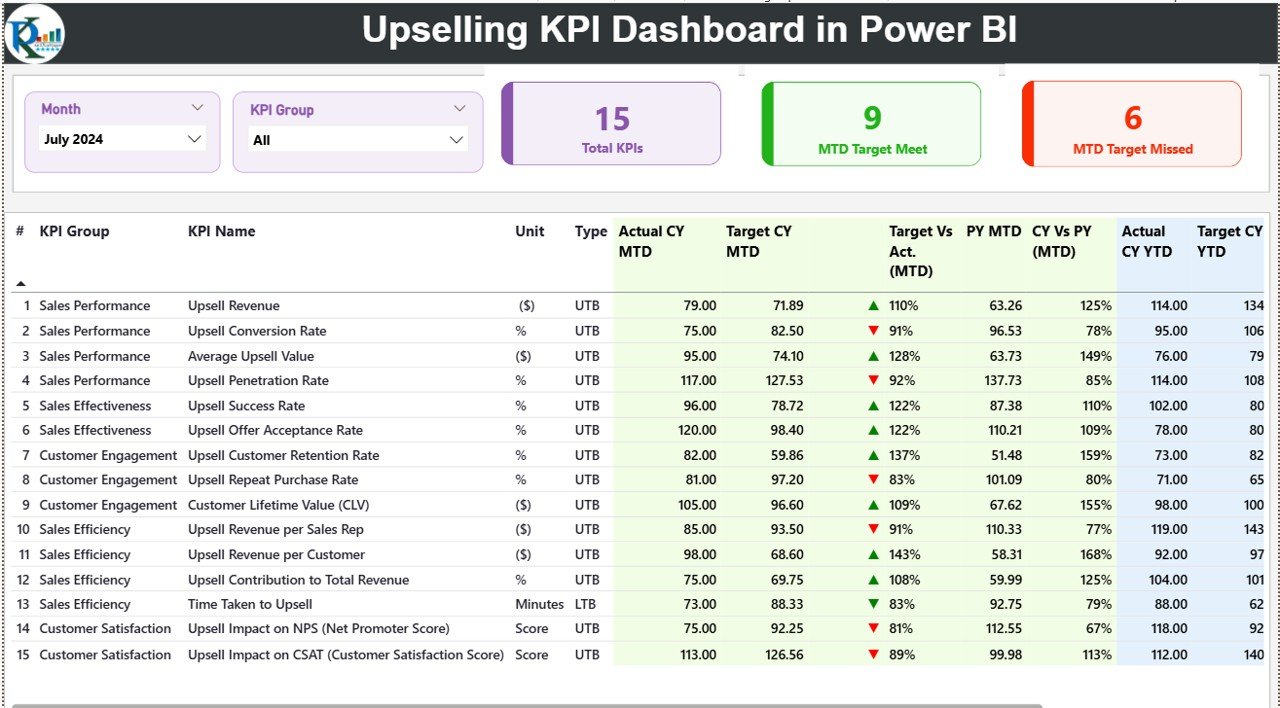
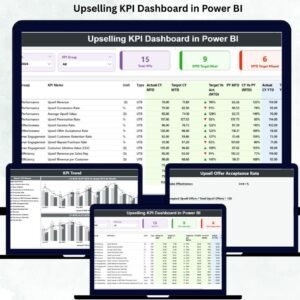
Interactive Summary Page 📊 – Get a complete snapshot of MTD and YTD upsell performance with KPI cards, detailed tables, and slicers to filter by month or KPI group.
-
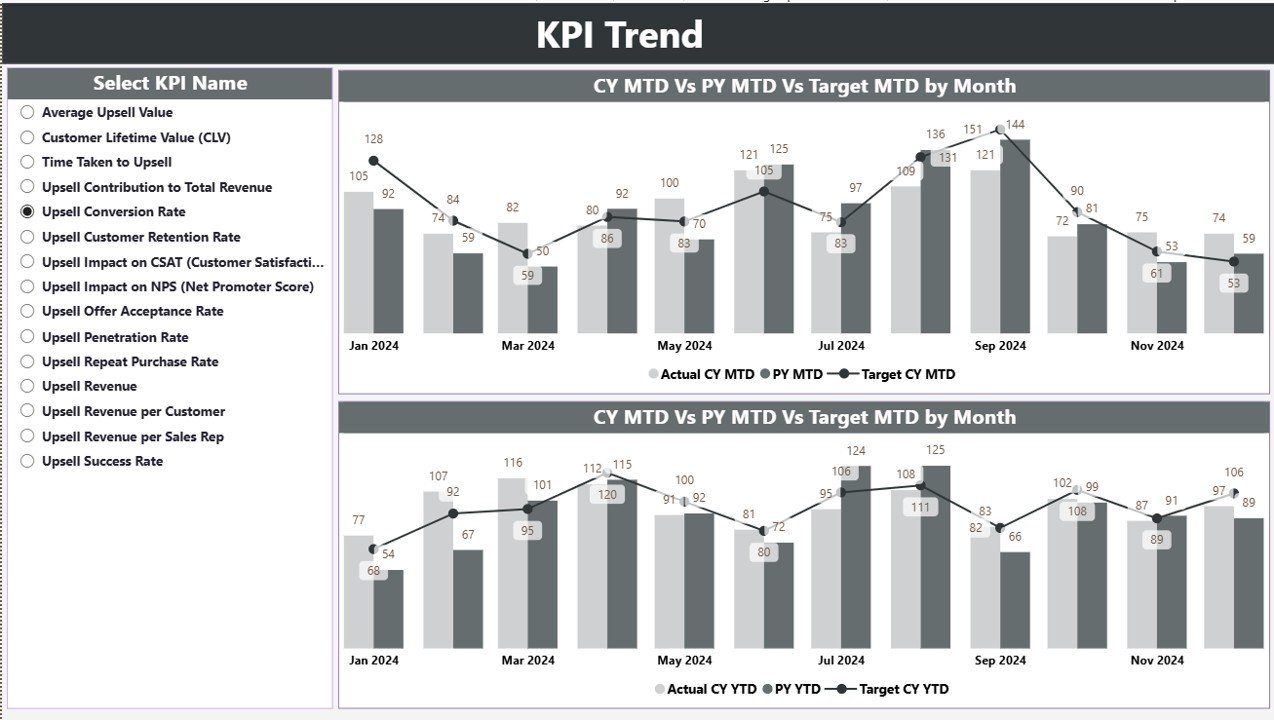
Trend Analysis Page 📈 – Visualize actual vs target vs previous year numbers with combo charts and identify patterns that help you improve upselling strategies.
-
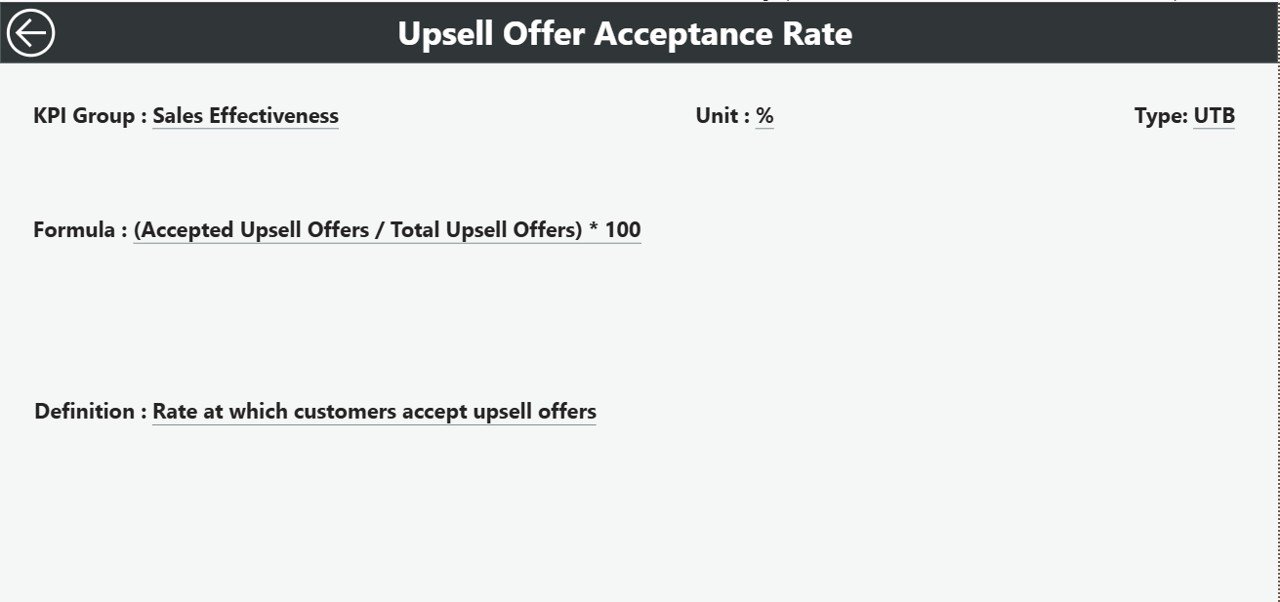
KPI Definition Drill-Through 🔍 – Access detailed KPI formulas, definitions, and categories for complete clarity without searching through documents.
-
Excel-Based Input 💻 – Easily update Actual, Target, and KPI Definition sheets to refresh the dashboard instantly.
-
Real-Time Reporting ⚡ – Automatic updates when you refresh your Excel data, reducing manual reporting effort.
-
Accurate Comparisons ✅ – Compare current performance with targets and last year’s performance effortlessly.
-
Easy Drill-Downs 🕵️♂️ – Identify underperforming KPIs and address gaps quickly.
-
Enhanced Decision-Making 💡 – Make informed, strategic decisions for pricing, coaching, and resource allocation.
What’s Inside the Upselling KPI Dashboard
-
Summary Page – Your main hub showing MTD/YTD numbers, KPI cards, and detailed tables.
-
KPI Trend Page – Combo charts highlighting upsell trends with interactive slicers.
-
KPI Definition Page – Hidden drill-through page with KPI formulas, units, types, and definitions.
-
Excel Sheets – Input_Actual, Input_Target, and KPI Definition sheets to manage data efficiently.
How to Use the Upselling KPI Dashboard
-
Update Your Data Monthly 📅 – Enter Actual and Target numbers in Excel sheets.
-
Refresh the Dashboard 🔄 – Instantly see updated performance metrics.
-
Analyze Trends 📊 – Use slicers to focus on specific KPIs, months, or categories.
-
Drill Through Details 🕵️ – Click any KPI to understand its formula and definition.
-
Act Fast ⚡ – Identify low-performing areas and strategize improvements quickly.
Who Can Benefit from This Upselling KPI Dashboard
-
Sales Leaders & Managers – Monitor team performance, set realistic targets, and improve revenue.
-
Business Owners – Gain complete visibility into upsell strategies and outcomes.
-
Analysts & Operations Teams – Easily track, report, and analyze upselling KPIs without manual effort.
-
Teams Using Excel & Power BI – Seamless integration with familiar tools for quick adoption.
Click here to read the Detailed blog post
Visit our YouTube channel to learn step-by-step video tutorials


Reviews
There are no reviews yet.