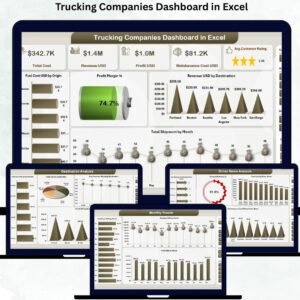
Trucking Companies Dashboard in Excel In the fast-paced logistics industry, trucking companies must manage multiple moving parts—routes, drivers, fuel expenses, shipments, maintenance, customers, and profits. Even one delay or miscalculation can disrupt delivery timelines and increase costs. That’s why the Trucking Companies Dashboard in Excel becomes an essential tool for fleet managers, dispatchers, logistics teams, and trucking business owners.
This ready-to-use dashboard brings all your trucking KPIs into one clean, interactive, and easy-to-understand Excel file. Trucking Companies Dashboard in Excel with powerful charts, slicers, pivot tables, and navigation buttons, it helps you track performance, reduce fuel waste, improve route planning, monitor drivers, optimize shipments, and increase profitability.
Let’s explore how this dashboard transforms logistics operations.
🌟 Key Features of the Trucking Companies Dashboard in Excel
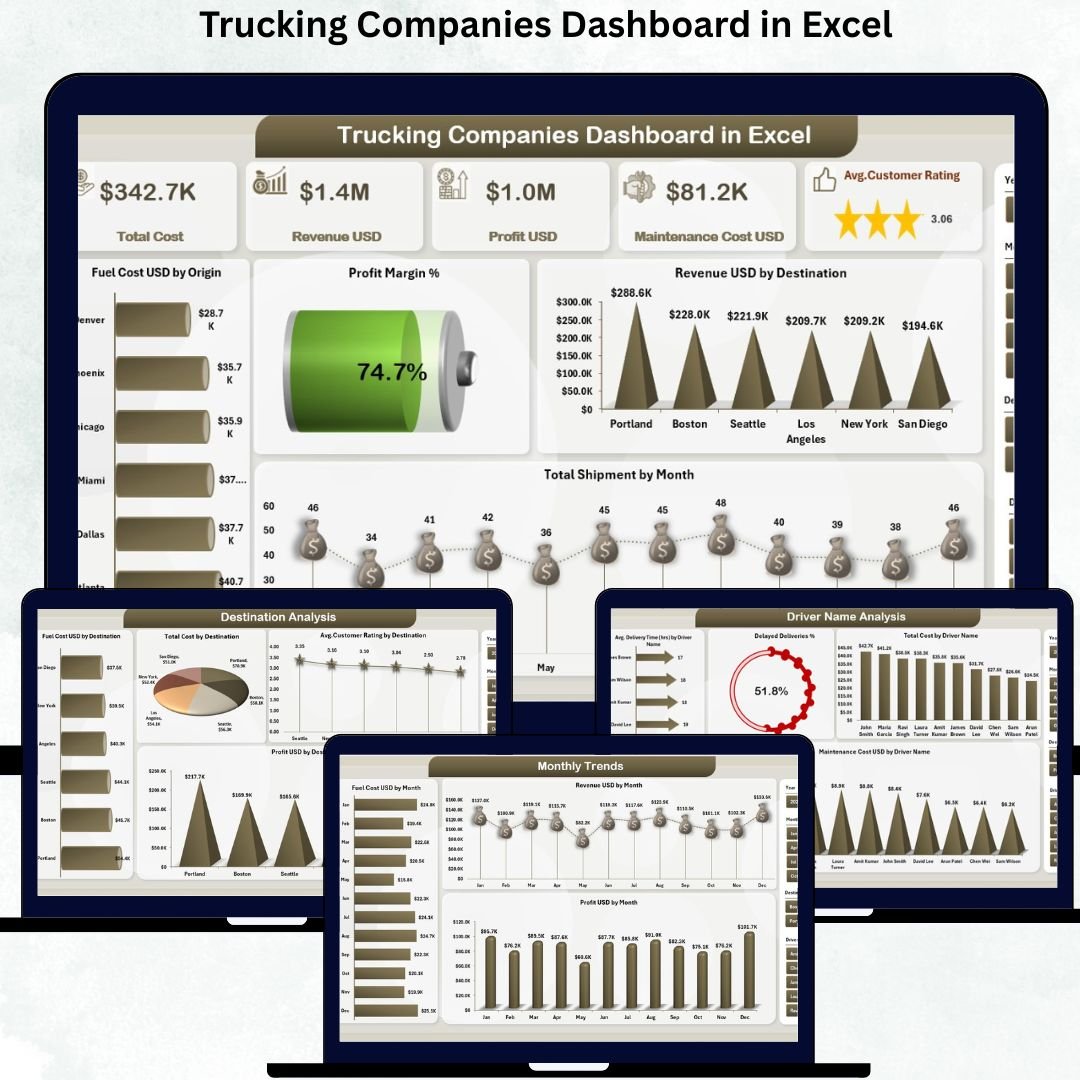
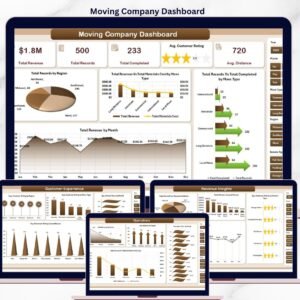
1️⃣ Overview Page – Your Complete Trucking Summary 🧭
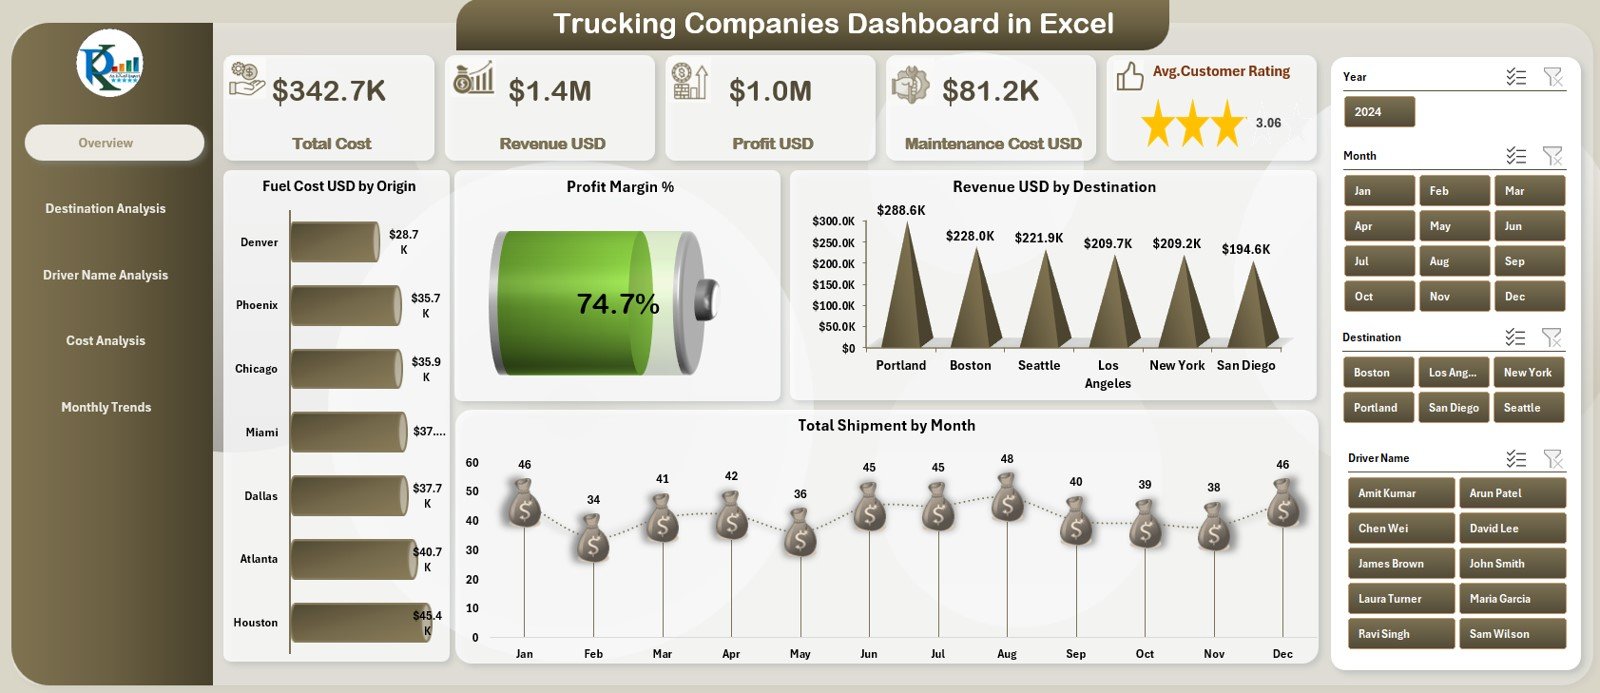
This page shows a high-level snapshot of your trucking business through five KPI cards:
-
Total Revenue
-
Total Profit
-
Total Shipments
-
Average Customer Rating
-
Fuel Cost
Below the KPIs, four powerful charts give deeper insights:
-
Profit Margin % – Understand profitability after expenses
-
Revenue USD by Destination – Identify top revenue-generating routes
-
Fuel Cost USD by Origin – Detect high fuel-consuming starting points
-
Total Shipments by Month – Identify seasonal or monthly shipment trends
This page alone gives you full visibility of business performance.
📦 What’s Inside the Trucking Companies Dashboard in Excel
This dashboard includes five detailed analytical pages that help you understand every part of your logistics operations.
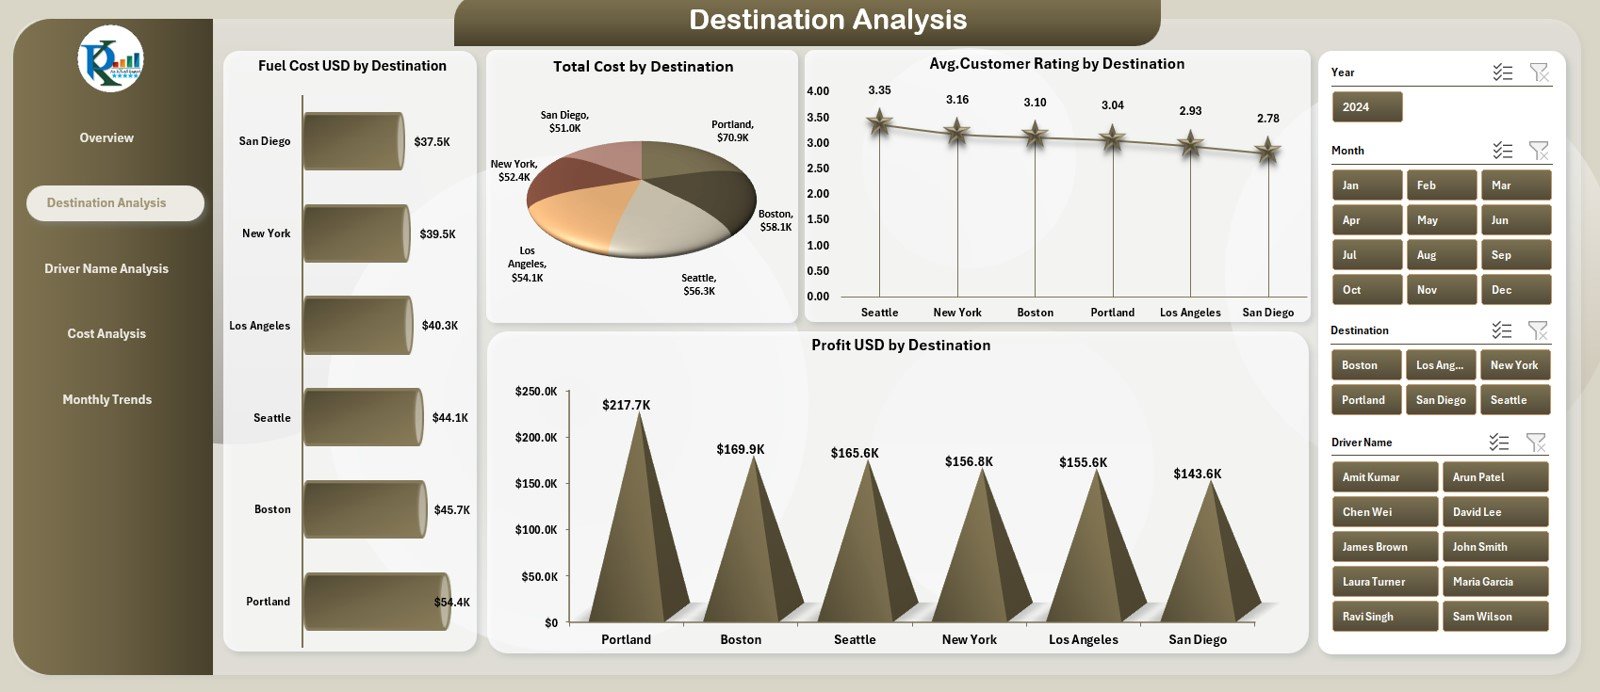
2️⃣ Destination Analysis – Optimize Routes & Reduce Costs 🗺️
This page focuses on destination-wise performance through four visuals:
-
Total Cost by Destination
-
Average Customer Rating by Destination
-
Fuel Cost by Destination
-
Profit USD by Destination
These insights help you identify profitable routes, reduce fuel waste, and improve customer satisfaction.
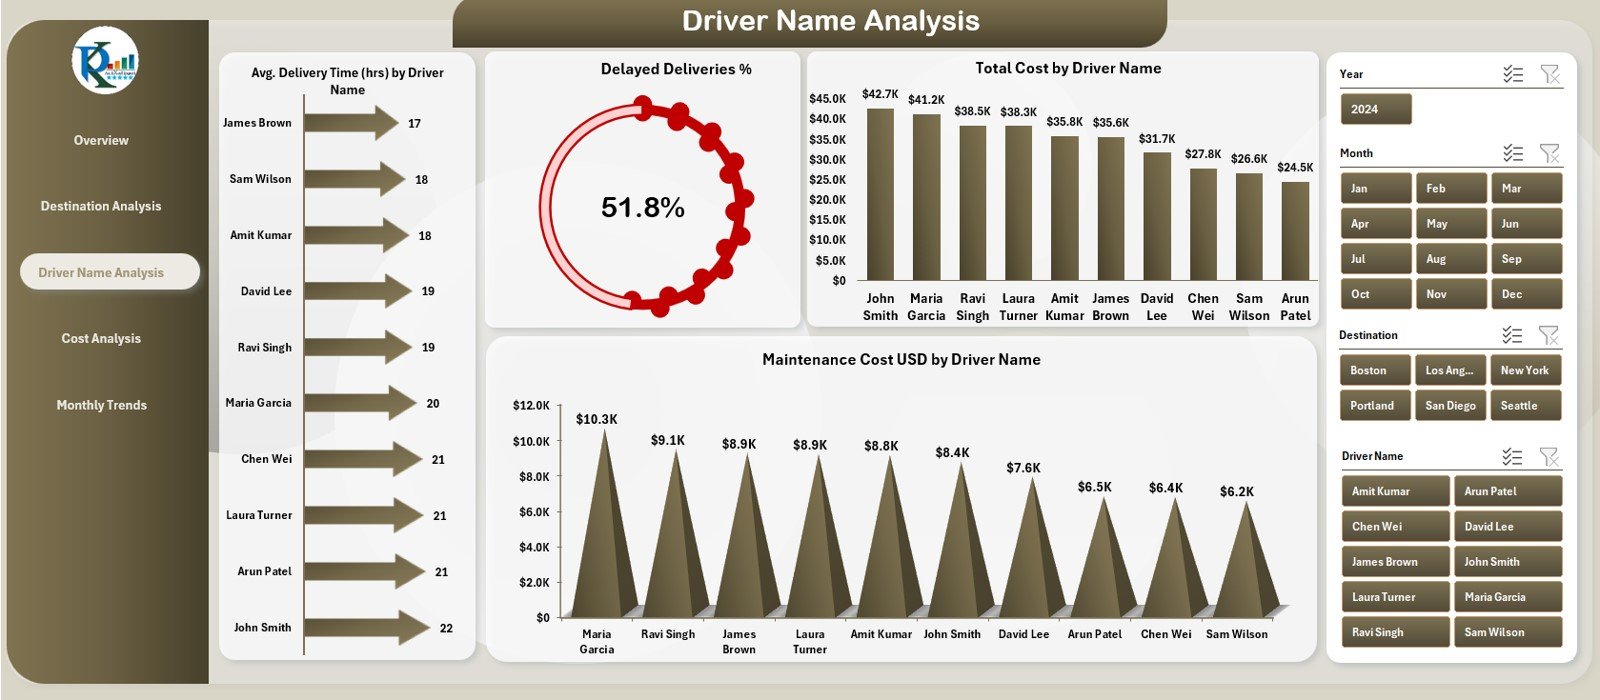
3️⃣ Driver Name Analysis – Track Driver Productivity & Costs 👨✈️
Drivers play a major role in delivery performance and fuel usage. This page includes:
-
Delayed Deliveries % by Driver Name
-
Total Cost by Driver Name
-
Average Delivery Time by Driver Name
-
Maintenance Cost by Driver Name
This helps companies identify top drivers, plan training, reduce delays, and reward good performers.
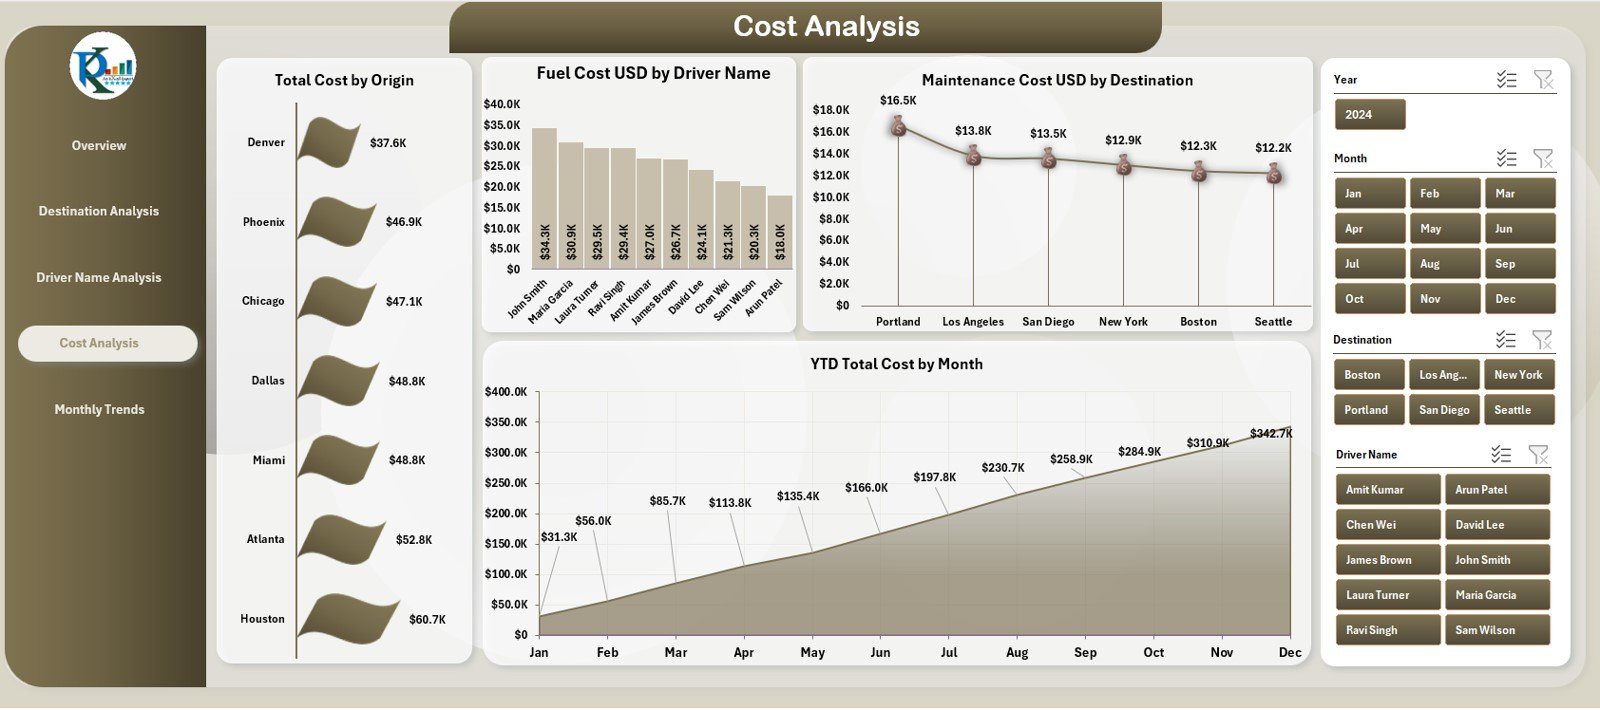
4️⃣ Cost Analysis – Understand the Cost Structure 💰
This page focuses on financial KPIs and includes:
-
Total Cost by Origin
-
Fuel Cost by Driver Name
-
Maintenance Cost by Destination
-
YTD Total Cost by Month
These insights support better financial planning and operational efficiency.
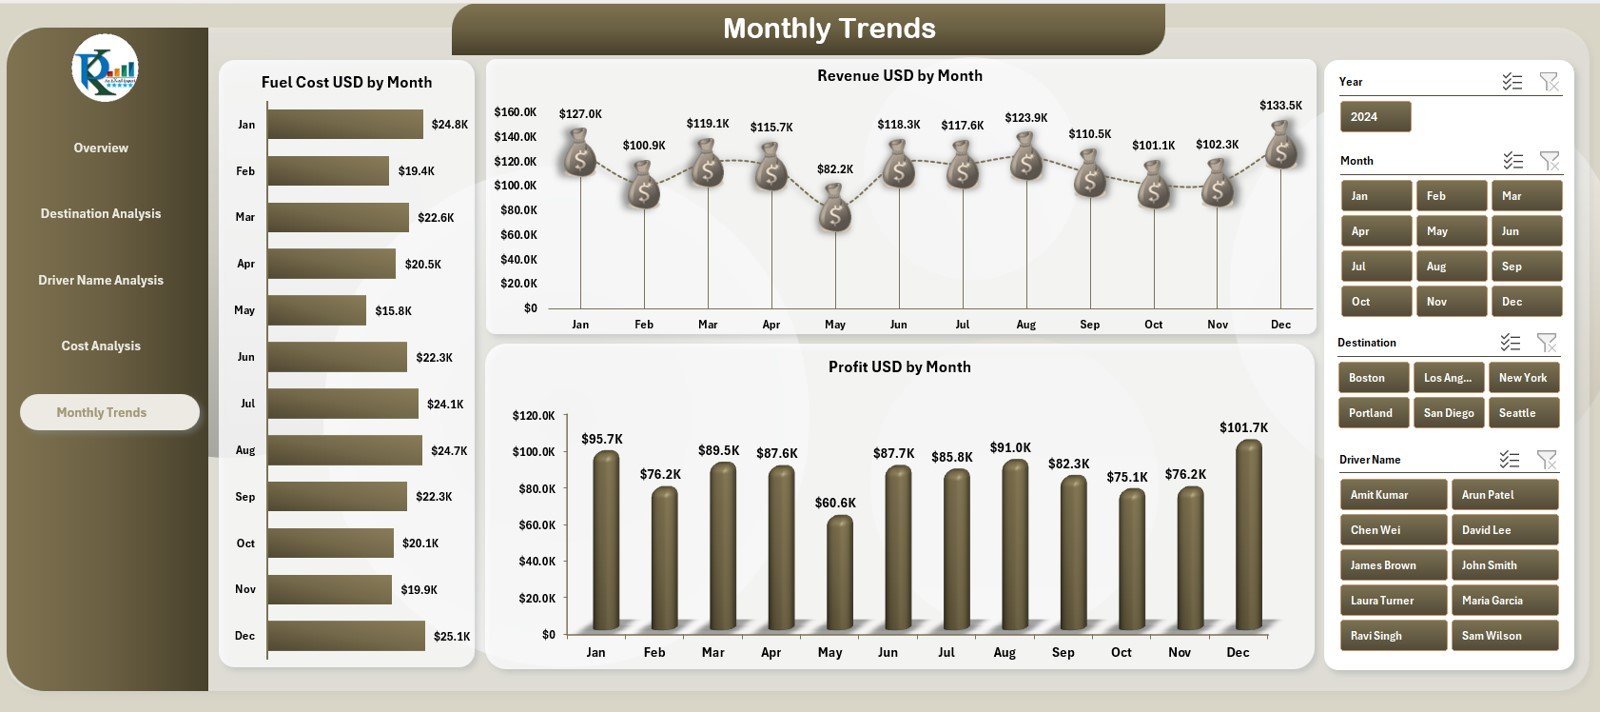
5️⃣ Monthly Trends – Understand Business Growth Month by Month 📅
Track how your business behaves across the year with:
-
Fuel Cost USD by Month
-
Revenue USD by Month
-
Profit USD by Month
This page helps you analyze seasonality, identify slow months, and plan for peak periods.
🛠 How to Use the Trucking Companies Dashboard in Excel
Using this dashboard is very simple:
1️⃣ Load the Data Sheet
Enter all shipment, cost, driver, revenue, and fuel details.
2️⃣ Create or Refresh Pivot Tables
Excel automatically updates all KPIs and charts.
3️⃣ Use KPI Cards for Instant Insights
Track revenue, profit, ratings, shipments, and fuel cost.
4️⃣ Navigate Between Pages Easily
Use the left-side navigation buttons for quick access.
5️⃣ Review Trends & Patterns
Use monthly trend charts to identify growth and issues.
6️⃣ Update Data Regularly
Fresh data improves accuracy and decision-making.
You don’t need advanced Excel skills—everything works automatically.
👥 Who Can Benefit from This Trucking Dashboard?
🚚 Fleet Managers
Track shipments, fuel usage, delivery times, and route efficiency.
🧭 Dispatch Teams
Plan routes, assign drivers, and prevent delays.
💼 Business Owners
Identify profit leaks, evaluate performance, and optimize operations.
📦 Logistics Teams
Improve customer satisfaction and track fleet productivity.
📊 Operational Analysts
Use real data to analyze performance, cost, and growth.
Whether your company has 5 trucks or 5,000—this dashboard improves control, accuracy, and profitability.


Reviews
There are no reviews yet.