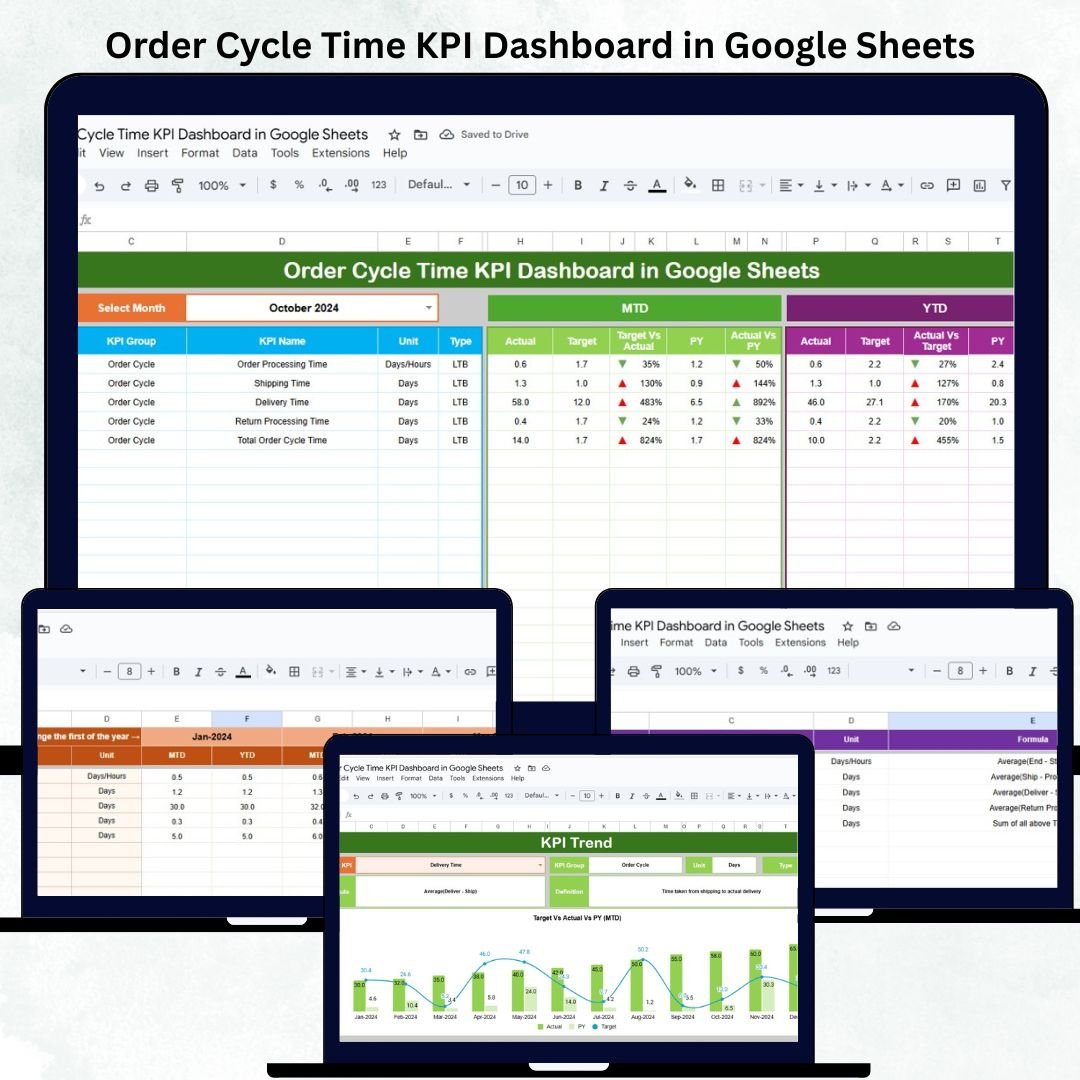
Order Cycle Time KPI Dashboard in Google Sheets is one of the most powerful KPIs in supply chain operations. It determines how fast your business processes customer orders—from order entry to fulfillment and delivery. When cycle time increases, delays rise, costs go up, and customer satisfaction drops. Yet many businesses still track these numbers manually, using scattered spreadsheets that lead to errors, poor visibility, and slower decision-making. That’s where the Order Cycle Time KPI Dashboard in Google Sheets becomes the perfect solution.
This ready-to-use dashboard gives supply chain teams complete clarity into order processing performance. Whether you manage e-commerce shipments, manufacturing orders, retail distribution, or B2B fulfillment, the dashboard helps you track every stage of the order cycle in one place. With automated visuals, trend charts, KPI comparisons, and MTD/YTD analysis, you can easily identify delays, optimize workflows, and improve operational efficiency—without any advanced tools or training.
✨ Key Features of Order Cycle Time KPI Dashboard in Google Sheets
This dashboard includes powerful tools built to enhance supply chain visibility.Order Cycle Time KPI Dashboard in Google Sheets
📊 Fully Automated Visualization Page – View MTD, YTD, target, and previous year comparisons instantly.
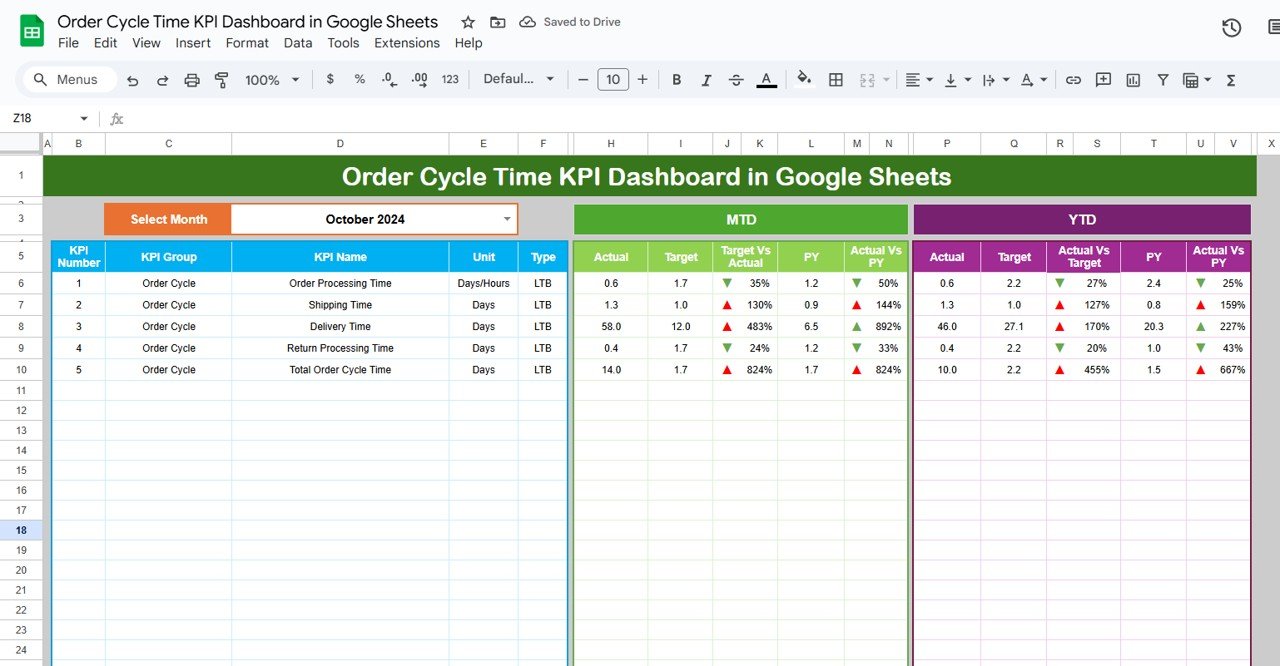
📅 Month Selector – Choose any month and the entire dashboard updates automatically.
⚡ Performance Indicators – See up/down arrows and color-coded results for quick insights.
📈 Trend Charts for 12 Months – Track improvement or decline for each KPI over the full year.
📝 KPI Definition Page – Understand formulas, units, type (UTB/LTB), and definitions clearly.
📥 Actual, Target & Previous Year Sheets – Organized data-entry structure for consistent reporting.
🤝 Real-Time Collaboration – Multiple team members can work at the same time via Google Sheets.
📦 Complete Order Cycle Tracking – Cover order entry, processing, picking, packing, shipping, and delivery.
Everything is designed to reduce manual effort and provide accurate, real-time order analytics.Order Cycle Time KPI Dashboard in Google Sheets
📦 What’s Inside the Order Cycle Time KPI Dashboard in Google Sheets
This template includes 6 structured worksheet tabs, each playing a critical role:Order Cycle Time KPI Dashboard in Google Sheets
📊 Dashboard Sheet (Main Visualization Page)
This is the primary reporting interface. It displays for each KPI:
-
MTD Actual, Target & Previous Year
-
MTD Target vs Actual & PY Comparison
-
YTD Actual, Target & Previous Year
-
YTD Target vs Actual & PY Comparison
The conditional formatting and icons make gaps easy to identify.
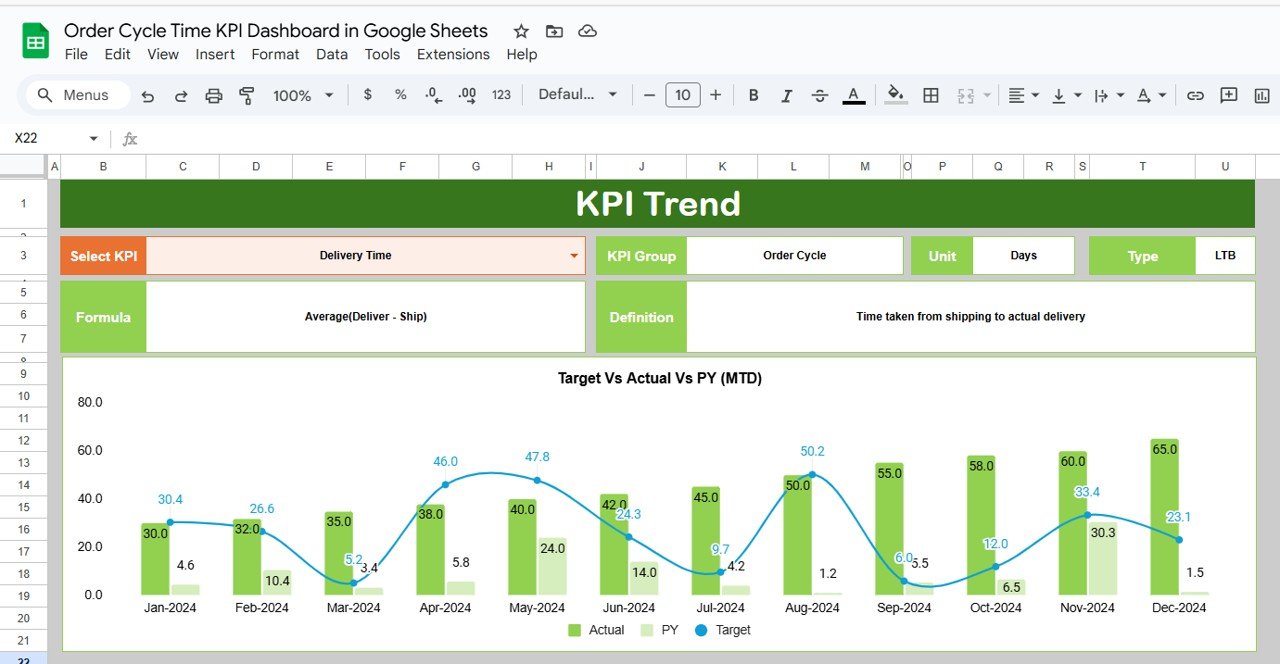
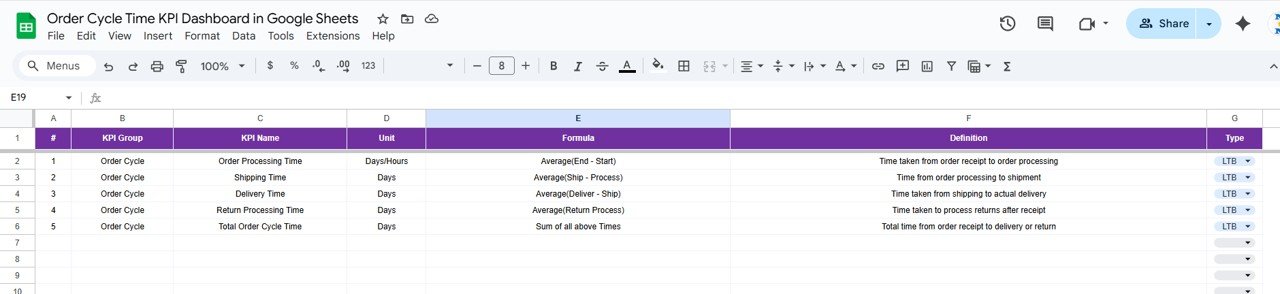
📈 KPI Trend Sheet
Select any KPI and view:
-
KPI Group
-
KPI Unit
-
KPI Type (LTB/UTB)
-
KPI Formula
-
KPI Definition
-
12-month trend chart
This page helps you understand performance patterns across the year.
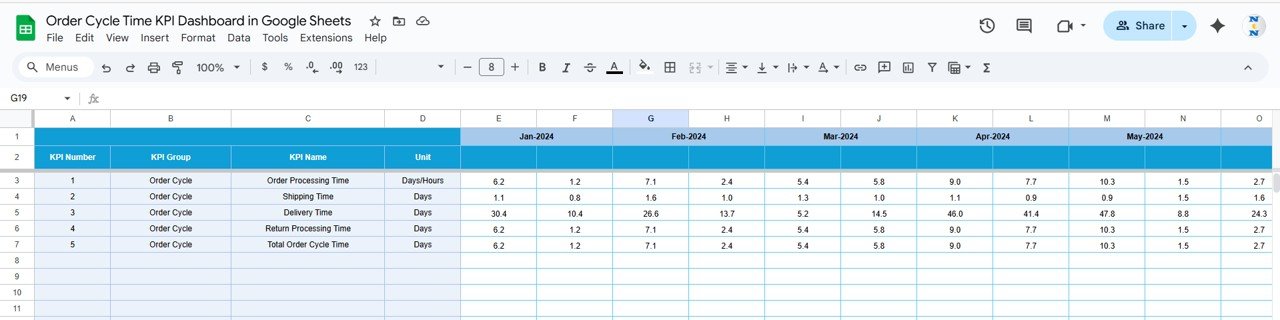
🧮 Actual Number Sheet
Enter monthly MTD & YTD actual values for all KPIs. Changing the month automatically adjusts the sheet.
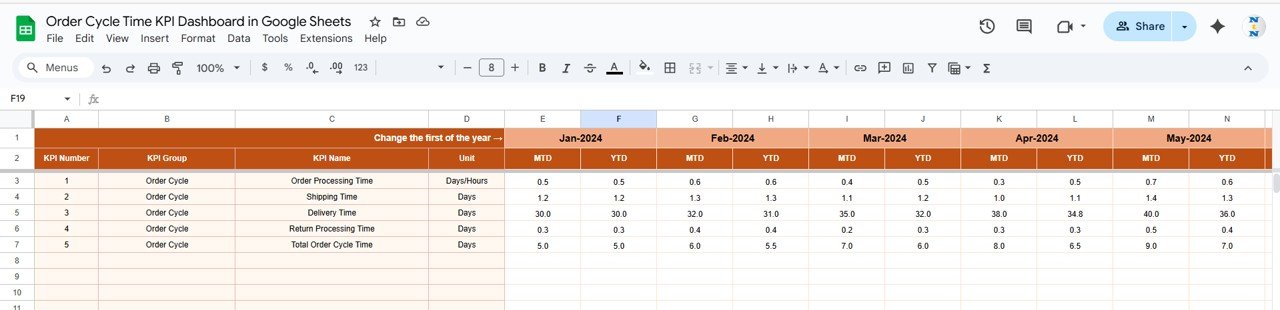
🎯 Target Sheet
Enter monthly targets for MTD and YTD values. This helps compare performance against goals.
🔁 Previous Year Sheet
Log previous year data for benchmarking and year-on-year performance reviews.
📘 KPI Definition Sheet
Contains KPI names, formulas, units, and types for full transparency.
Every sheet works together to deliver accurate calculations and professional visual analysis.
🛠️ How to Use the Order Cycle Time KPI Dashboard in Google Sheets
Using this dashboard is quick and beginner-friendly:
1️⃣ Enter actual order cycle data (MTD & YTD) in the Actual Sheet.
2️⃣ Set monthly targets in the Target Sheet.
3️⃣ Add previous year KPIs in the Previous Year Sheet.
4️⃣ Select any month on the Dashboard page to refresh visuals.
5️⃣ Use the Trend tab to review performance over 12 months.
6️⃣ Compare LTB vs UTB KPIs to understand efficiency and quality.
7️⃣ Use data for monthly performance reviews and improvement planning.
You do not need any advanced formulas or Power BI skills—everything is automated.
👥 Who Can Benefit from This Order Cycle Time KPI Dashboard in Google Sheets
This dashboard is ideal for:
🏭 Supply Chain Managers – Track fulfillment speed in real time.
📦 E-commerce Teams – Monitor order processing and delivery timelines.
🏬 Retail Distribution Centers – Optimize picking, packing, and shipping performance.
🏗️ Manufacturing Plants – Track work order cycle time and bottlenecks.
🚚 Logistics & Warehouse Teams – Analyze operational delays and improve efficiency.
📉 Operations Leaders – Identify long-term performance gaps using trend charts.
📊 Business Analysts – Use data-driven insights for continuous improvement.
Any business that processes customer orders will benefit from this dashboard.
Click here to read the Detailed blog post
Watch the step-by-step video Demo:
Visit our YouTube channel to learn step-by-step video tutorials
Visit our YouTube channel to learn step-by-step video tutorials


Reviews
There are no reviews yet.