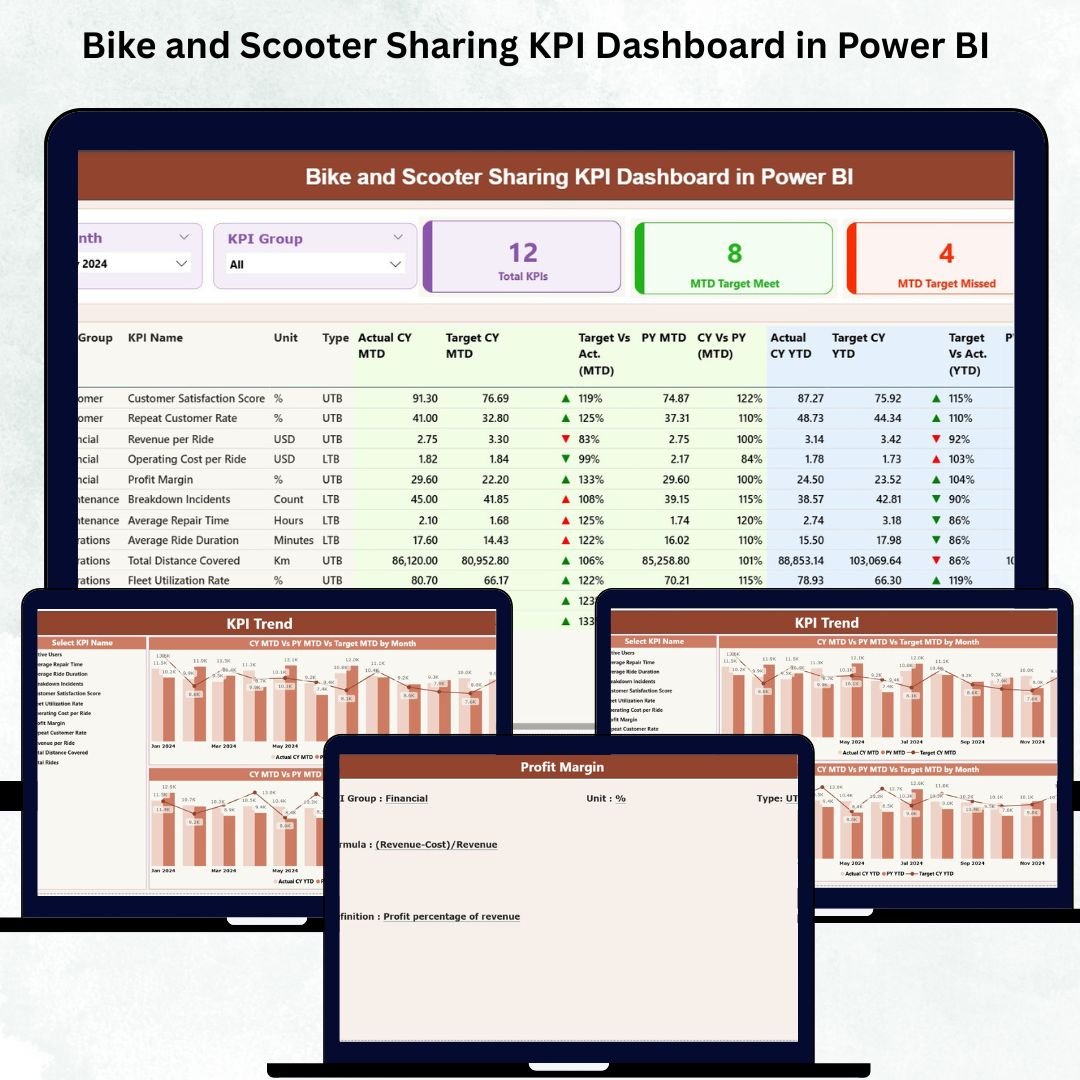
Bike and Scooter Sharing KPI Dashboard in Power BI Urban mobility is changing fast. Cities are growing, roads are getting busier, and people now prefer flexible, quick, and eco-friendly travel options. Because of this shift, bike and scooter sharing businesses are expanding rapidly. Bike and Scooter Sharing KPI Dashboard in Power BI But with growth comes complexity—operators must track thousands of trips per day, monitor vehicle availability, study weather patterns, evaluate rider behavior, and control operational costs. Managing all these using spreadsheets becomes slow, confusing, and inefficient.
That’s where the Bike and Scooter Sharing KPI Dashboard in Power BI becomes your most powerful decision-making tool.
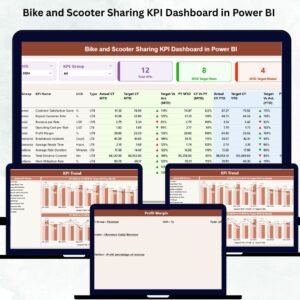
Bike and Scooter Sharing KPI Dashboard in Power BI This ready-to-use dashboard transforms your raw mobility data into clear insights, helping you understand your business performance in seconds. With automated visuals, MTD/YTD trends, KPI comparisons, and rich analytics, you gain complete control over revenue, trips, cancellations, fleet behavior, member usage, and more—without writing a single formula.
This dashboard is perfect for mobility operators, shared vehicle startups, fleet managers, and city planning teams who need faster reporting, deeper insights, and smarter decisions.
⭐ Key Features of Bike and Scooter Sharing KPI Dashboard in Power BI
(Designed to give total clarity across your mobility operations)
🚀 Interactive KPI Monitoring
The dashboard tracks all major KPIs such as gross fare, cancellations, discounts, trip count, net fare, ongoing trips, membership analysis, and more.
📊 Summary Page with MTD & YTD Insights
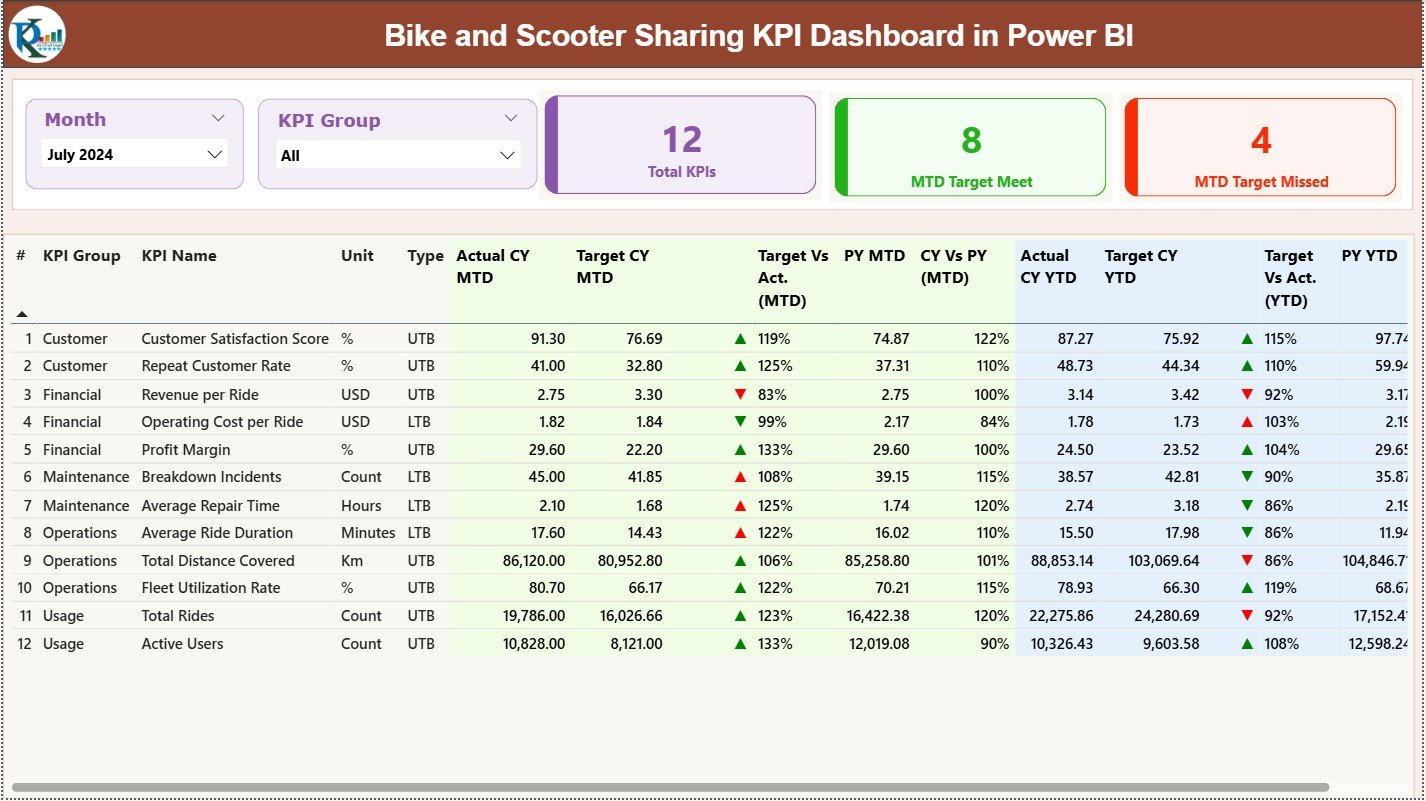
Understand the full picture instantly with KPI cards, performance icons, and a detailed KPI table that shows Actual vs Target and CY vs PY comparisons.
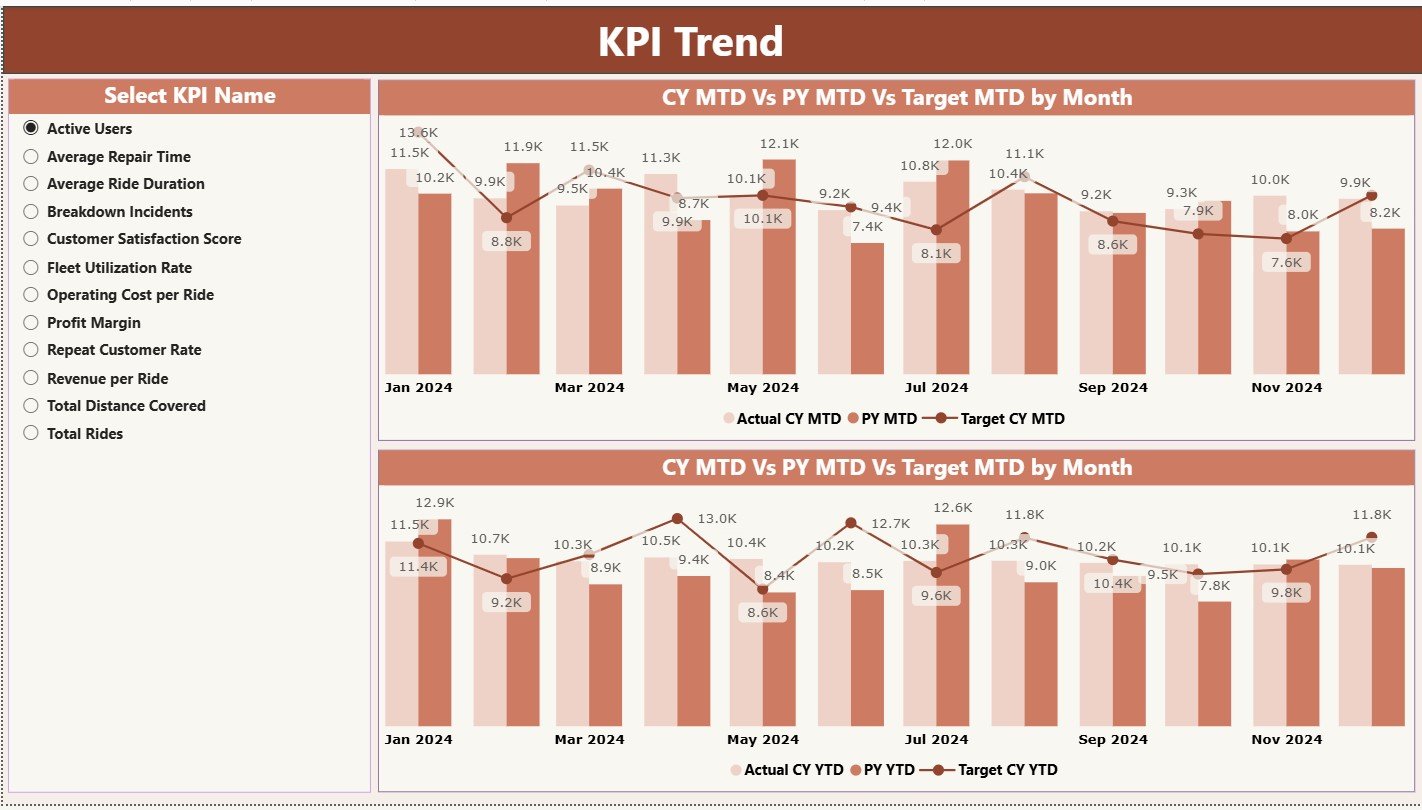
📅 KPI Trend Page
Analyze month-wise trends using two combo charts—MTD and YTD—showing current year, previous year, and target values together.
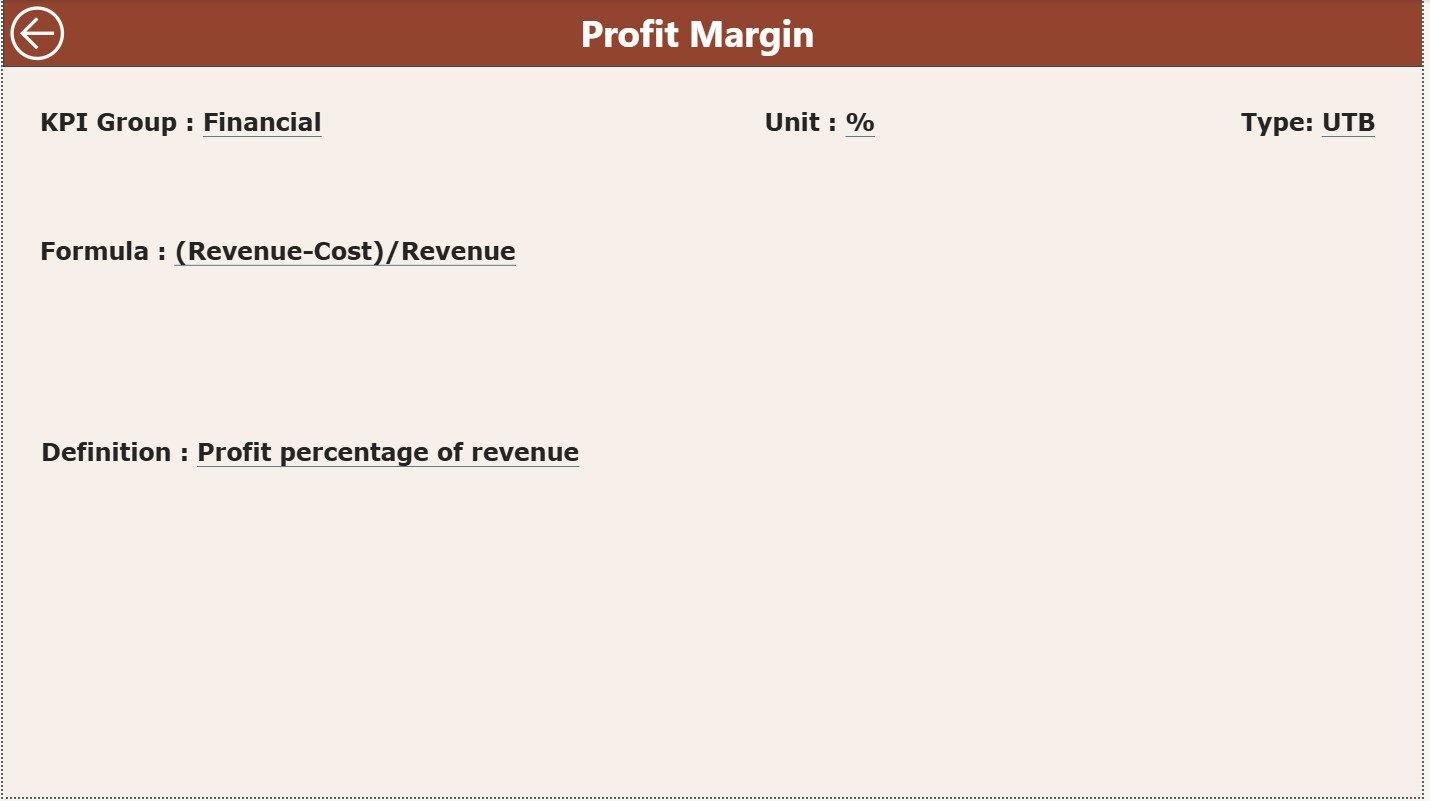
📝 Drill-Through KPI Definition Page
View complete KPI meaning, definition, formula, and type (UTB/LTB) through a simple drill-through click.
📁 Excel-Driven Data
You only update the Excel sheets for Actuals, Targets, and KPI Definitions—Power BI refreshes all visuals instantly.
🎯 Target Achievement Icons
See performance instantly using green ▲ for improvement and red ▼ for alerts.
🏙 City-Level, Weather-Level & Vehicle-Type Analysis
Easily understand how different locations, membership types, and vehicle types behave month by month.
📦 What’s Inside the Bike and Scooter Sharing KPI Dashboard
This complete package includes:
📁 1. Power BI Dashboard File
Fully designed with three analytical pages:
-
Summary Page
-
KPI Trend Page
-
KPI Definition Page
📊 2. Excel Source File
With three clean and structured sheets:
-
Input Actual
-
Input Target
-
KPI Definition
📘 3. Usage Guide
Explains how to update data, refresh visuals, drill through KPIs, and customize charts.
✔ 4. Ready-to-Use KPI Formulas
All KPIs include definitions and formulas for consistent reporting.
🧭 How to Use the Bike and Scooter Sharing KPI Dashboard
✅ Step 1: Enter Actuals
Fill the Input Actual sheet with:
-
KPI name
-
Month
-
MTD Actual
-
YTD Actual
✅ Step 2: Enter Targets
Update the Input Target sheet for:
-
MTD Target
-
YTD Target
✅ Step 3: Refresh in Power BI
Open the PBIX file and click Refresh.
All visuals, cards, and charts update instantly.
✅ Step 4: Analyze Performance
Use slicers for:
-
KPI Group
-
Vehicle Type
-
City
-
Weather
-
Membership Type
Explore trends, compare targets, and drill through for KPI definitions.
✅ Step 5: Make Data-Driven Decisions
Your team can:
-
Improve fleet availability
-
Reduce cancellations
-
Boost membership usage
-
Optimize revenue
-
Improve rider experience
👥 Who Can Benefit from This Dashboard
🚴 Mobility Startups
Track entire operations from one dashboard.
🛵 Scooter & Bike Sharing Operators
Monitor revenue, trip behavior, and fleet performance.
🏙 City Transport Planners
Understand mobility demand across different zones.
📈 Business Analysts
Get instant clarity without building reports from scratch.
🛠 Fleet Managers
Improve fleet allocation and minimize cancellations.
🔍 Leadership Teams
Make fast decisions using real-time visuals and trend analytics.
📘 Click here to read the detailed blog post
▶ Visit our YouTube channel to learn step-by-step video tutorials
Watch the step-by-step video tutorial:


Reviews
There are no reviews yet.