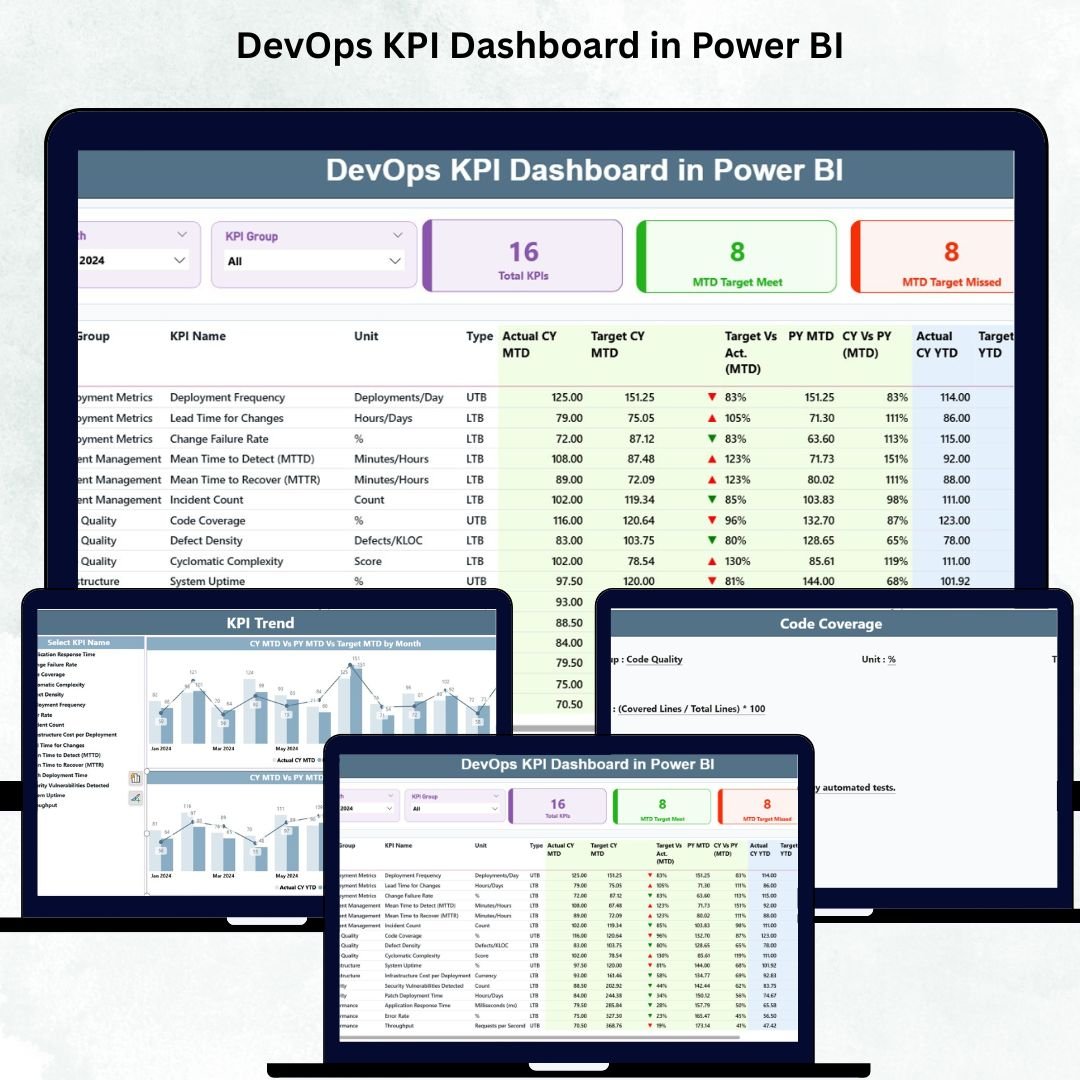
DevOps environments move fast. Teams deploy updates, fix bugs, measure performance, automate pipelines, and monitor production systems every single day. When this information stays scattered across spreadsheets or manual reports, teams lose speed and visibility. The DevOps KPI Dashboard in Power BI solves this challenge by bringing all DevOps metrics together in one clean, interactive, and real-time dashboard.
This ready-to-use dashboard helps DevOps engineers, QA teams, product managers, and leadership track key performance indicators (KPIs) instantly. You can analyze deployment frequency, MTTR, automation coverage, cycle time, failure rate, incident performance, year-to-date improvements, and more—without spending hours searching through data files. With just one click to select a month, the entire dashboard updates automatically.
Built entirely in Power BI, this dashboard works seamlessly with Excel data sources. Anyone can use it—no coding, no advanced analytics skills, and no complicated setup required. Just update your monthly data, refresh the dashboard, and get clear insights to support faster and smarter DevOps decisions.
⭐ Key Features of DevOps KPI Dashboard in Power BI
✨ Three Insightful Dashboard Pages – Summary, KPI Trend, and KPI Definition pages.
📊 Smart KPI Cards – Track total KPIs, MTD Target Met, and MTD Target Missed.
📍 Dynamic Slicers – Filter by Month or KPI Group with ease.
📈 MTD & YTD Tracking – Compare performance against monthly and yearly targets.
🔁 Last Year Comparison – Track whether KPIs improved compared to previous year.
📉 Trend Analytics – View KPI performance across months using combo charts.
📘 Full KPI Definitions – Drill-through to view formulas, definitions, and units.
⚡ 100% Automated Template – Update Excel sheets and refresh Power BI.
🧠 Beginner-Friendly – Clean, simple visuals make it easy for all DevOps teams.
This dashboard ensures complete clarity, strong reporting, and improved operational efficiency.
📦 What’s Inside the DevOps KPI Dashboard in Power BI
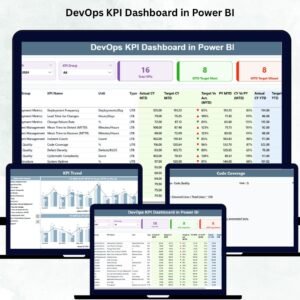
🟦 1. Summary Page – Your Complete DevOps Performance Snapshot
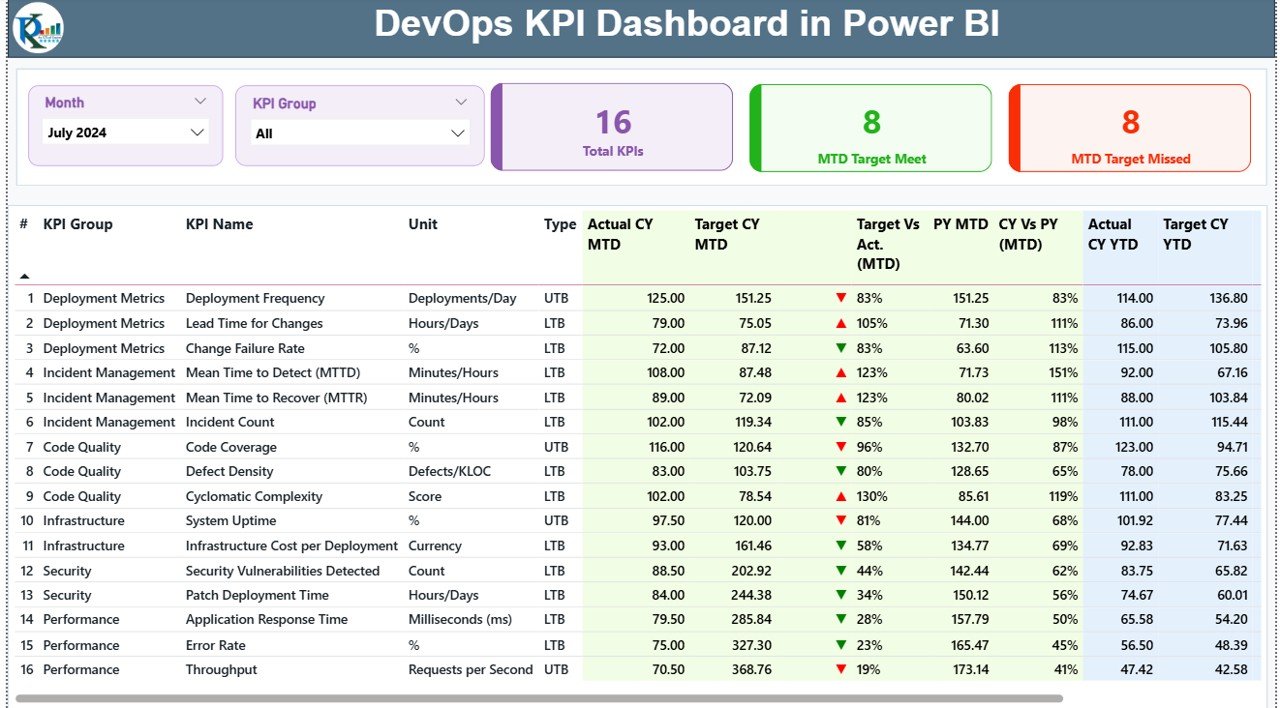
The Summary Page is the heart of the dashboard. It includes:
-
Month and KPI Group Slicers
-
Three KPI Cards:
✔ Total KPIs Count
✔ MTD Target Met Count
✔ MTD Target Missed Count -
Detailed KPI Table showing:
✔ KPI Number
✔ KPI Group
✔ KPI Name
✔ Unit
✔ KPI Type (UTB or LTB) -
Complete MTD Metrics:
✔ Actual CY MTD
✔ Target CY MTD
✔ MTD Arrow Icon (▲ / ▼)
✔ Target vs Actual %
✔ PY MTD
✔ CY vs PY (MTD %) -
Year-to-Date (YTD) Metrics:
✔ Actual CY YTD
✔ Target CY YTD
✔ YTD Arrow Icon
✔ Target vs Actual YTD %
✔ PY YTD
✔ CY vs PY (YTD %)
This highly detailed table gives teams a complete understanding of DevOps performance month after month.
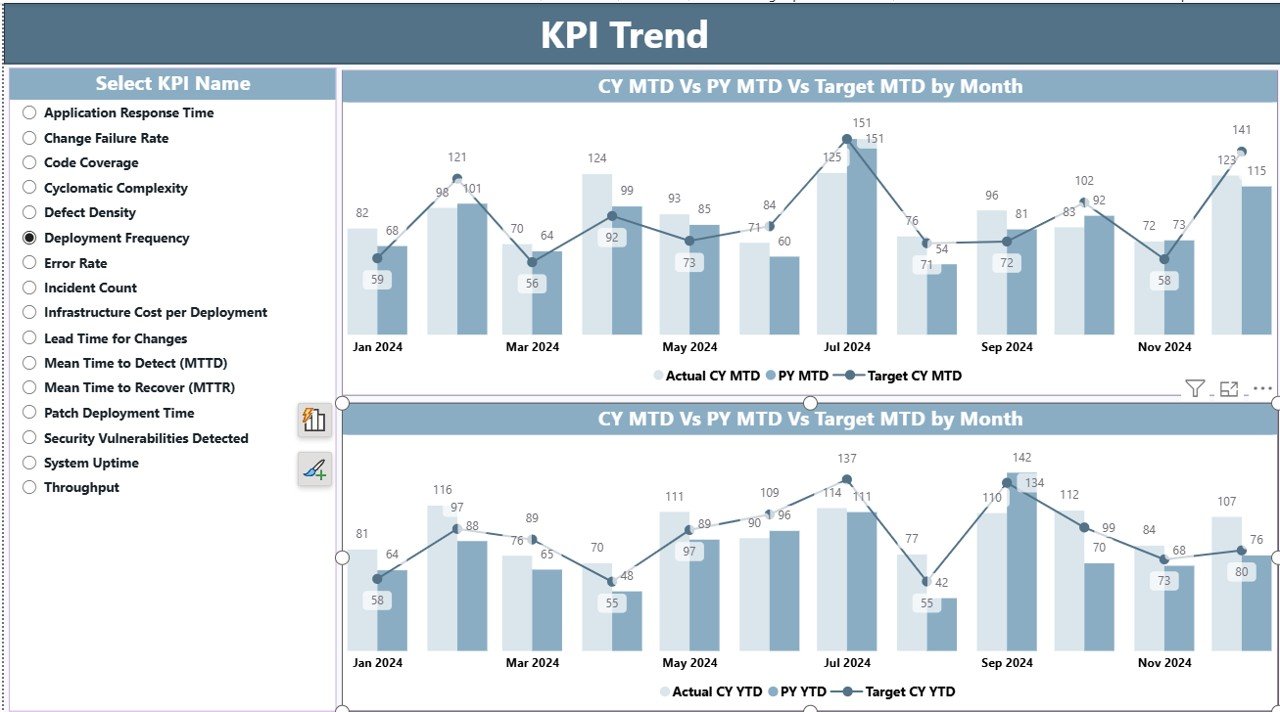
🟧 2. KPI Trend Page – Visualize Monthly and Yearly Changes
Understanding trends is essential for DevOps. The KPI Trend Page shows:
-
A slicer to choose any KPI
-
MTD Trend Chart – Actual vs Target vs Previous Year
-
YTD Trend Chart – Actual vs Target vs Previous Year
These charts help teams answer critical questions:
-
Is MTTR improving?
-
Is deployment frequency increasing?
-
Are failure rates dropping?
-
Is automation coverage improving month over month?
Trend visuals make complex DevOps changes easy to understand.
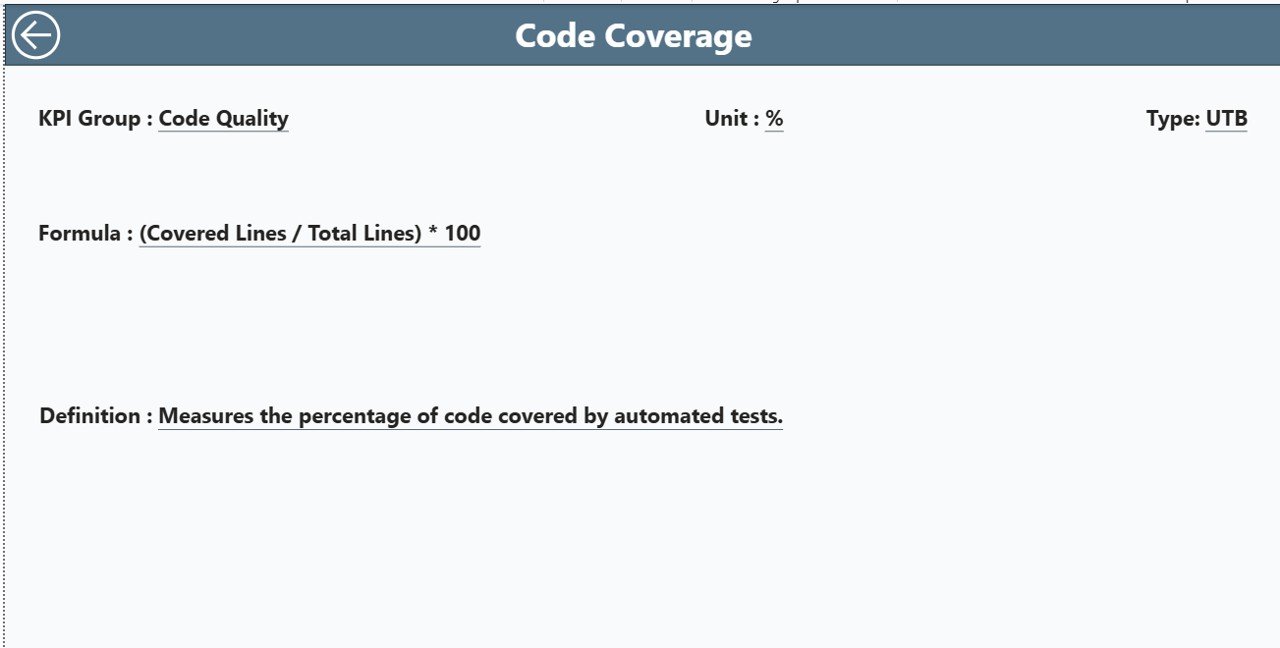
🟩 3. KPI Definition Page – Complete KPI Clarity
This drill-through page includes:
-
KPI Number
-
KPI Group
-
Formula
-
Definition
-
Unit
-
KPI Type (UTB/LTB)
It helps new team members understand KPIs instantly and ensures measurement consistency across DevOps, QA, and Operations.
🧠 How to Use the DevOps KPI Dashboard in Power BI
1️⃣ Open the PBIX file in Power BI Desktop.
2️⃣ Connect to your Excel data source.
3️⃣ Update Actual and Target sheets with monthly performance.
4️⃣ Refresh the dashboard to load updated metrics.
5️⃣ Use KPI Group and Month slicers to filter insights.
6️⃣ Explore trend charts and drill-through definitions for deeper analysis.
Within minutes, DevOps teams get a complete view of their operational performance.
👥 Who Can Benefit from This DevOps KPI Dashboard?
👨💻 DevOps Engineers – Track deployment speed, stability, and failures.
🧪 QA Teams – Measure testing efficiency and quality metrics.
🛠 Operations Teams – Monitor incident trends and resolution time.
📊 Project Managers – Track delivery performance and pipeline efficiency.
🏢 Leadership Teams – Evaluate long-term DevOps improvements.
📈 Scrum Masters / Agile Coaches – Monitor cycle time and velocity trends.
This dashboard is perfect for any team practicing CI/CD, automation, or agile development.


Reviews
There are no reviews yet.