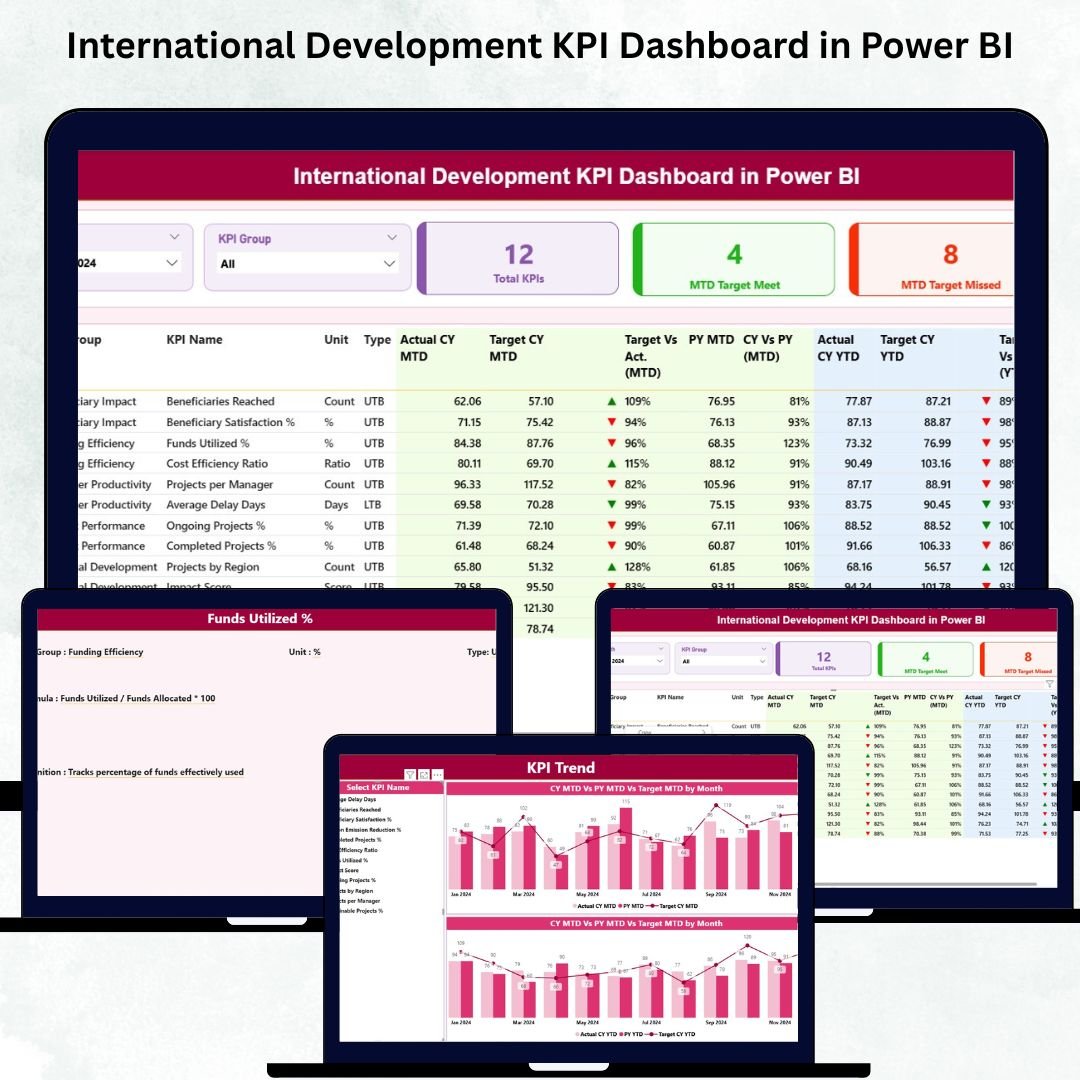
Managing global development programs requires real-time insights, transparent reporting, and fast decision-making. Whether you work with donor-funded initiatives, community outreach programs, multi-country operations, or impact-driven projects, having a clear performance dashboard is essential. The International Development KPI Dashboard in Power BI is a ready-to-use reporting solution designed to simplify your monitoring, evaluation, and reporting workflows. It converts your Excel data into powerful visuals that instantly show MTD (Month-to-Date), YTD (Year-to-Date), targets, previous year comparisons, and performance trends—all inside an interactive Power BI dashboard.
This dashboard helps development teams eliminate manual reporting, reduce errors, and monitor KPI performance with just one click. From donor reporting to impact measurement, every stakeholder gets the clarity they need to make informed decisions, fast.
✨ Key Features of the International Development KPI Dashboard in Power BI
Here are the most powerful features included in this dashboard:
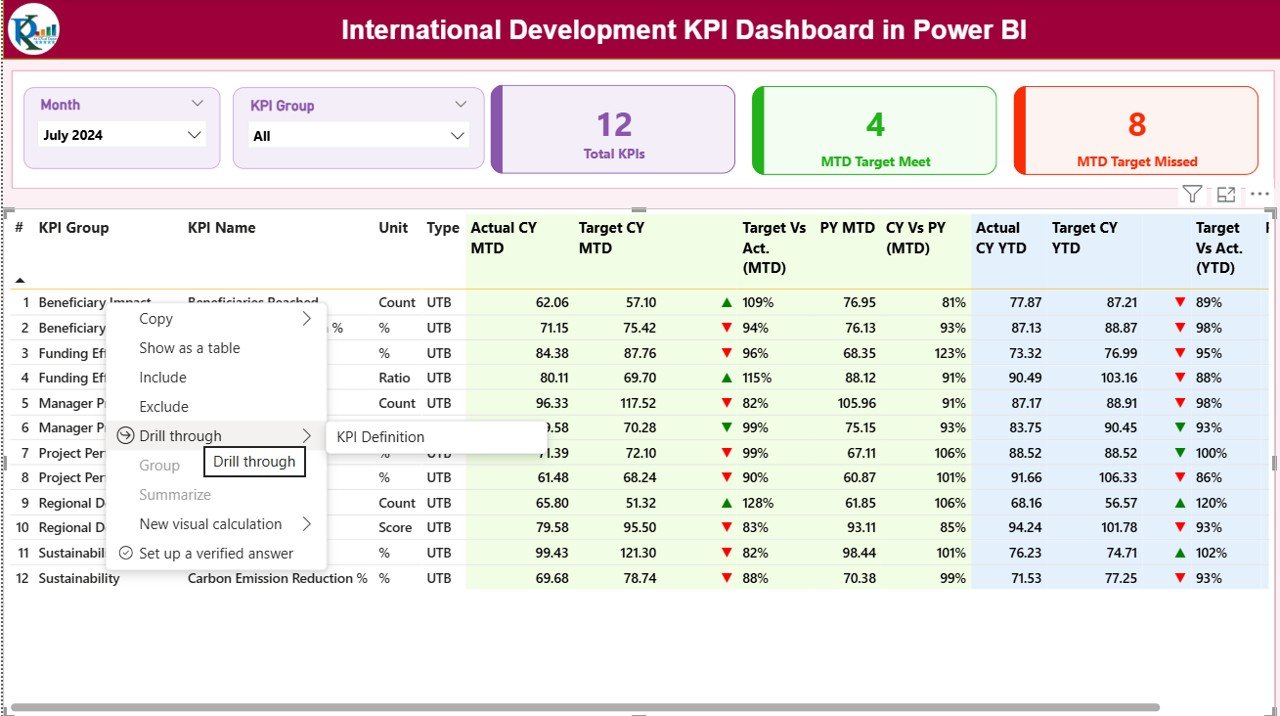
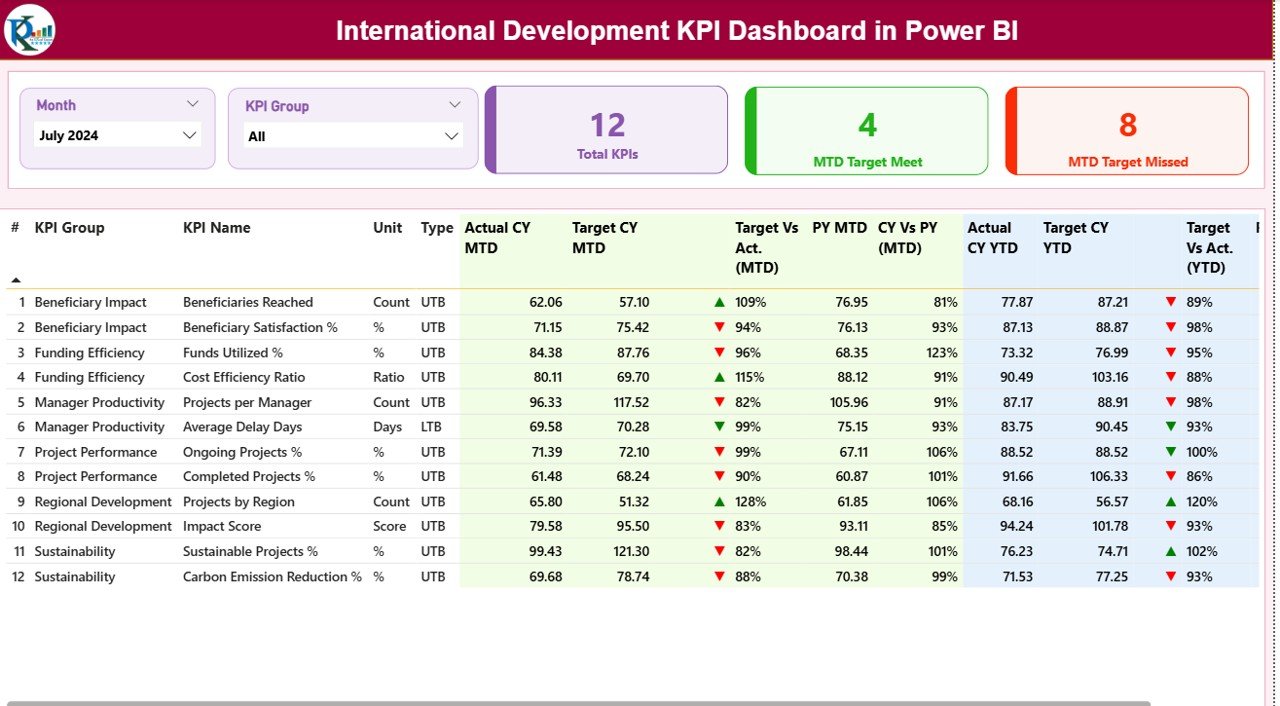
📌 Summary Page (Main Dashboard View)
The Summary Page is the command center of the dashboard.
It includes:
-
▶️ Month Slicer to select the reporting month
-
🎯 KPI Group Slicer to focus on specific categories
-
📊 Performance Cards showing Total KPIs, Target Met, and Target Missed
-
📋 Detailed KPI Table with MTD, YTD, target comparisons, PY values, and up/down performance icons
-
📈 Visual indicators (green & red arrows) that instantly highlight performance gaps
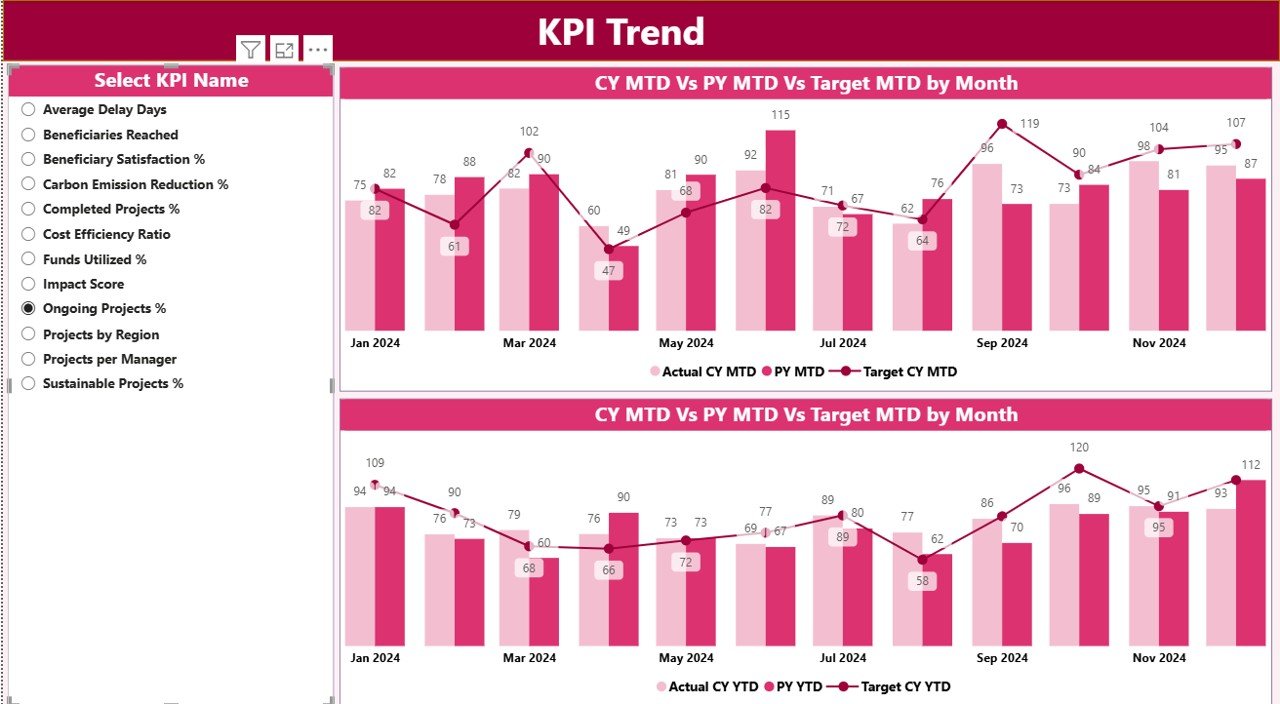
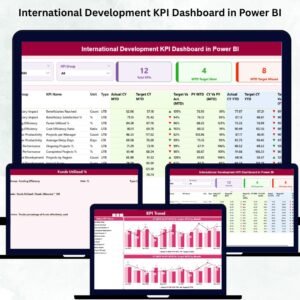
📈 KPI Trend Page (Deep Insights)
This page helps you analyze long-term performance through:
-
Two combo charts (MTD & YTD)
-
Comparison of Current Year vs Previous Year
-
A KPI selector to view trend movement for any metric
This is perfect for donor presentations, M&E reviews, and board reporting.
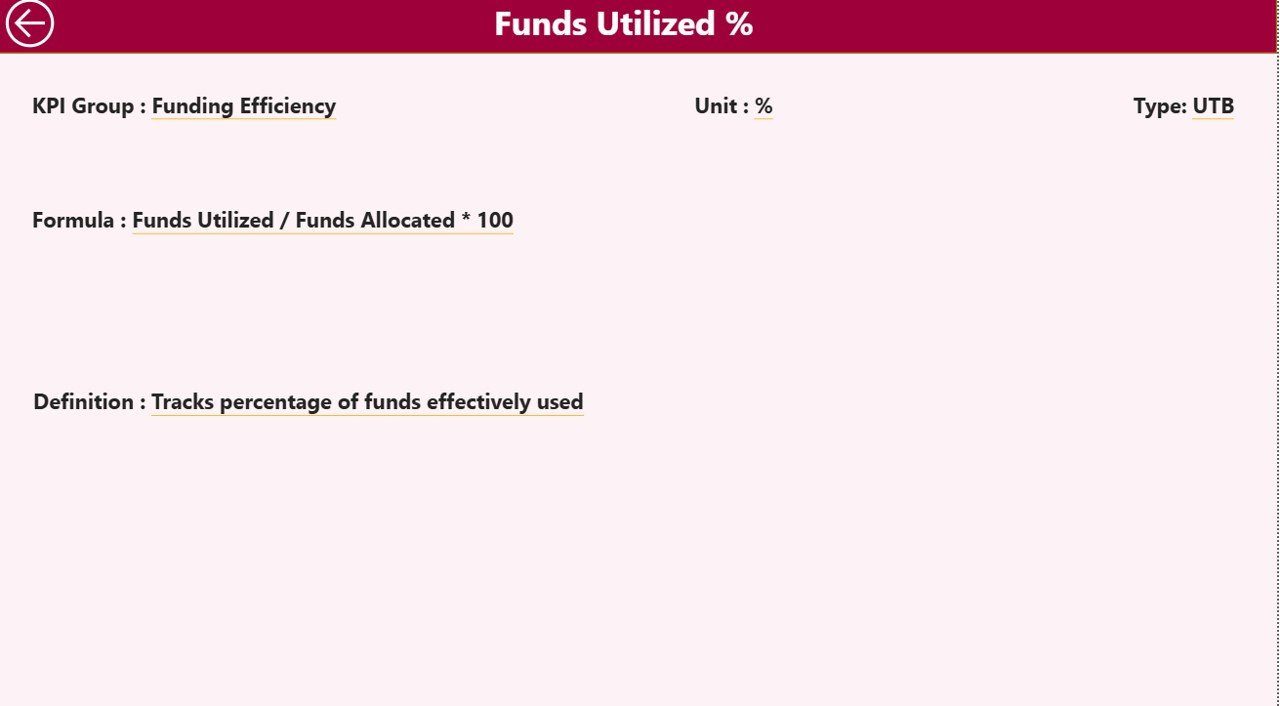
📘 KPI Definition Page (Drill-through Clarity)
This page gives complete transparency for every KPI.
You see:
-
KPI Name
-
KPI Group
-
Unit
-
Formula
-
Type (UTB/LTB)
-
KPI Definition
This ensures your entire organization interprets KPI calculations accurately and consistently.
📦 What’s Inside the International Development KPI Dashboard in Power BI
When you download this product, you receive:
🟦 Power BI Dashboard File (PBIX)
Fully designed with slicers, charts, performance icons, and drill-through pages.
🟩 Excel Source File (Editable Data Structure)
Includes three input sheets:
-
Input_Actual – Enter MTD & YTD actuals
-
Input_Target – Enter MTD & YTD targets
-
KPI Definition – Enter KPI details, formulas, and categories
📁 Clean & Organized KPI Framework
All KPIs are structured to match real development workflows including:
-
Operational KPIs
-
Impact KPIs
-
Outreach KPIs
-
Donor KPIs
-
Compliance KPIs
-
Budget & finance KPIs
📄 Documentation Guide
Step-by-step instructions to update, refresh, and customize the dashboard.
Everything is designed to work smoothly—even if you’re new to Power BI.
🛠️ How to Use the International Development KPI Dashboard in Power BI
You don’t need advanced Power BI knowledge. Just follow these steps:
1️⃣ Update Excel Sheets
Enter monthly numbers into the Actual, Target, and Definition sheets.
2️⃣ Open the PBIX File
Power BI automatically reads the updated Excel data.
3️⃣ Refresh the Dashboard
Click Refresh and watch all charts, icons, and metrics update instantly.
4️⃣ Use Slicers for Instant Filtering
Filter by:
-
Month
-
KPI Group
-
KPI Name
-
Program or category
5️⃣ Use Drill-Through for KPI Details
Right-click any KPI to view its formula and definition.
6️⃣ Export Reports
Share PDF reports, screenshots, or Power BI service dashboards.
This workflow saves hours of manual reporting every month.
👥 Who Can Benefit from This International Development KPI Dashboard in Power BI
This dashboard is perfect for professionals and teams across the development sector:
👨💼 Program Managers
Track monthly progress, identify risks, and prepare reports quickly.
📊 M&E Analysts
Analyze trends, compare performance, and measure impact effectively.
💰 Donor Relations Teams
Create transparent and visually appealing donor updates.
🌍 Country Directors
Monitor multi-country operations and track location-based performance.
🏥 Field Officers
Review local-level KPIs and improve on-ground execution.
💵 Finance Teams
Monitor budget utilization, target vs actuals, and financial KPIs.
📑 NGO Leadership
Get high-level insights to make strategic decisions.
If your development programs run across multiple regions or depend on donor funding, this dashboard becomes an essential productivity tool.
📘 Click here to read the Detailed blog post
Watch the step-by-step video tutorial:


Reviews
There are no reviews yet.