Managing training and coaching performance becomes easy only when you have the right analytics in place. Most training teams struggle with scattered data, manual Excel tracking, and confusing reporting formats. This often leads to slow decision-making and unclear visibility of learner progress, coaching effectiveness, and target achievement.
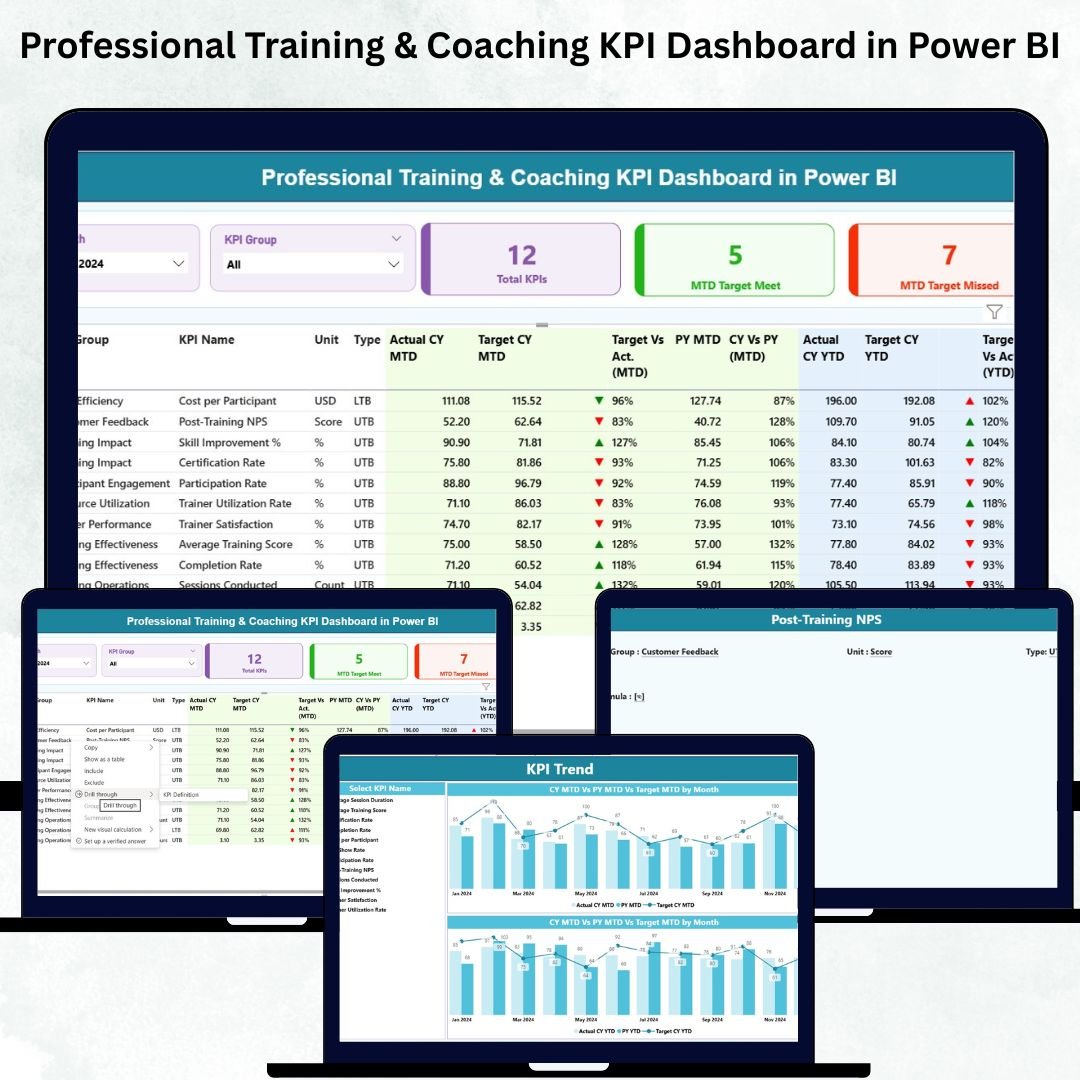
⭐ The Professional Training & Coaching KPI Dashboard in Power BI solves all these challenges by bringing your entire training performance into one clean, intelligent, and automated dashboard. With powerful filters, rich visuals, and automated insights, this dashboard becomes your single source of truth for all training KPIs.
Whether you run a corporate L&D department, a coaching center, a leadership development program, or a skills-training academy, this ready-to-use dashboard gives you everything you need to track performance month-wise, group-wise, category-wise, and KPI-wise.
Key Features of the Professional Training & Coaching KPI Dashboard in Power BI 🎯
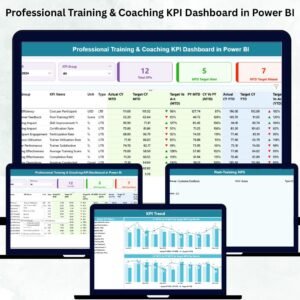
This dashboard includes three smartly designed pages created to simplify performance monitoring and accelerate decision-making.
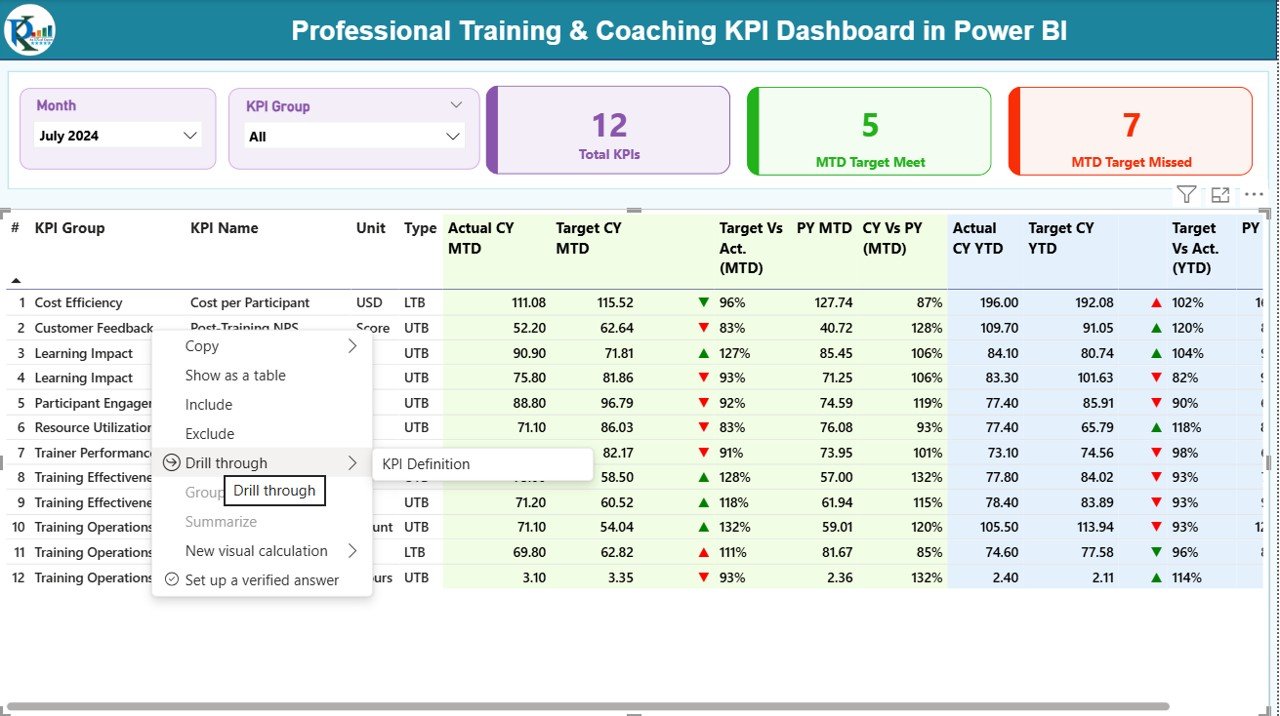
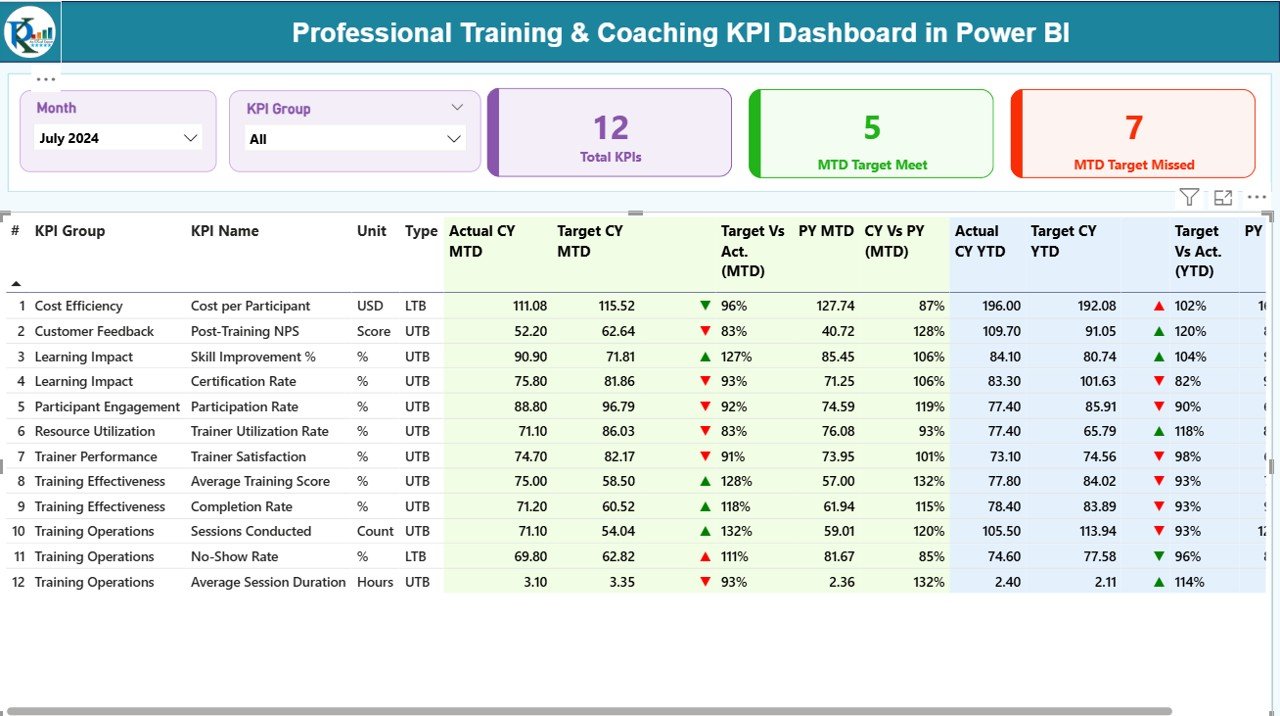
✨ Summary Page – Complete KPI Overview
The Summary Page is your main control center. You can select any month using the Month Slicer and instantly see the updated performance. The KPI Group Slicer allows you to check performance for categories like technical training, soft skills, certifications, leadership programs, and more.
At the top, three interactive KPI cards show:
-
Total KPIs Count
-
MTD Target Met Count
-
MTD Target Missed Count
Below the cards, a detailed KPI table displays KPI numbers, groups, names, units, LTB/UTB type, actual MTD/YTD, target MTD/YTD, PY comparisons, and color-coded arrows for performance evaluation.
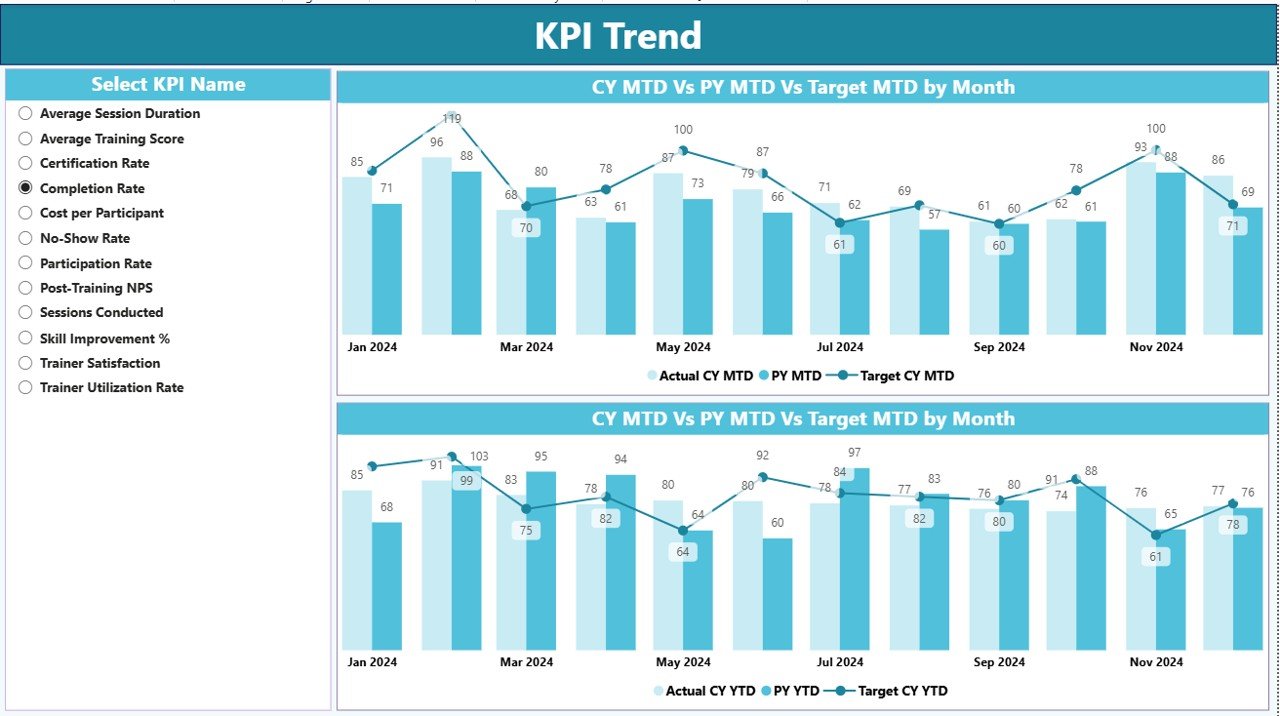
📈 KPI Trend Page – Monthly Progress Analysis
This page gives you a deeper look into monthly trends. Two combo charts show:
-
Current Year Actual
-
Previous Year Actual
-
Target
-
MTD & YTD Variations
You can select any KPI from the slicer to compare performance over time.
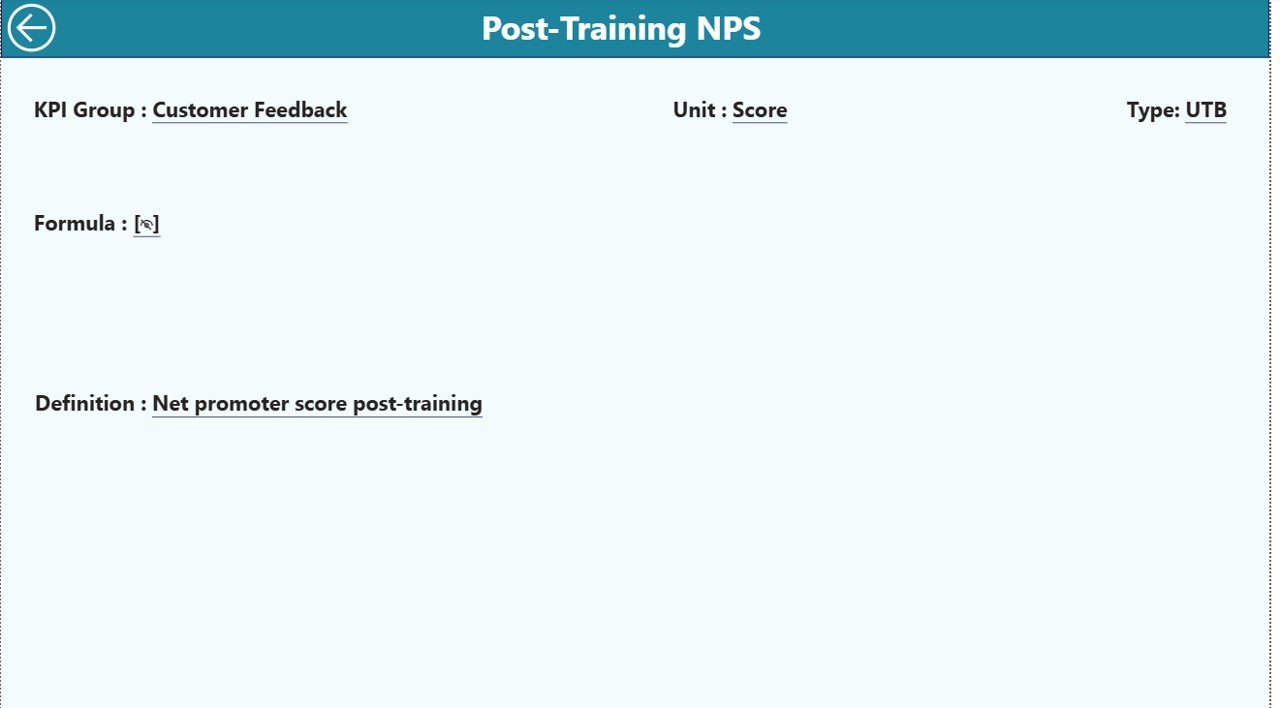
📘 KPI Definition Page – Complete KPI Documentation
This drill-through page displays each KPI’s number, group, name, unit, formula, definition, and type (LTB/UTB). This helps every team member understand KPIs clearly.
What’s Inside the Professional Training & Coaching KPI Dashboard in Power BI 📂
Inside this product, you will get:
📊 Power BI Dashboard File (.PBIX)
A fully designed, interactive, and ready-to-use dashboard.
📘 3 Excel Input Sheets
-
Input_Actual Sheet – Enter MTD and YTD actual values
-
Input_Target Sheet – Enter MTD and YTD targets
-
KPI Definition Sheet – Document KPI details
📄 Detailed KPI Structure
Includes KPI numbers, names, formulas, units, and definitions.
🧭 Navigation Buttons
Easy drill-through and quick navigation inside the dashboard.
🔧 Built-In Logic & Indicators
Automatic MTD/YTD calculations, growth percentages, and color-coded arrows.
How to Use the Professional Training & Coaching KPI Dashboard in Power BI 🛠️
Using this dashboard is extremely simple:
1️⃣ Open the Excel File
Fill the Actual, Target, and KPI Definition sheets with your organization’s data.
2️⃣ Open the Power BI File
Load the Excel file and refresh the data.
3️⃣ Use Month & KPI Group Filters
Select different months and KPI categories to explore insights.
4️⃣ Drill Through KPIs
Click on any KPI in the Summary Page to open the KPI Definition Page.
5️⃣ Export Reports for Management
Use visuals to create reports for trainers, L&D heads, leadership teams, and clients.
Who Can Benefit from This Professional Training & Coaching KPI Dashboard? 👥
This dashboard is ideal for:
🎓 Corporate L&D Teams
Track training quality, efficiency, and month-wise performance.
🏫 Coaching Institutes & Training Academies
Monitor learner results, program success, and instructor effectiveness.
💼 HR Departments
Evaluate skill-building outcomes, soft-skill development, and learning progress.
👨🏫 Freelance Coaches & Trainers
Show professional reports to clients and manage coaching KPIs visually.
🧑💼 Business Leaders & Management
Get complete visibility of training ROI and performance improvements.


Reviews
There are no reviews yet.