
Managing HR performance becomes easy, fast, and 100% data-driven with our Human Resources (HR) KPI Dashboard in Power BI. This ready-to-use dashboard brings every important HR metric into one clear, interactive, and visually powerful reporting system. Whether you want to track hiring, employee engagement, training performance, attendance, payroll accuracy, or workforce trends — everything is beautifully organised and updated automatically.
Built inside Microsoft Power BI, this dashboard helps HR leaders eliminate scattered Excel sheets, manual calculations, and time-consuming monthly reports. All you need to do is update the source Excel file, refresh the dashboard, and instantly get your MTD, YTD, Target, and Previous Year performance for all KPIs. It’s fast, simple, accurate, and perfect for both HR professionals and management teams.
With beautifully designed visuals, month slicers, KPI group filters, trend charts, performance icons, and drill-through pages, this HR KPI Dashboard becomes your all-in-one HR analytics solution.
✨ Key Features of the Human Resources (HR) KPI Dashboard in Power BI
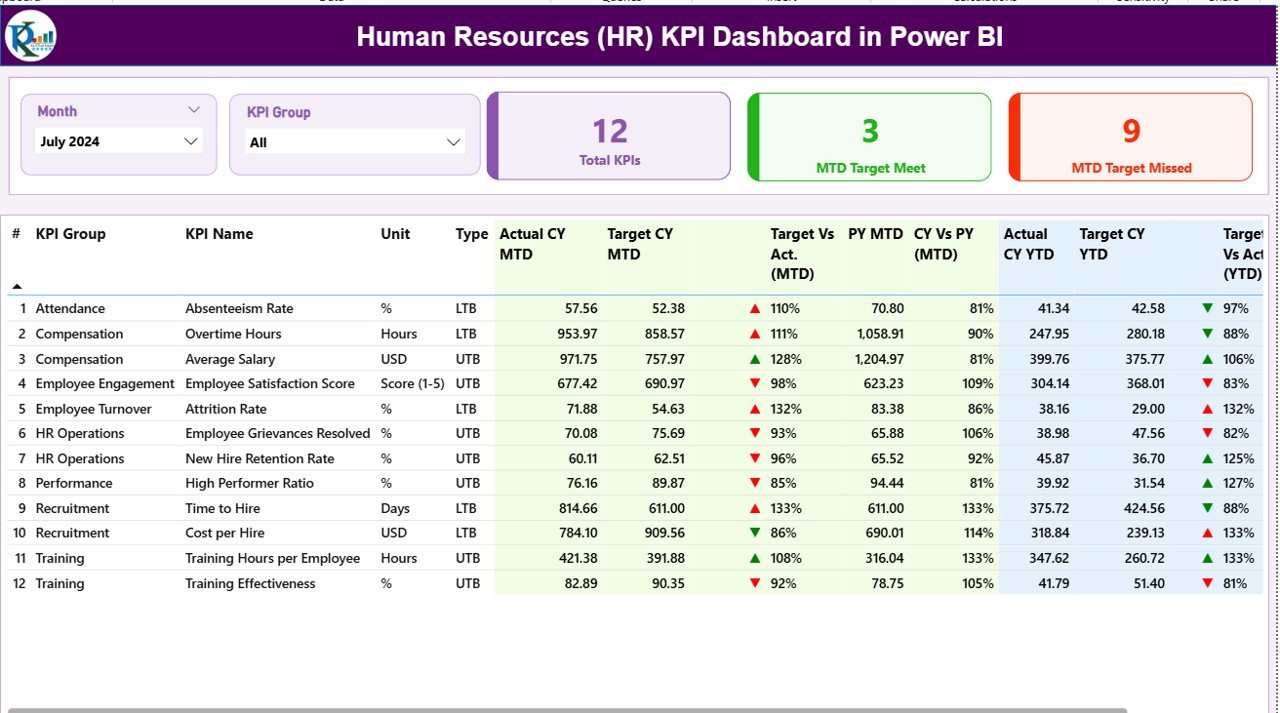
📊 1. Summary Page – Complete HR Overview
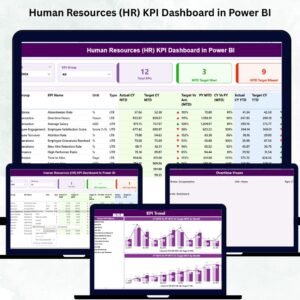
The Summary Page gives you a full snapshot of HR performance in one click.
You can filter by Month and KPI Group to instantly refresh all visuals.
The page includes:
-
⭐ Total KPIs Count – See all KPIs included in measurement
-
✔️ MTD Target Met – KPIs performing well
-
❌ MTD Target Missed – KPIs that need improvement
Below these cards, a detailed KPI table displays:
-
KPI Number
-
KPI Group
-
KPI Name
-
Unit
-
Type (UTB or LTB)
-
Actual vs Target (MTD & YTD)
-
Previous Year Comparison
-
Up/Down icons for performance
This page helps HR teams and leaders understand the workforce situation instantly.
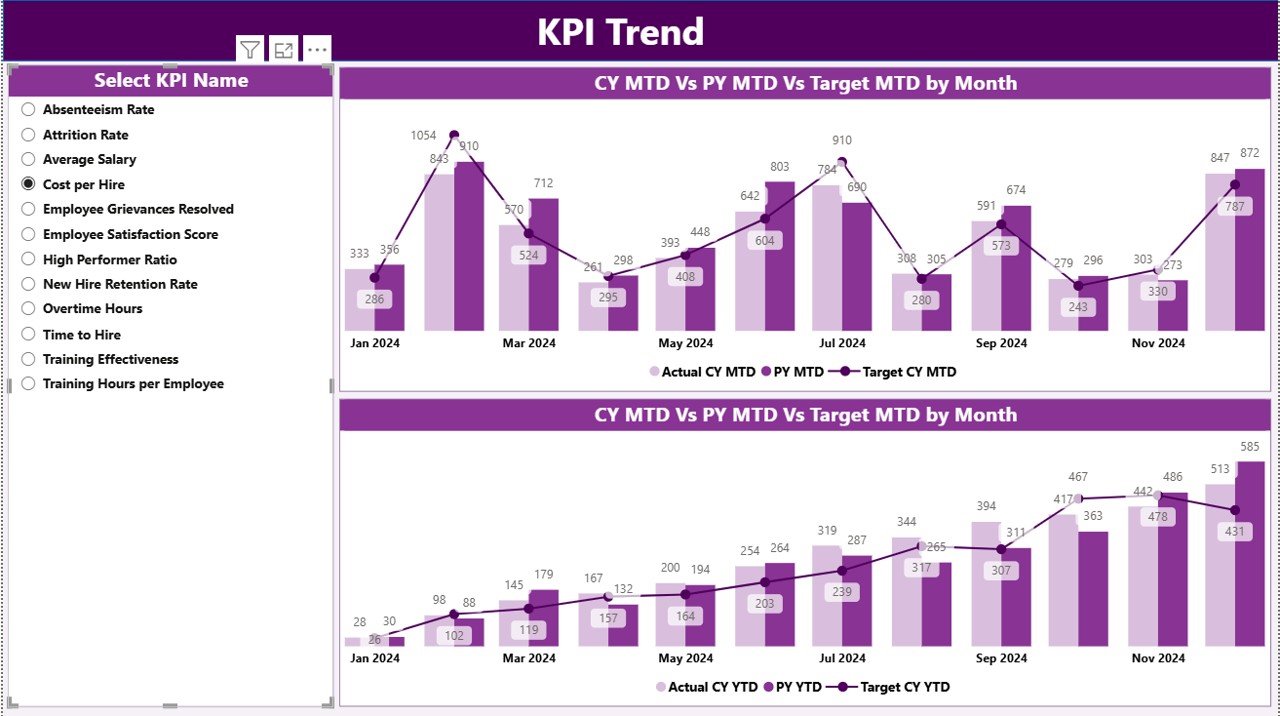
📈 2. KPI Trend Page – MTD & YTD Trend Analysis
This page allows you to analyze the movement of each KPI throughout the year.
Choose a KPI from the slicer and see:
-
📘 MTD Combo Chart – CY Actual, Target, Previous Year
-
📙 YTD Combo Chart – CY Actual, Target, Previous Year
It helps you track trends in:
-
Absenteeism
-
Hiring pipeline
-
Training hours
-
Salary cost
-
Engagement levels
This makes performance evaluation extremely easy.
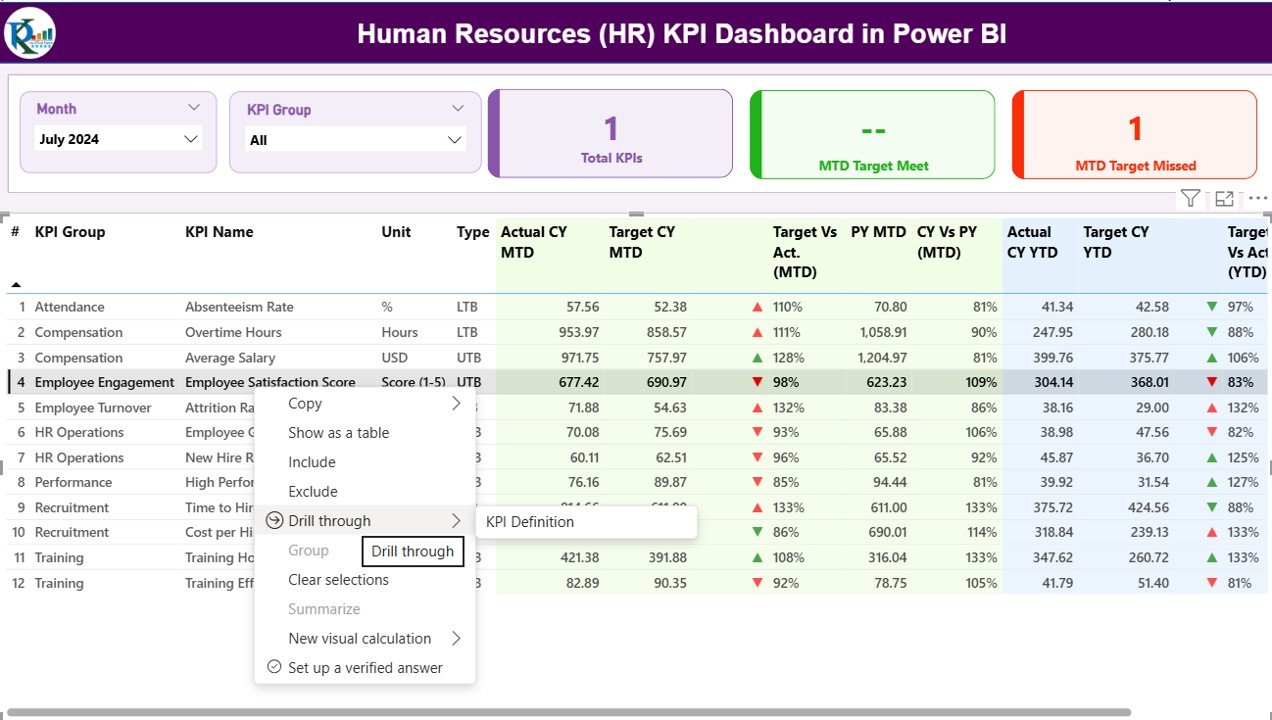
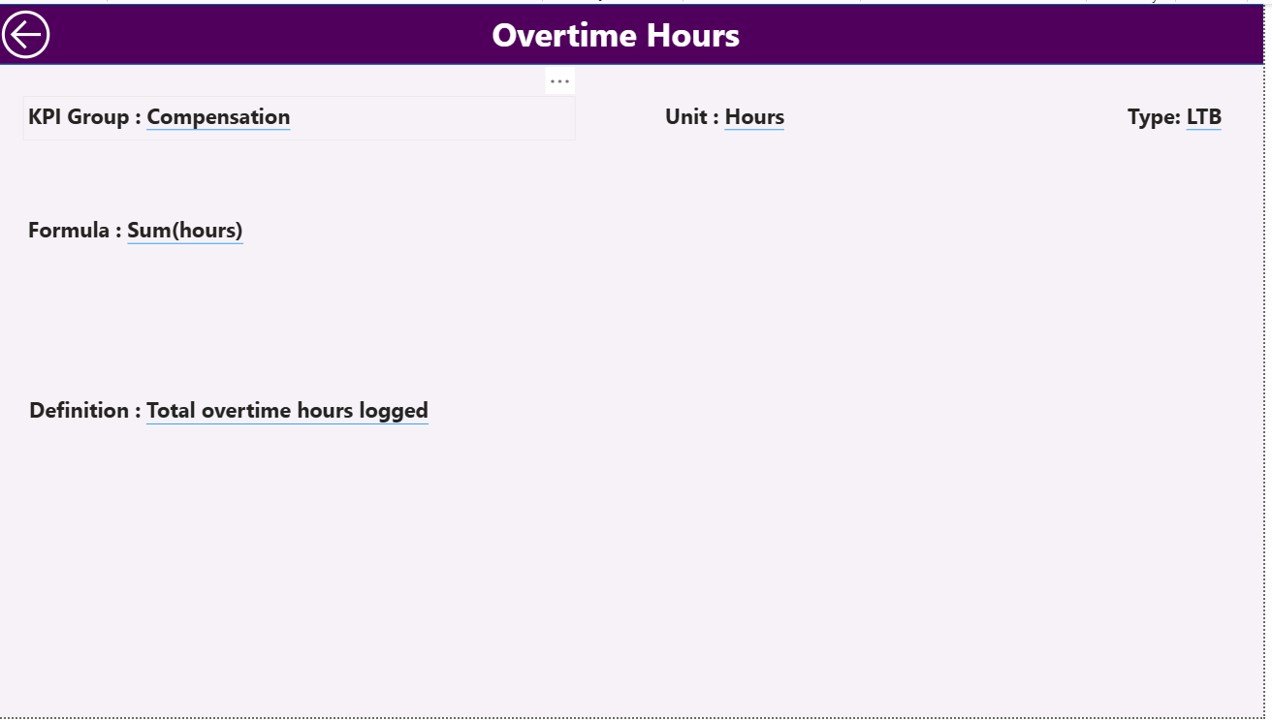
📑 3. KPI Definition Page – Formula & Meaning
This drill-through page helps you understand the logic behind each KPI.
It includes:
-
KPI Number
-
KPI Group
-
KPI Name
-
Unit
-
Formula
-
Definition
-
Type (UTB/LTB)
A Back button allows smooth navigation back to the main dashboard.
📦 What’s Inside the Human Resources (HR) KPI Dashboard in Power BI
You will receive:
-
✔️ Power BI Dashboard (.PBIX File)
-
✔️ Excel Data File with 3 sheets (Input_Actual, Input_Target, KPI Definition)
-
✔️ Structured KPI Definition Table
-
✔️ Complete MTD & YTD Performance System
-
✔️ Dynamic Slicers for Month & KPI Group
-
✔️ Professional Trend Analysis Visuals
-
✔️ Smart Conditional Icons (▲/▼) for performance
Everything is organized so HR teams can update data easily and get instant insights.
🛠️ How to Use the Human Resources (HR) KPI Dashboard in Power BI
-
Open the Excel Source File
Update monthly values in the Input_Actual sheet. -
Review Targets in the Input_Target Sheet
Add or revise target KPIs anytime during the year. -
Maintain Definitions in KPI Definition Sheet
Keep KPIs clean, unique, and well-defined. -
Refresh Power BI Dashboard
Simply click Refresh in Power BI and the entire dashboard updates. -
Use Slicers for Deep Insights
Select Month or KPI Group to analyze performance instantly. -
Analyze Trends Page
Track your workforce movement month by month. -
Use Drill-Through Page
Click any KPI to see its formula and meaning. -
Present Insights to Management
Export visuals or publish the dashboard to Power BI Service.
This tool makes HR reporting smarter and faster.
🎯 Who Can Benefit from This Human Resources (HR) KPI Dashboard in Power BI
This dashboard is perfect for:
👩💼 HR Managers
Monitor hiring, retention, absenteeism, and engagement at a glance.
👨💻 HR Analysts
Analyze data trends, performance movement, and workforce insights.
📊 HR Directors & CHROs
Review high-level summary and take strategic decisions.
🏢 Small & Medium Businesses
Use it as a ready-to-use HR reporting system without hiring data experts.
🧑🏫 Learning & Development Teams
Track training hours, certification rates, and program performance.
💼 Recruitment Teams
Measure time-to-hire, pipeline strength, and offer acceptance rate.
🧾 Payroll & Compliance Teams
Track payroll accuracy, overtime costs, and compliance KPIs easily.
This dashboard is designed for every HR team looking for accuracy, clarity, and automation.
Click here to read the Detailed blog post
Watch the step-by-step video tutorial:


Reviews
There are no reviews yet.