In the maritime world, every decision—from vessel routing to fuel planning—affects profitability and efficiency. The Marine & Ports Dashboard in Excel gives port authorities, shipping companies, and logistics managers the power to make those decisions based on real data, not guesswork.
Built entirely in Microsoft Excel, this ready-to-use analytical tool turns raw marine data into actionable insights. With interactive KPI cards, pivot-based charts, and intuitive slicers, you can monitor costs, revenue, fuel usage, and satisfaction levels—all in one central dashboard.
Whether you manage a single port or a global fleet, this template helps you improve operations, control fuel expenditure, and maximize profit margins—without relying on expensive BI software.
⚙️ Key Features of the Marine & Ports Dashboard in Excel
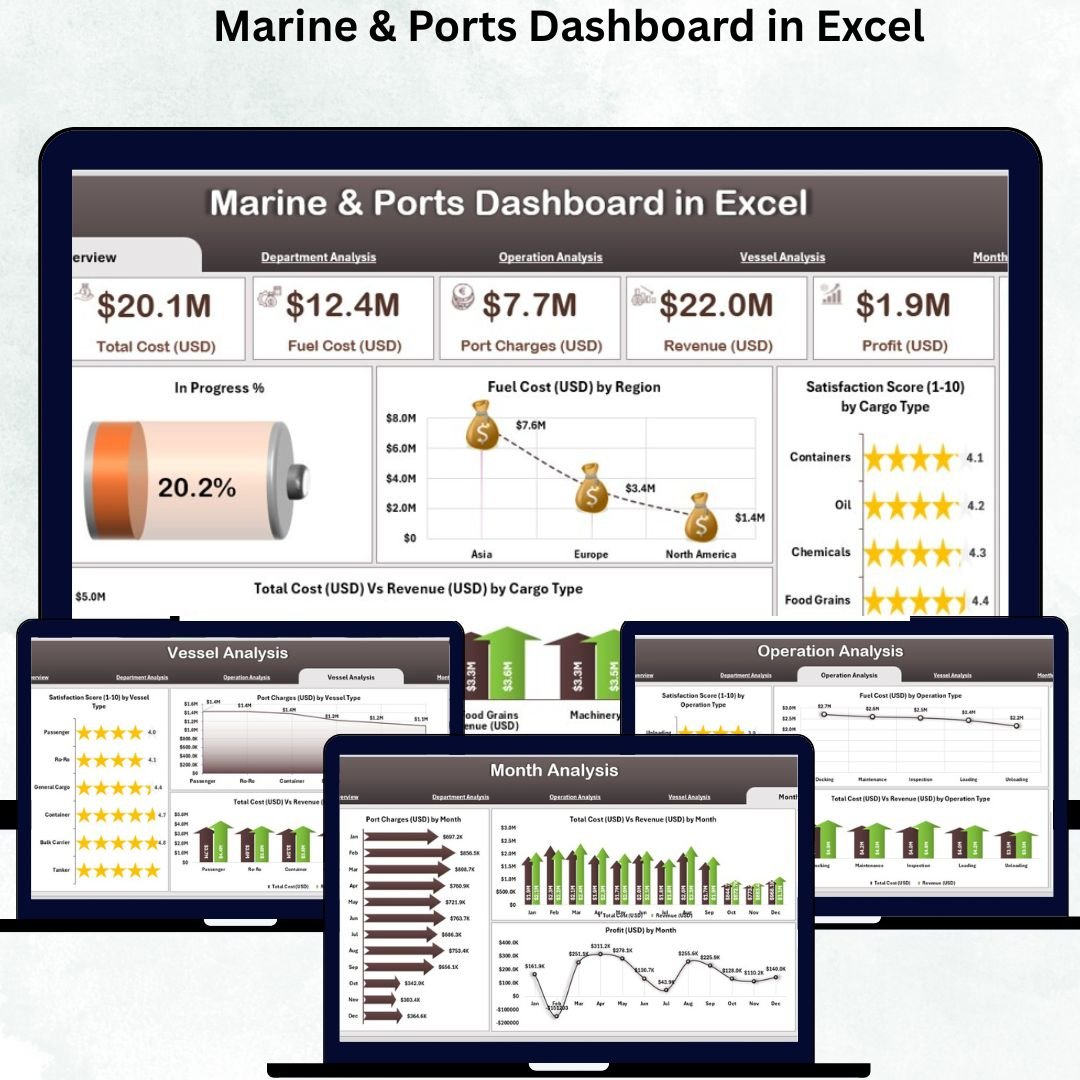
🧭 1️⃣ Overview Page – Your Command Center
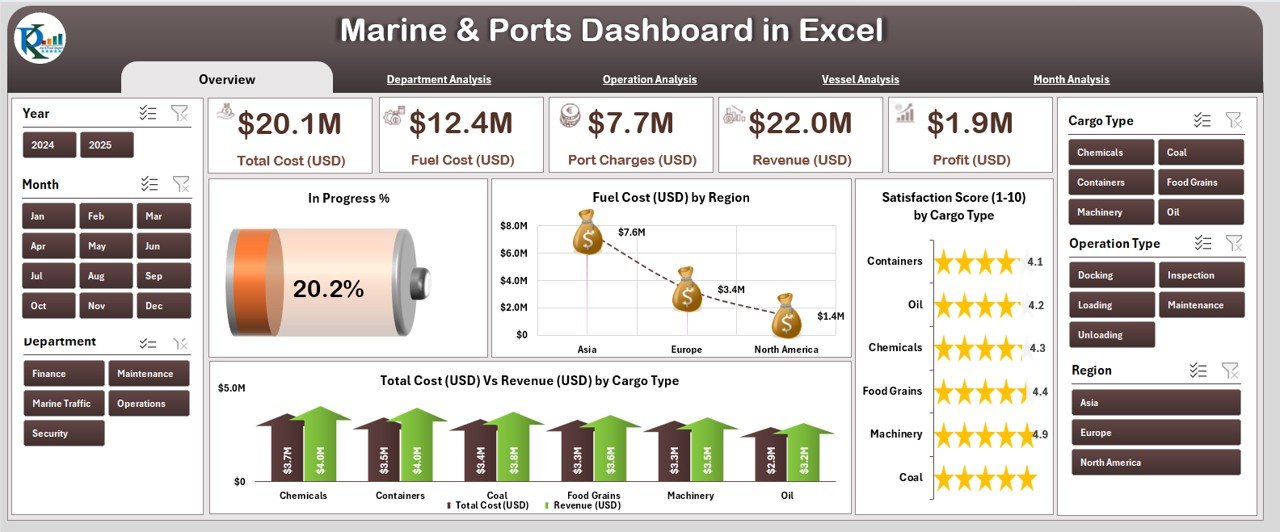
Instantly visualize high-level KPIs and key performance trends.
-
5 KPI Cards: Progress %, Total Revenue (USD), Total Cost (USD), Profit (USD), Fuel Cost (USD).
-
4 Charts: Progress %, Fuel Cost by Region, Satisfaction Score (1–10) by Cargo Type, Total Cost vs Revenue by Cargo Type.
💡 Quickly identify profitable routes, cost-intensive regions, and satisfaction trends across cargo categories.
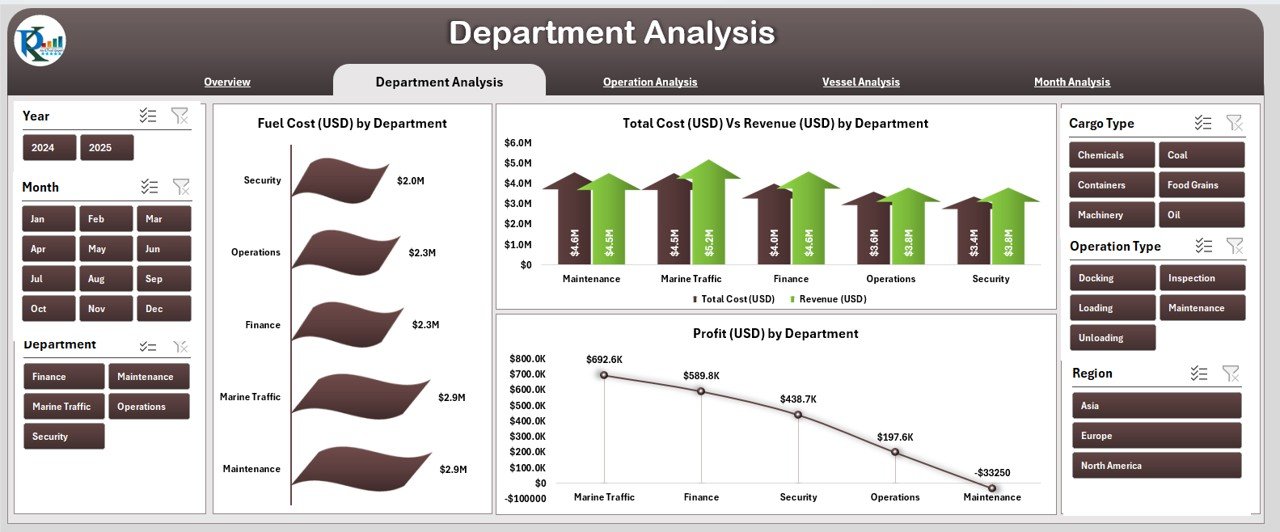
🧱 2️⃣ Department Analysis Page – Cost & Profit Distribution
Understand departmental efficiency at a glance.
-
Charts: Fuel Cost by Department | Total Cost vs Revenue by Department | Profit by Department.
📊 Pinpoint departments with high costs or low profit margins to drive better resource allocation.
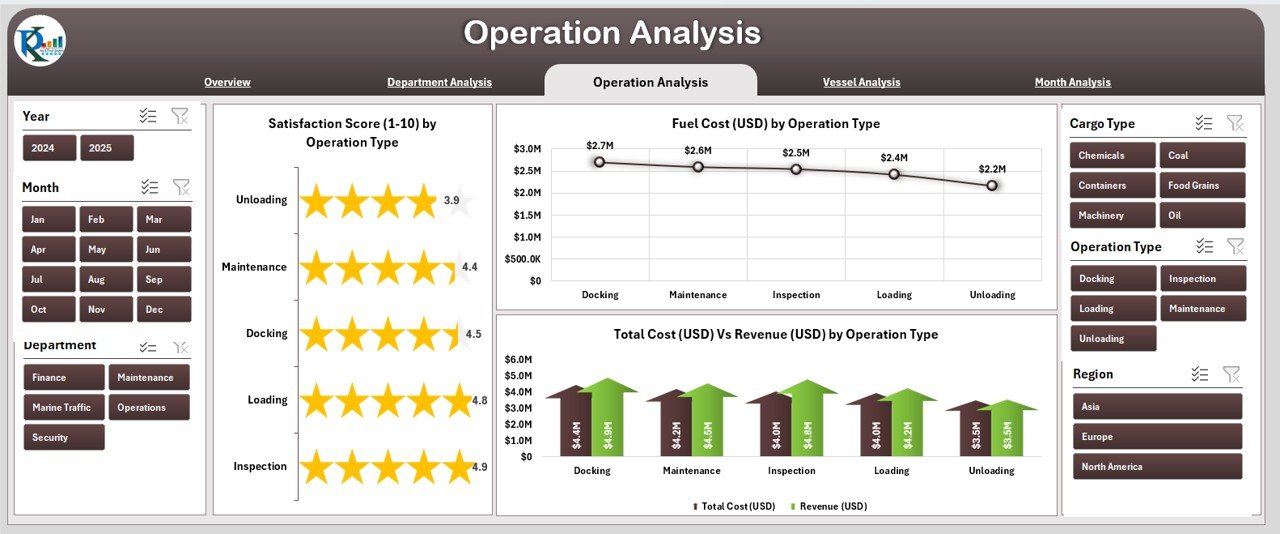
⚙️ 3️⃣ Operation Analysis Page – Operational Performance Insights
Evaluate the impact of each operation type on revenue and cost.
-
Charts: Fuel Cost by Operation Type | Total Cost vs Revenue by Operation Type.
🚢 Optimize routes and reduce inefficiencies through operation-specific cost analysis.
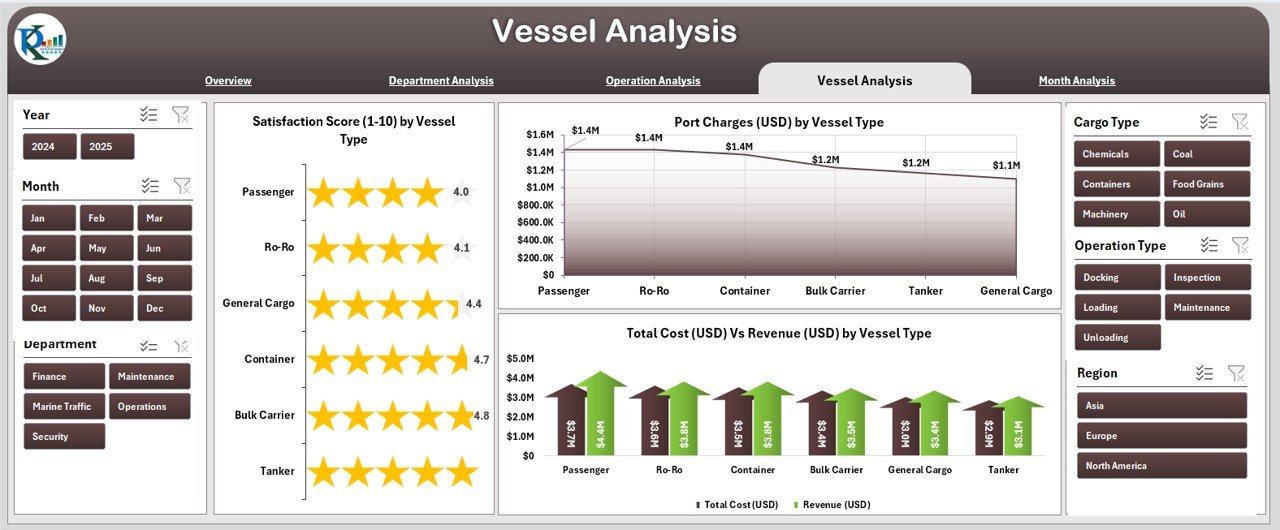
⛴️ 4️⃣ Vessel Analysis Page – Fleet Performance Tracking
Monitor each vessel’s financial and service performance.
-
Charts: Satisfaction Score (1–10) by Vessel Type | Total Cost vs Revenue by Vessel Type | Profit Change by Vessel Type.
⚓ Identify the most profitable vessels, plan maintenance schedules, and improve fleet utilization.
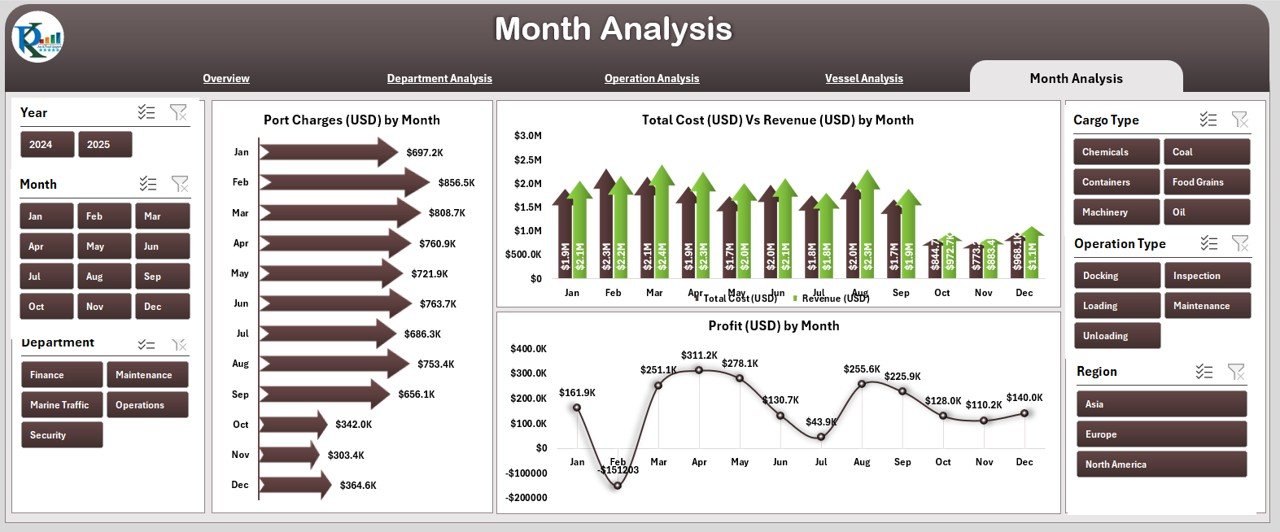
📅 5️⃣ Month Analysis Page – Seasonal Performance Trends
Analyze time-based trends for revenue, cost, and profit.
-
Charts: Profit Change by Month | Total Cost vs Revenue by Month | Profit by Month.
📈 Detect seasonal fluctuations, plan budgets, and forecast future revenue.
📋 Support & Data Sheets
-
Data Sheet: Holds all raw records—update weekly or monthly for real-time analytics.
-
Support Sheet: Predefined lists and lookups for departments, regions, and cargo types.
🌊 Why Use This Dashboard
✅ Centralized Visibility: View operations, costs, and revenue in one place.
✅ Financial Control: Compare actual vs target KPIs to track profitability.
✅ Operational Efficiency: Identify fuel-heavy routes and reduce wastage.
✅ Data Transparency: Visual charts make team reviews faster and clearer.
✅ Time Savings: No manual reporting — all metrics update automatically.
✅ Sustainability Tracking: Use fuel metrics for environmental reporting.
⚓ Advantages of Using Excel for Marine Analytics
-
📊 Familiar interface accessible to everyone.
-
🧩 No extra software or license cost.
-
🧮 Supports custom formulas and what-if analysis.
-
🌐 Integrates easily with ERP systems and CSV files.
-
🔐 Keeps data local for confidentiality and security.
🧭 How to Use the Dashboard
1️⃣ Enter monthly records in the Data Sheet (revenue, cost, fuel use, satisfaction).
2️⃣ Click Data → Refresh All to update KPIs and charts.
3️⃣ Navigate through the Page Navigator to analyze Overview, Department, or Vessel pages.
4️⃣ Use filters for Month, Region, or Department to drill down into specific data.
5️⃣ Share your dashboard via email or cloud for collaborative review.
⏱️ Within minutes, you’ll have a presentation-ready marine performance report.
💼 Who Can Benefit
-
⚓ Port Authorities & Maritime Regulators
-
🚢 Shipping Companies & Fleet Managers
-
💰 Finance & Budget Teams
-
🧭 Operations & Logistics Departments
-
📈 Marine Consultants and Analysts
💡 Best Practices
-
Maintain accurate data entries for reliable visuals.
-
Refresh weekly for updated KPI results.
-
Add target columns to track performance gaps.
-
Keep dashboard design simple and clean.
-
Protect sheets before sharing to avoid accidental edits.
🔗 Read the Detailed Blog Post on NextGenTemplates.com
📺 Watch Video Tutorial on YouTube
👉 YouTube.com/@PKAnExcelExpert


Reviews
There are no reviews yet.