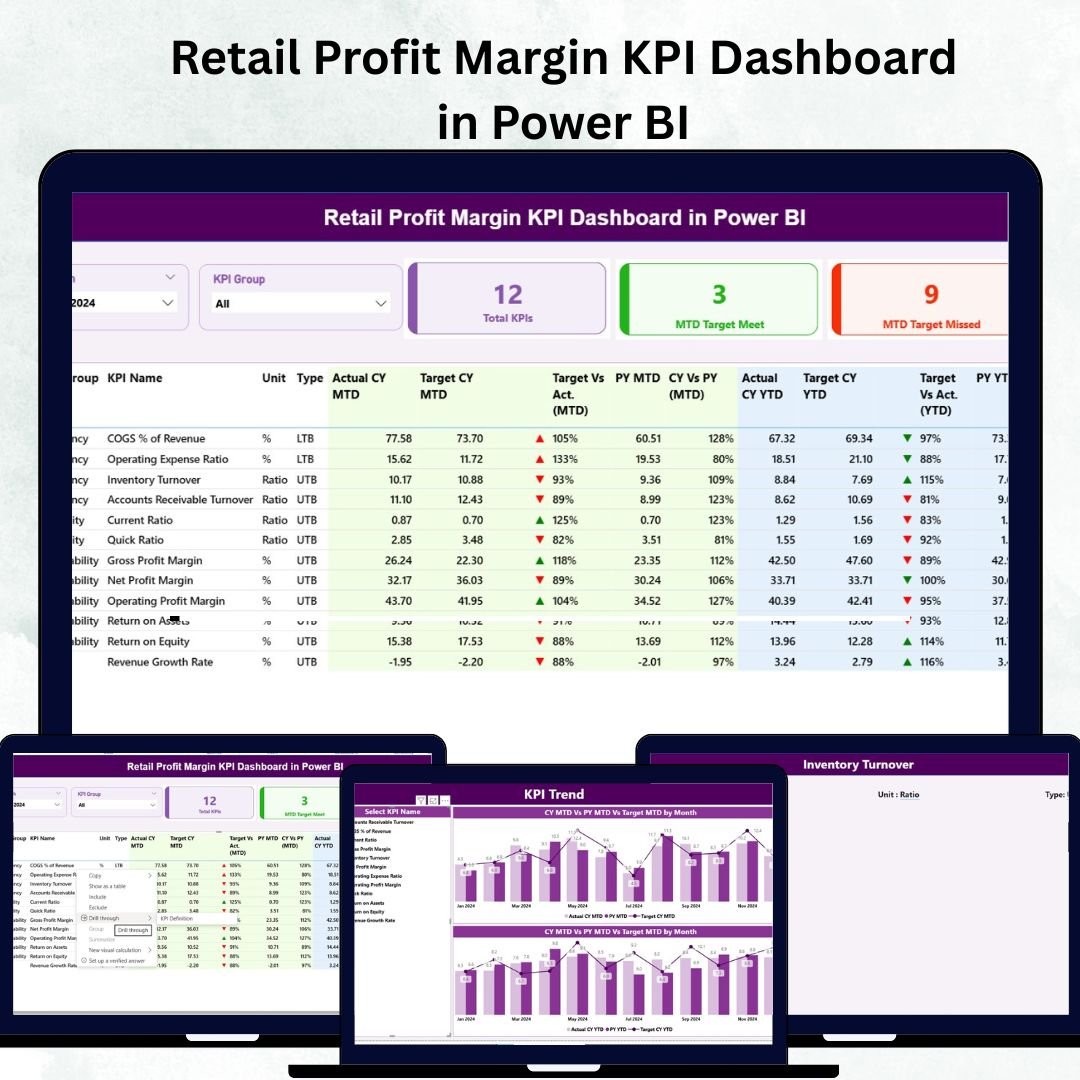
In the fast-paced world of retail, profitability is the heartbeat of success. 📊 Yet many businesses still rely on scattered spreadsheets and static reports that make it difficult to identify where profits are gained or lost. The Retail Profit Margin KPI Dashboard in Power BI changes that — offering a sleek, modern, and data-driven solution for retailers who want to track, visualize, and improve profit margins with precision and ease.Retail Profit Margin KPI Dashboard in Power BI
This ready-to-use Power BI dashboard transforms raw Excel data into interactive visuals that tell the story behind every dollar earned. From Gross Profit Margin (%) to Operating Expenses, this dashboard empowers you to analyze performance trends, detect inefficiencies, and make smart, data-backed decisions in seconds.
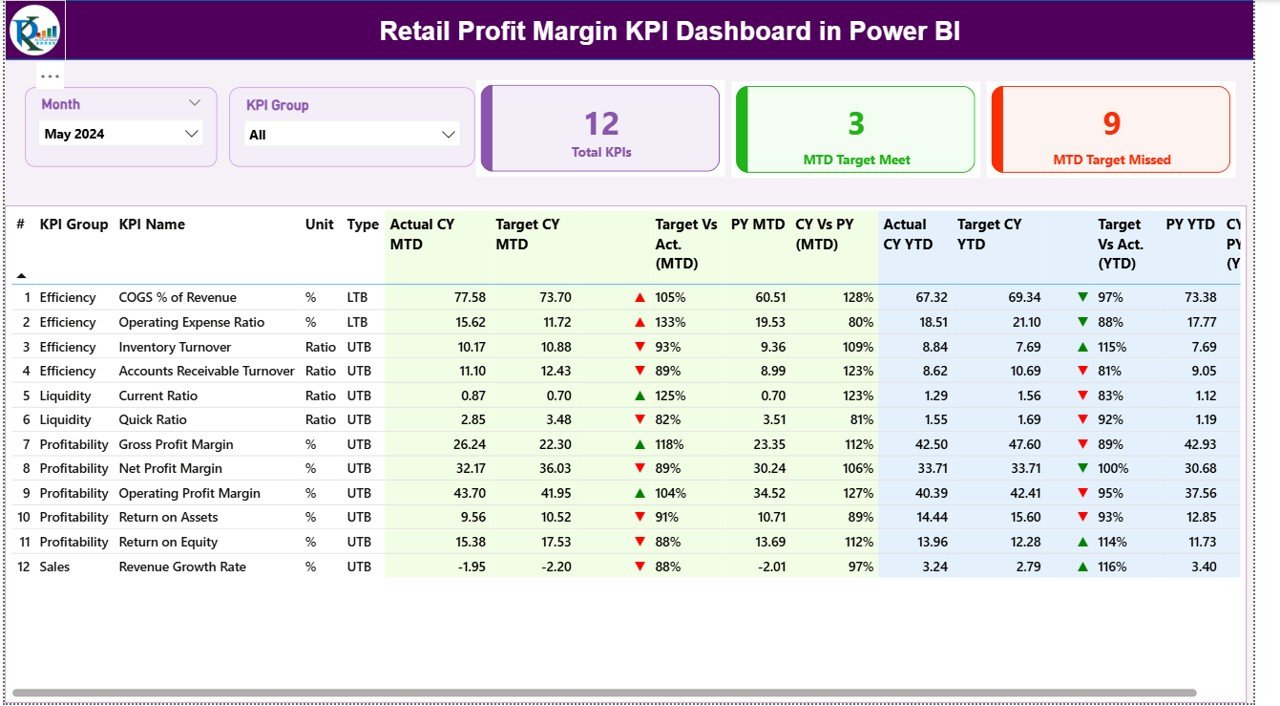
💡 Key Features of the Retail Profit Margin KPI Dashboard in Power BI
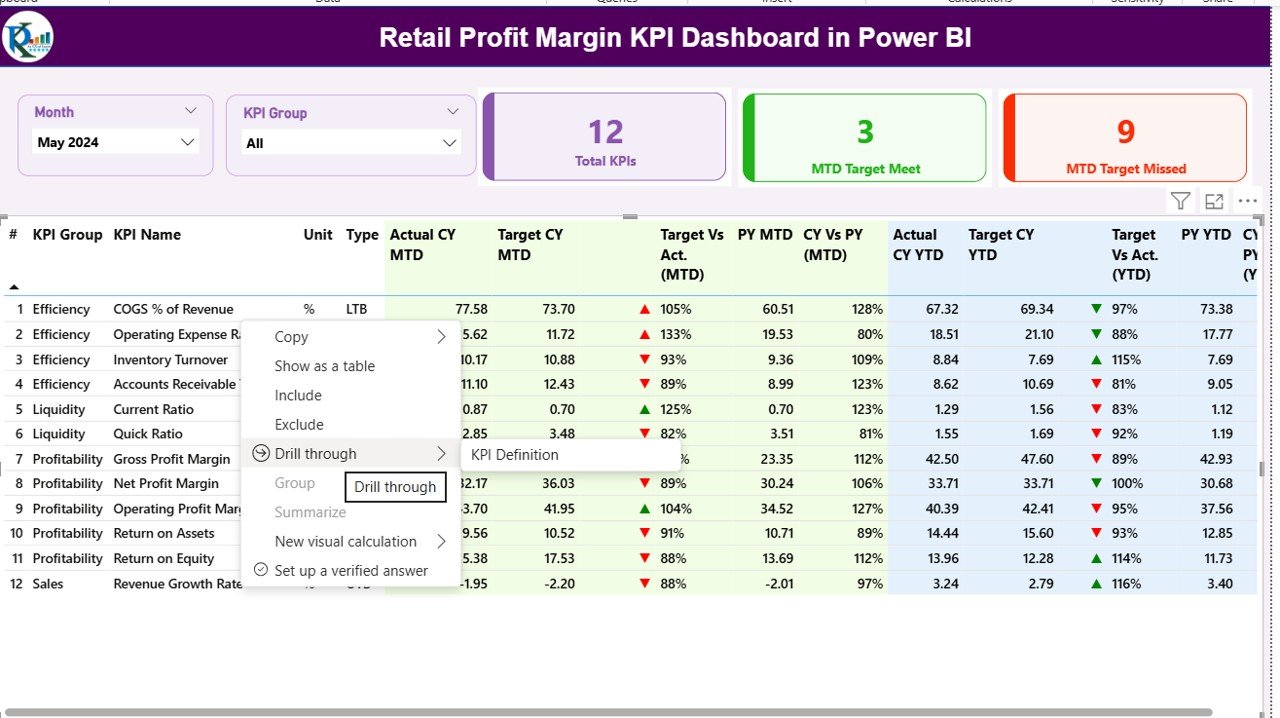
✨ Interactive Summary Page: Instantly monitor total KPIs, MTD target achievements, and missed targets with dynamic slicers and colorful visuals.
📆 Month & KPI Group Filters: Quickly switch between time periods and categories to zero in on specific profit trends.
📈 Detailed KPI Table: View metrics like Gross Profit Margin (%), COGS, Revenue, and Operating Expenses — all color-coded with red 🔻 or green 🔺 indicators for quick interpretation.
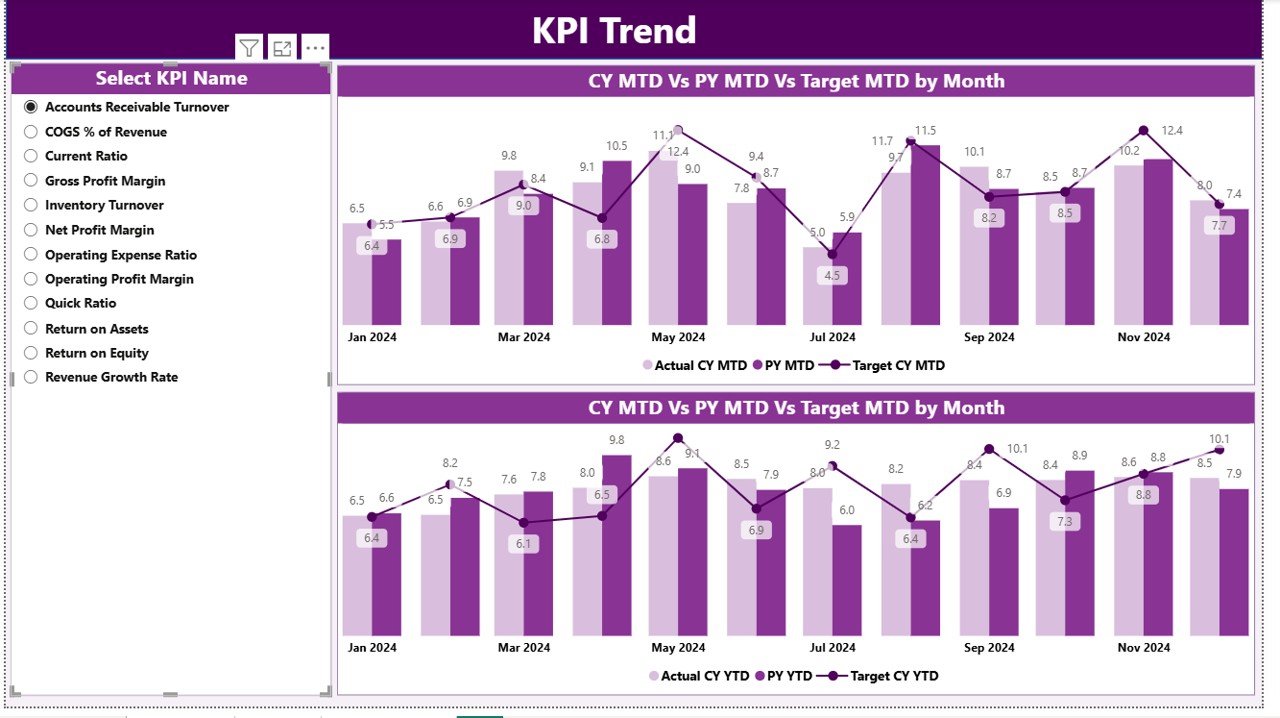
📊 KPI Trend Analysis: Understand how each KPI evolves month by month or year by year with combo charts showing actual vs. target performance.
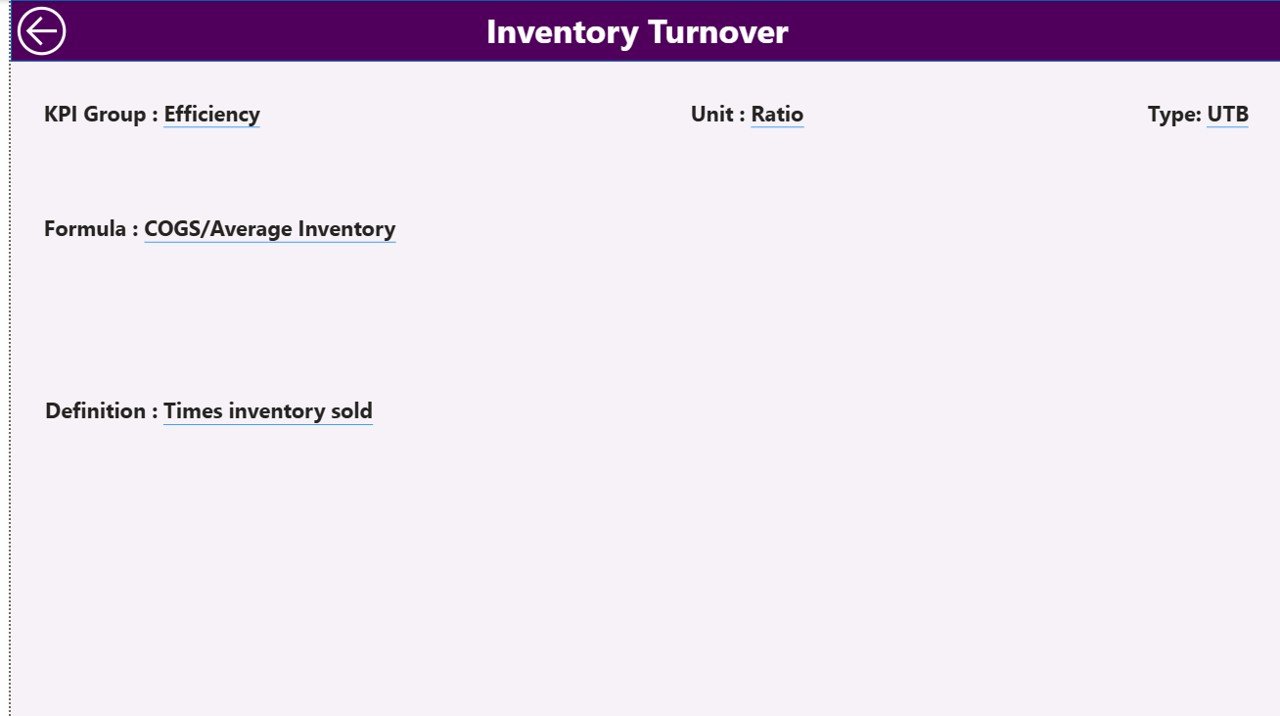
📘 KPI Definition Page: Drill through to see the formula, unit, and type (UTB/LTB) of any KPI for transparent calculations.
🔄 Excel Integration: Simply update Excel sheets for Actuals, Targets, and Definitions — the Power BI dashboard refreshes automatically.
⚡ Automated Insights: No more manual reports. Refresh data with one click to get real-time insights.
🔍 Comparative Analysis: Evaluate MTD vs. YTD or CY vs. PY performance side-by-side for smarter strategy planning.
📦 What’s Inside the Retail Profit Margin KPI Dashboard in Power BI
When you download this product, you get everything you need to start analyzing your retail profit data immediately:
1️⃣ Power BI File (.pbix) — prebuilt with all visuals, slicers, and KPI measures.
2️⃣ Excel Data Model (.xlsx) — includes three sheets:Retail Profit Margin KPI Dashboard in Power BI
-
Input_Actual: Enter MTD and YTD actual performance values.
-
Input_Target: Define monthly and yearly profit targets.
-
KPI Definition: Store formulas, units, and type (UTB/LTB).
3️⃣ Comprehensive KPI Structure — supporting metrics like:-
Gross Profit Margin (%)
-
Net Profit Margin (%)
-
Operating Profit Margin (%)
-
Total Revenue & COGS
-
Profit Growth vs. Targets
4️⃣ User Guide (PDF) — step-by-step instructions for setup and refresh.
-
Everything is plug-and-play — no coding or complex setup required. Just update your Excel sheets, open the dashboard in Power BI, and enjoy instant insights.
⚙️ How to Use the Retail Profit Margin KPI Dashboard in Power BI
1️⃣ Update Excel Data: Fill in the Actual, Target, and KPI Definition sheets with your current data.
2️⃣ Open Power BI Desktop: Connect the Excel file or refresh existing data connections.
3️⃣ Explore Pages:
-
Summary Page — overview of all KPIs with instant visual indicators.
-
KPI Trend Page — track month-over-month and year-over-year progress.
-
KPI Definition Page — understand the logic behind every KPI.
4️⃣ Use Slicers: Filter results by month or KPI group for deeper analysis.
5️⃣ Interpret Visuals: Green arrows show target met ✅; red arrows flag underperformance 🚫.
This intuitive workflow helps retail managers and analysts make data-driven decisions without spending hours building reports.
👥 Who Can Benefit from This Retail Profit Margin KPI Dashboard in Power BI
🏪 Retail Store Owners: Understand profit trends across departments and locations.
🛍️ E-commerce Managers: Compare online vs. offline performance effortlessly.
📦 Category Managers: Track margins by product category and supplier.
💼 Finance Teams: Monitor COGS, operating expenses, and net profit margin in one view.
📊 Executives & Analysts: Get a 360° view of profitability to drive long-term growth strategies.
Whether you run a boutique shop or a nationwide retail chain, this dashboard empowers you to uncover profit opportunities and strengthen decision-making.
🚀 Why Choose This Dashboard?
This Power BI template isn’t just about numbers — it’s about clarity, speed, and control. You get a ready-to-use, interactive, and scalable system that grows with your business. Say goodbye to data chaos and hello to real-time profit intelligence.
Click here to read the Detailed blog post
Watch the step-by-step video tutorial:
Visit our YouTube channel to learn step-by-step video tutorials 👉 YouTube.com/@PKAnExcelExpert


Reviews
There are no reviews yet.