

The Telecommunications KPI Dashboard in Excel is a powerful analytical tool designed for telecom companies to track, measure, and optimize key performance indicators (KPIs). With interactive dashboards, trend analysis, and detailed KPI definitions, this tool helps telecom professionals monitor network performance, customer satisfaction, and financial metrics—all in one place.
Key Features
1. Home Sheet

The Home Sheet serves as a centralized hub with quick links to all sections of the dashboard. It ensures easy navigation and provides an intuitive layout for users to access relevant data efficiently.
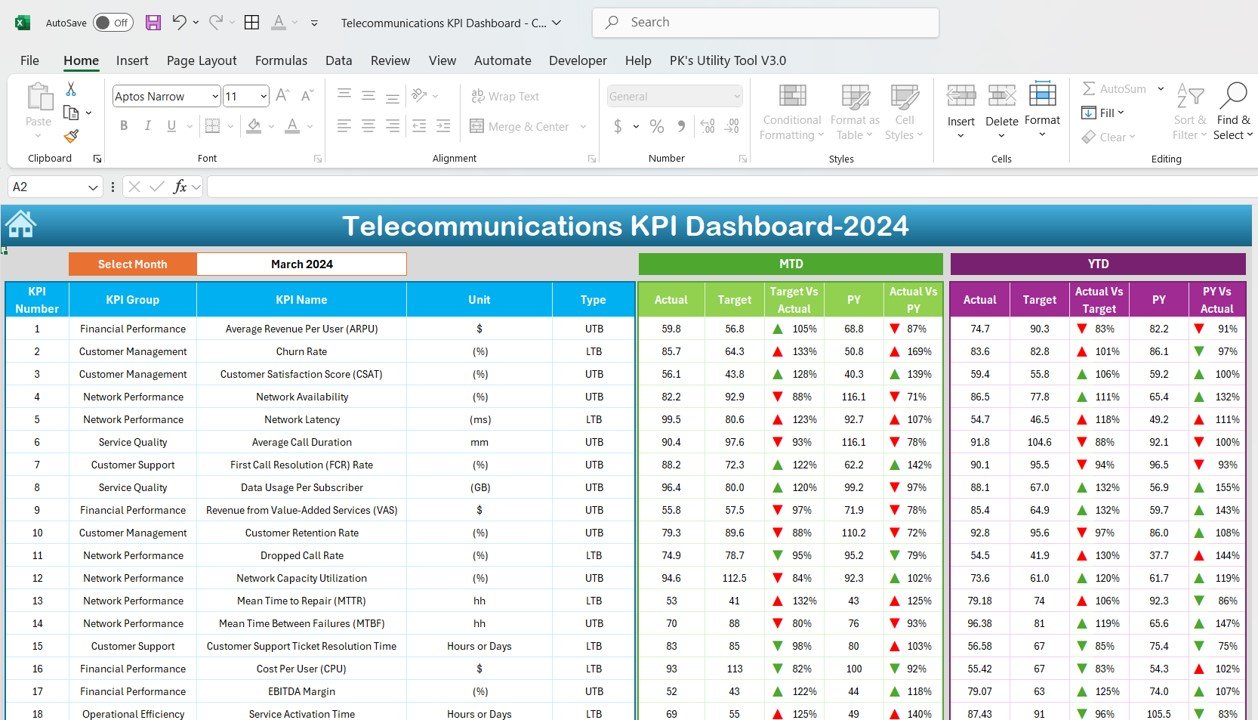
2. Telecommunications KPI Dashboard
- The main dashboard offers a real-time performance overview.
- Displays Month-to-Date (MTD) and Year-to-Date (YTD) data.
- Features color-coded trend indicators (up/down arrows) to instantly highlight performance variations.
- Allows users to select a specific month for detailed insights.
3. KPI Trend Sheet
- Tracks KPI performance trends over time.
- Includes interactive graphs and charts to visualize network reliability, customer satisfaction, and revenue trends.
- Helps identify areas needing improvement and ensures continuous monitoring.
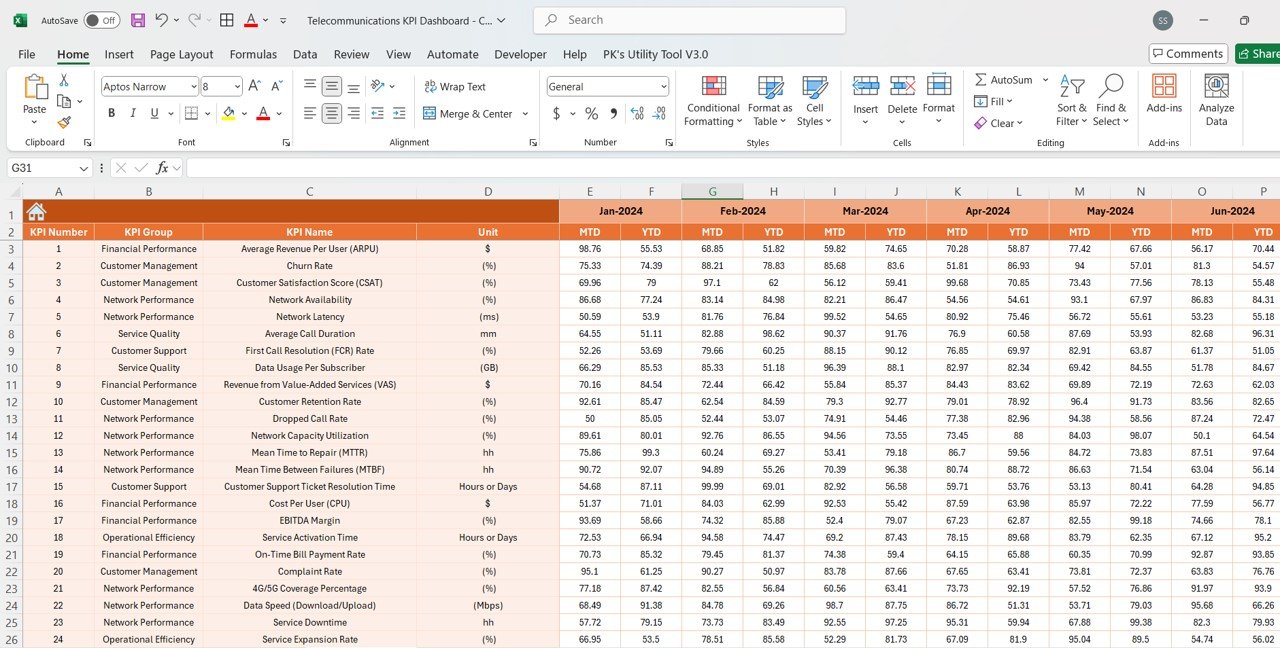
4. Actual Numbers Sheet
- Input real-time data for each KPI to measure actual performance.
- Monthly and yearly data columns for detailed MTD vs. YTD comparisons.
- Automatically updates the dashboard for accurate decision-making.
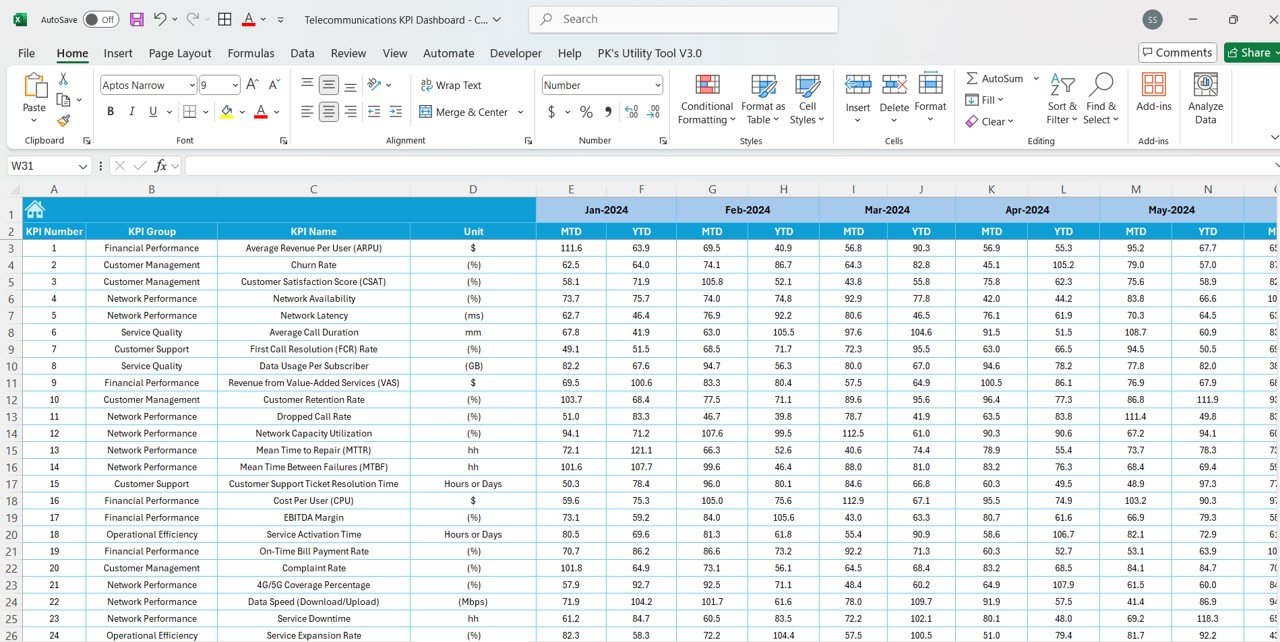
5. Target Sheet
- Set monthly and yearly targets for each KPI.
- Compare actual performance against predefined goals.
- Helps align team objectives with organizational goals.
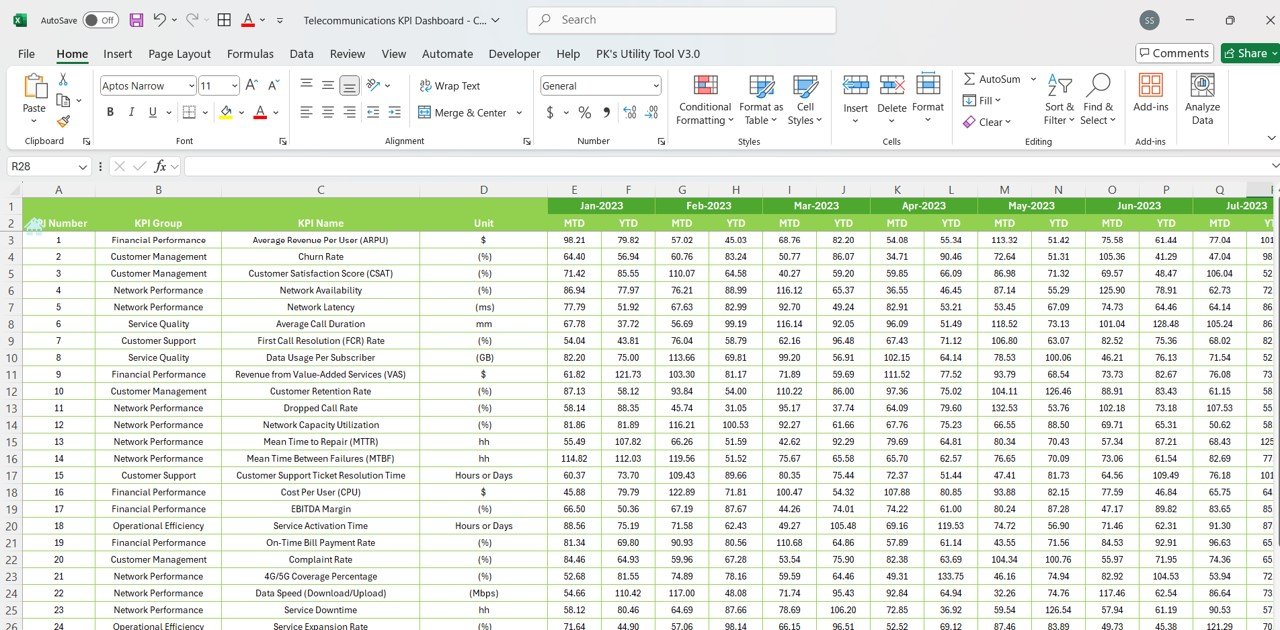
6. Previous Year Numbers Sheet
- Enables year-over-year performance comparisons.
- Helps businesses analyze past trends to make informed strategic decisions.
- Facilitates continuous improvement by understanding historical performance.
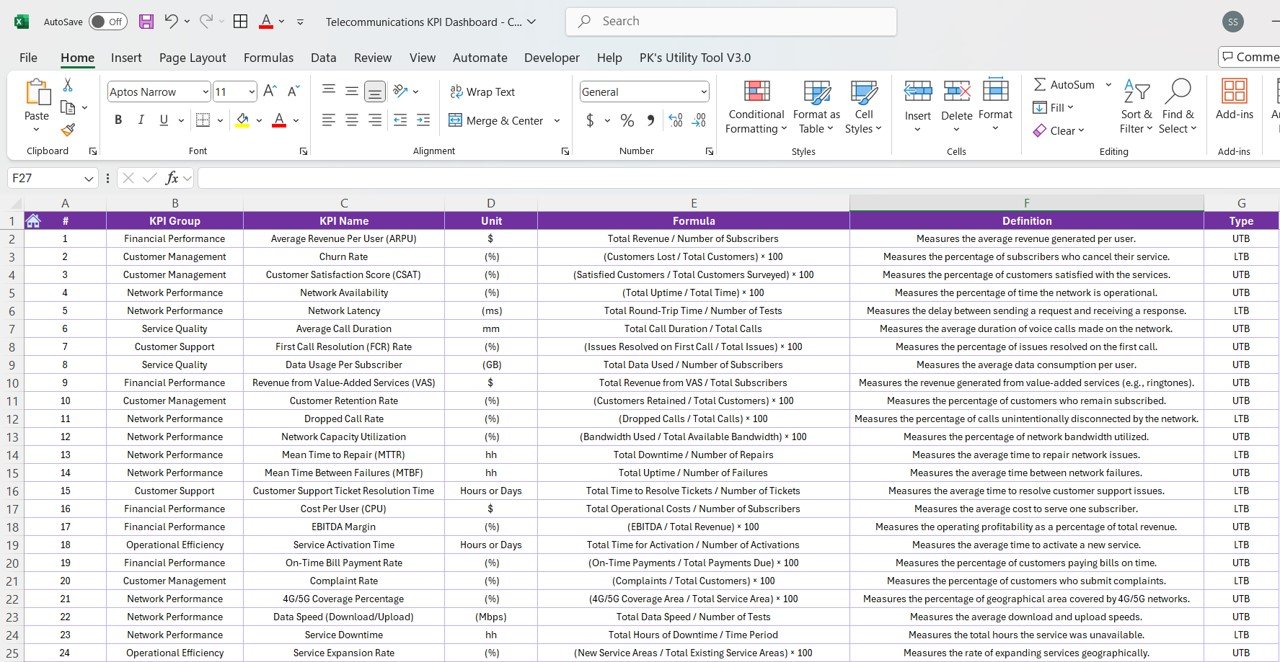
7. KPI Definition Sheet
- Comprehensive list of all KPIs with definitions, formulas, and measurement units.
- Ensures consistent tracking and reporting across departments.
- Provides clarity on how each KPI impacts overall business performance.
Who Can Use This Dashboard?
This Telecommunications KPI Dashboard in Excel is ideal for:
- Telecom Service Providers – Monitor network uptime, customer churn, and service efficiency.
- Network Operators – Track latency, capacity utilization, and infrastructure efficiency.
- Customer Support Teams – Improve customer satisfaction (CSAT), first-call resolution (FCR), and response times.
- Financial Analysts – Evaluate revenue per user (ARPU), EBITDA margins, and service profitability.
- Strategic Managers – Drive business growth with data-backed decisions.
Why Choose This Dashboard?
✔ Fully Automated – No manual calculations required. Enter data, and get insights instantly. ✔ User-Friendly – Designed for professionals with or without advanced Excel skills. ✔ Customizable – Modify and add KPIs based on your business needs. ✔ One-Time Purchase – No recurring fees. Get lifetime access to the tool. ✔ Instant Download – Access the file immediately after purchase.
What’s Included?
✅ Excel File with Full Functionality ✅ Step-by-Step User Guide ✅ Interactive Dashboard with Charts & Tables ✅ Pre-Defined KPI Metrics & Formulas ✅ MTD vs. YTD Performance Comparisons
How to Use?
- Download the Excel file immediately after purchase.
- Enter actual data in the Actual Numbers Sheet.
- Set KPI targets in the Target Sheet.
- Analyze trends in the KPI Trend Sheet.
- Compare performance against previous years.
- Monitor real-time metrics in the Dashboard.
Click hare to read the Detailed blog post
Visit our YouTube channel to learn step-by-step video tutorials


Reviews
There are no reviews yet.