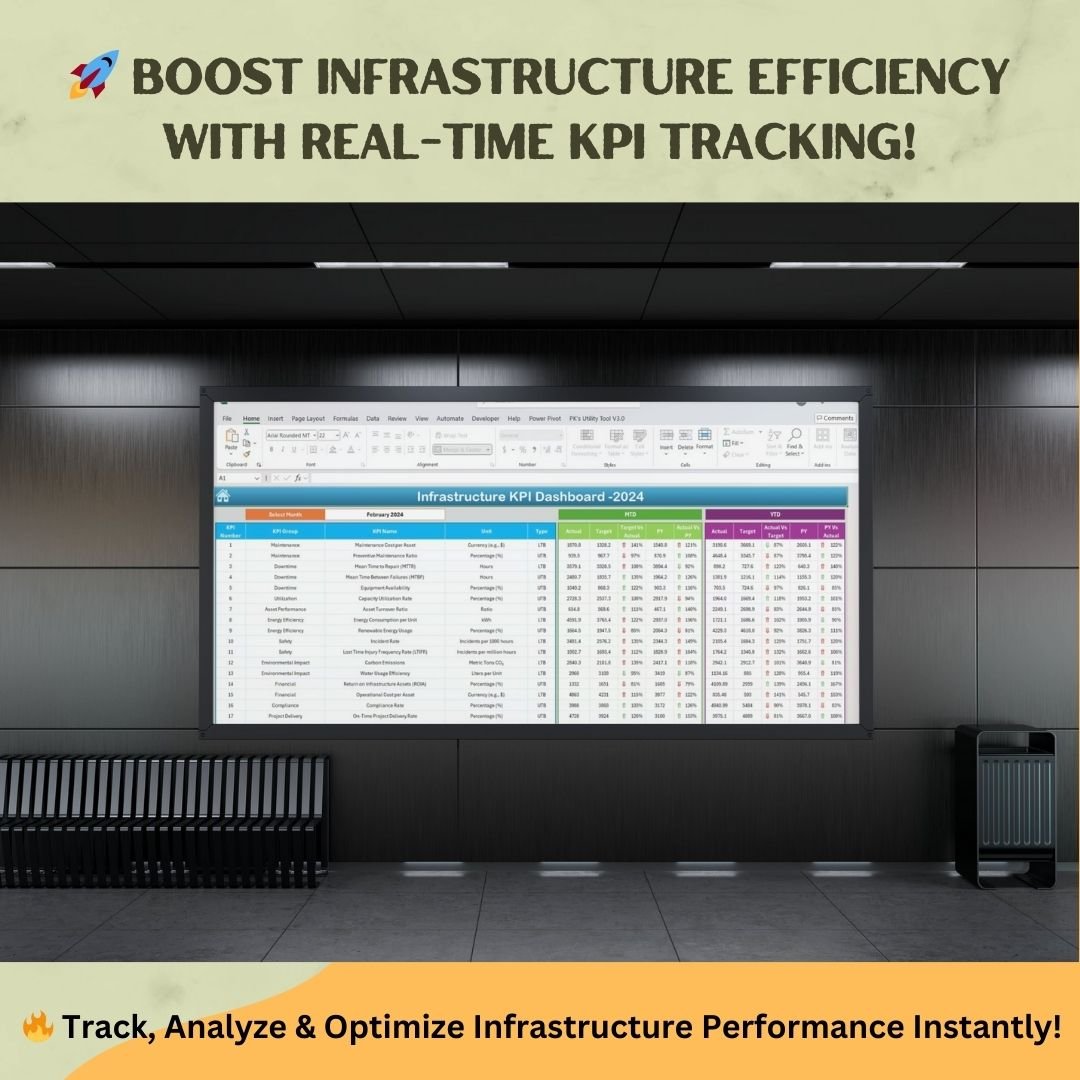

Managing infrastructure performance is essential for ensuring operational efficiency, asset utilization, and risk mitigation. The Infrastructure KPI Dashboard in Excel is a comprehensive solution designed to track key performance indicators (KPIs) in various aspects of infrastructure management, including maintenance, energy efficiency, financial performance, safety, and compliance.
This Excel-based Infrastructure KPI Dashboard simplifies data visualization and performance tracking, enabling real-time insights for better decision-making. Whether you’re monitoring maintenance costs, energy usage, or compliance metrics, this tool helps you stay on top of your infrastructure goals effortlessly.
🔹 Key Features of the Infrastructure KPI Dashboard in Excel
This ready-to-use dashboard is organized into seven essential worksheets, each designed for a specific function in tracking, analyzing, and managing KPIs efficiently.
1. Home Sheet – Quick Navigation

The Home Sheet serves as the starting point, offering easy access to all essential sections of the dashboard.
✔ Navigation Buttons: Quickly jump to KPI sheets with one click.
✔ User-Friendly Interface: Simple layout for seamless access to performance data.
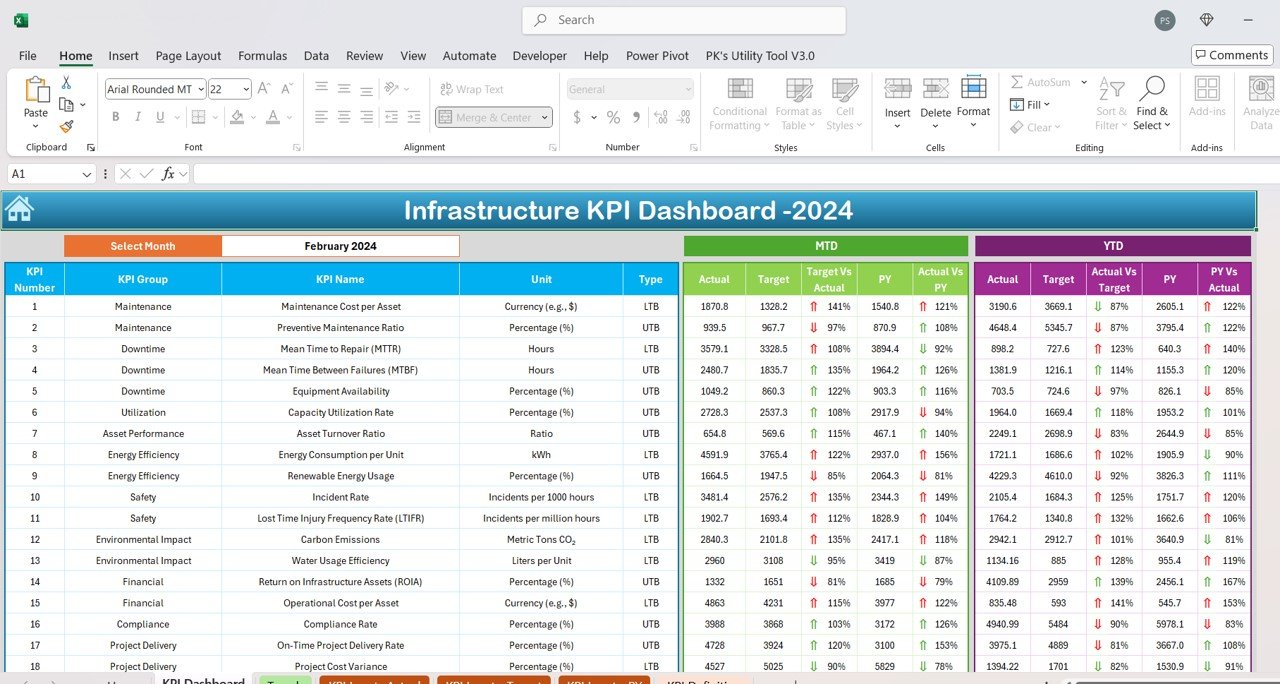
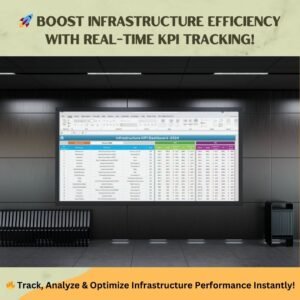
2. Dashboard Sheet – Real-Time KPI Insights
The Dashboard Sheet presents a consolidated view of your infrastructure KPIs, helping you make data-driven decisions.
✔ Dynamic Dropdown Selection: Choose a specific month to view performance updates.
✔ MTD & YTD Analysis: Track Month-to-Date (MTD) and Year-to-Date (YTD) KPI performance.
✔ Comparative Metrics:
- Actual vs. Target analysis to evaluate goal achievements.
- Current vs. Previous Year (PY) comparison to analyze yearly progress.
✔ Conditional Formatting: Up/down arrows highlight performance improvements or declines.
3. KPI Trend Sheet – In-Depth Performance Tracking
The KPI Trend Sheet enables historical trend analysis of each KPI to spot patterns and make proactive decisions.
✔ KPI Selection Dropdown: Choose a specific KPI to view trends over time.
✔ Detailed KPI Information:
- KPI Group & Type: Categorization for easy reference.
- Unit & Formula: Ensures consistency in KPI calculations.
- Definition: Helps teams understand KPI relevance.
✔ Visual Trend Charts: - MTD and YTD Trends displayed in interactive graphs.
- Performance shifts over time for effective strategy adjustments.
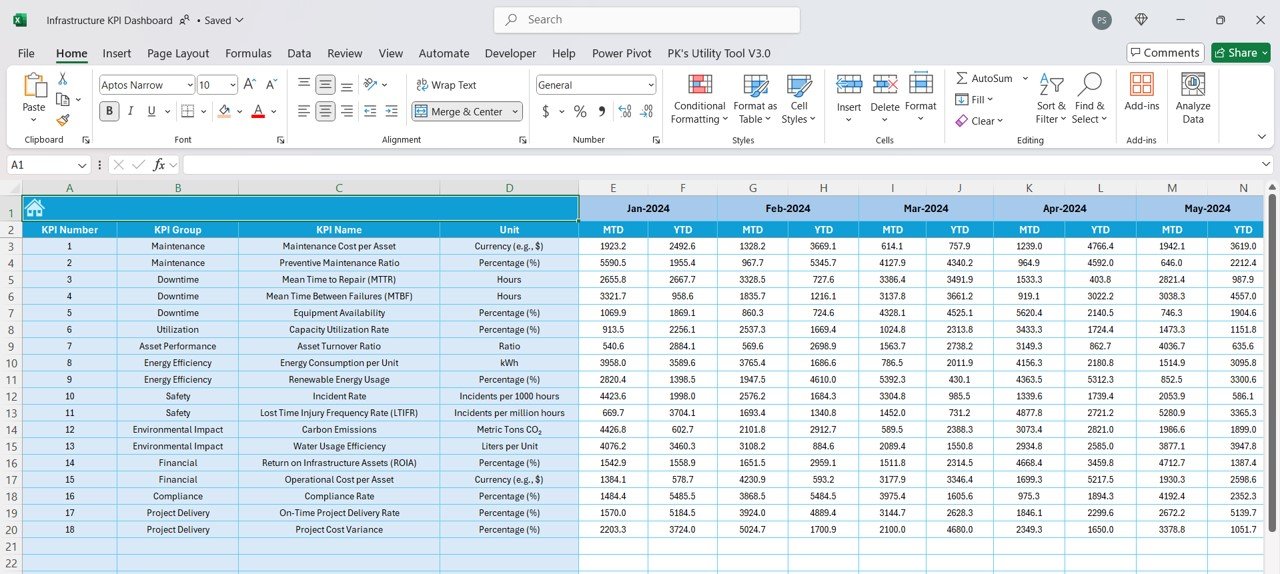
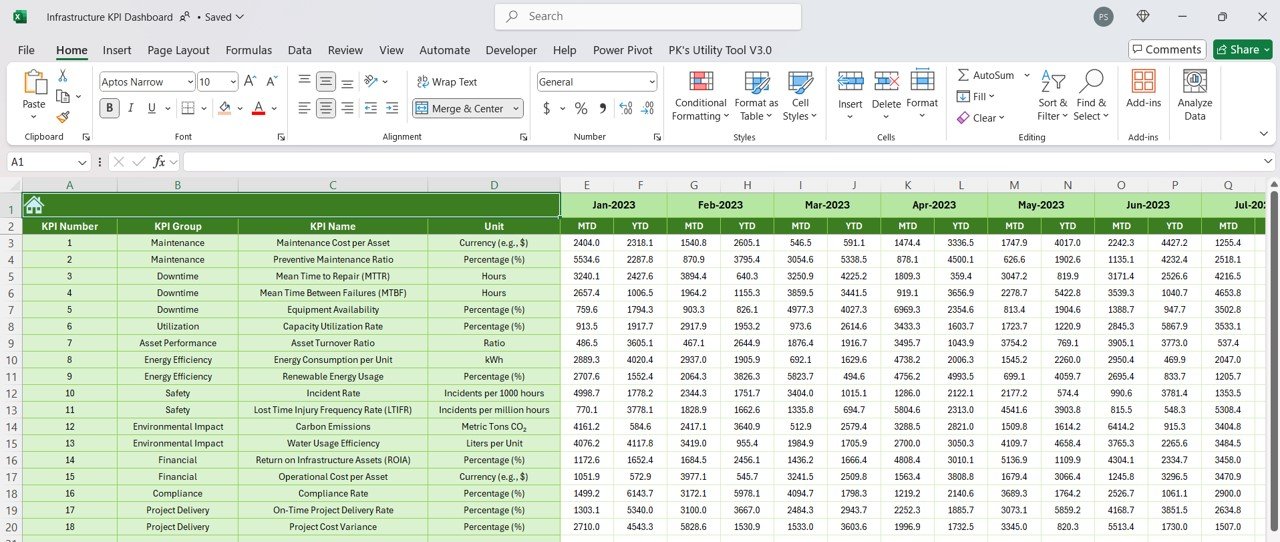
4. Actual Numbers Input Sheet – Accurate Data Entry
To ensure data consistency, the Actual Numbers Input Sheet centralizes KPI updates.
✔ User-Friendly Format: Simply enter actual values for each KPI.
✔ Auto-Adjusting Calendar: Select the starting month (cell E1) to automatically update KPI data fields.
✔ Seamless Dashboard Integration: Entered data instantly updates the main dashboard.
5. Target Sheet – Set & Track Performance Goals
The Target Sheet allows goal setting for each KPI and ensures that performance stays aligned with organizational objectives.
✔ MTD & YTD Target Input: Define monthly and yearly goals.
✔ Benchmark Performance: Compare actual values against defined targets.
✔ Customizable Goals: Easily update targets based on changing business needs.
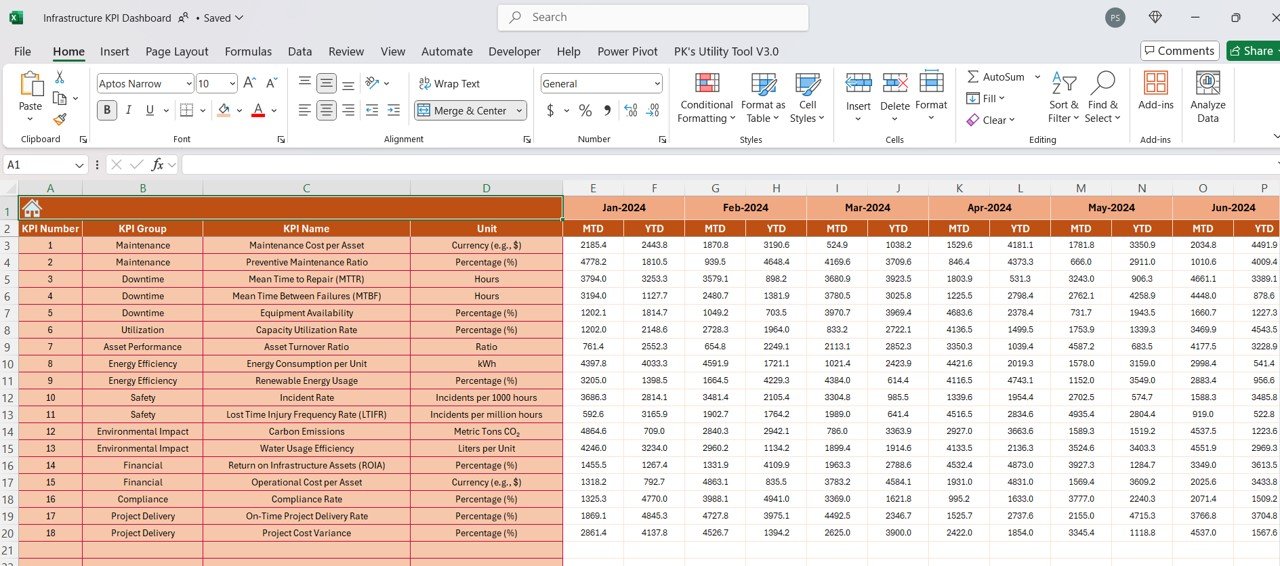
6. Previous Year Data Sheet – Yearly Benchmarking
The Previous Year Data Sheet enables comparative analysis, ensuring you track growth and efficiency over time.
✔ Enter Last Year’s KPI Data: Compare MTD and YTD figures with previous years.
✔ Trend Analysis: Identify strengths, weaknesses, and opportunities for improvement.
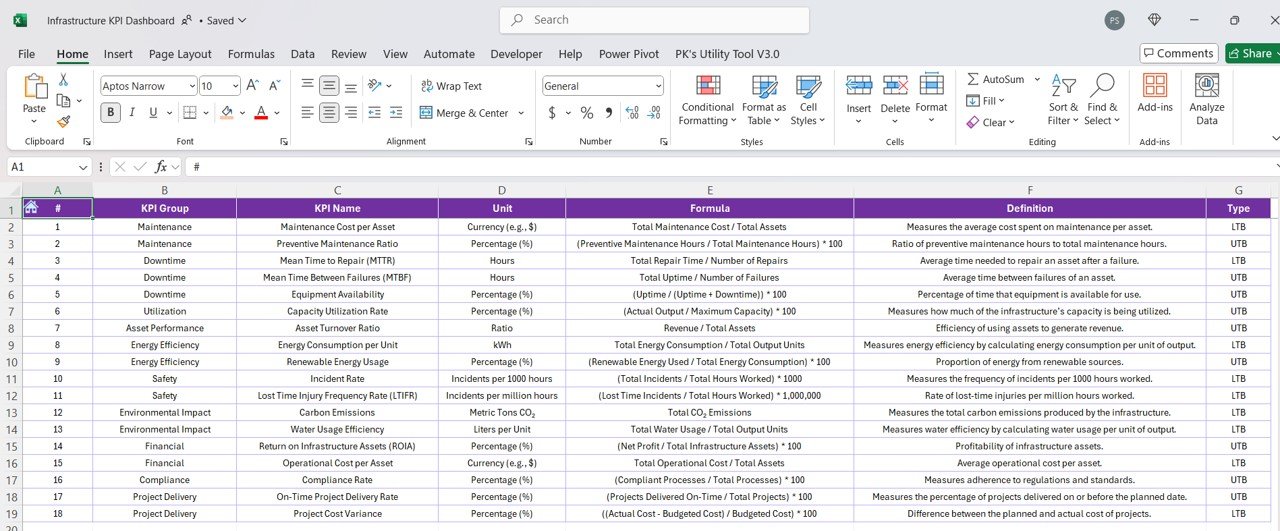
7. KPI Definition Sheet – Standardized Performance Metrics
The KPI Definition Sheet acts as a central reference guide for all tracked metrics.
✔ KPI Name & Group: Ensures structured tracking.
✔ Measurement Unit & Formula: Maintains consistency in performance calculations.
✔ Clear Definitions: Helps all team members understand KPI significance and usage.
🎯 Who Can Benefit from This KPI Dashboard?
This Infrastructure KPI Dashboard is perfect for:
✔ Infrastructure Managers & Engineers – Optimize asset utilization and maintenance costs.
✔ Facility Management Teams – Track energy efficiency, downtime, and operational performance.
✔ Finance & Compliance Officers – Monitor budget performance and regulatory compliance.
✔ Project Managers – Measure on-time delivery and cost efficiency.
🔥 Why Choose This Infrastructure KPI Dashboard?
✔ Fully Automated: No manual calculations needed! The dashboard automatically updates KPI trends.
✔ Easy to Use: No coding or advanced Excel skills required.
✔ Customizable: Modify KPI categories, formulas, and target settings based on your needs.
✔ Interactive Visuals: Charts, conditional formatting, and dropdowns provide clear insights.
✔ Instant Download & Lifetime Access: Get access immediately and use it forever!
Click hare to read the Detailed blog post
Visit our YouTube channel to learn step-by-step video tutorials


Reviews
There are no reviews yet.