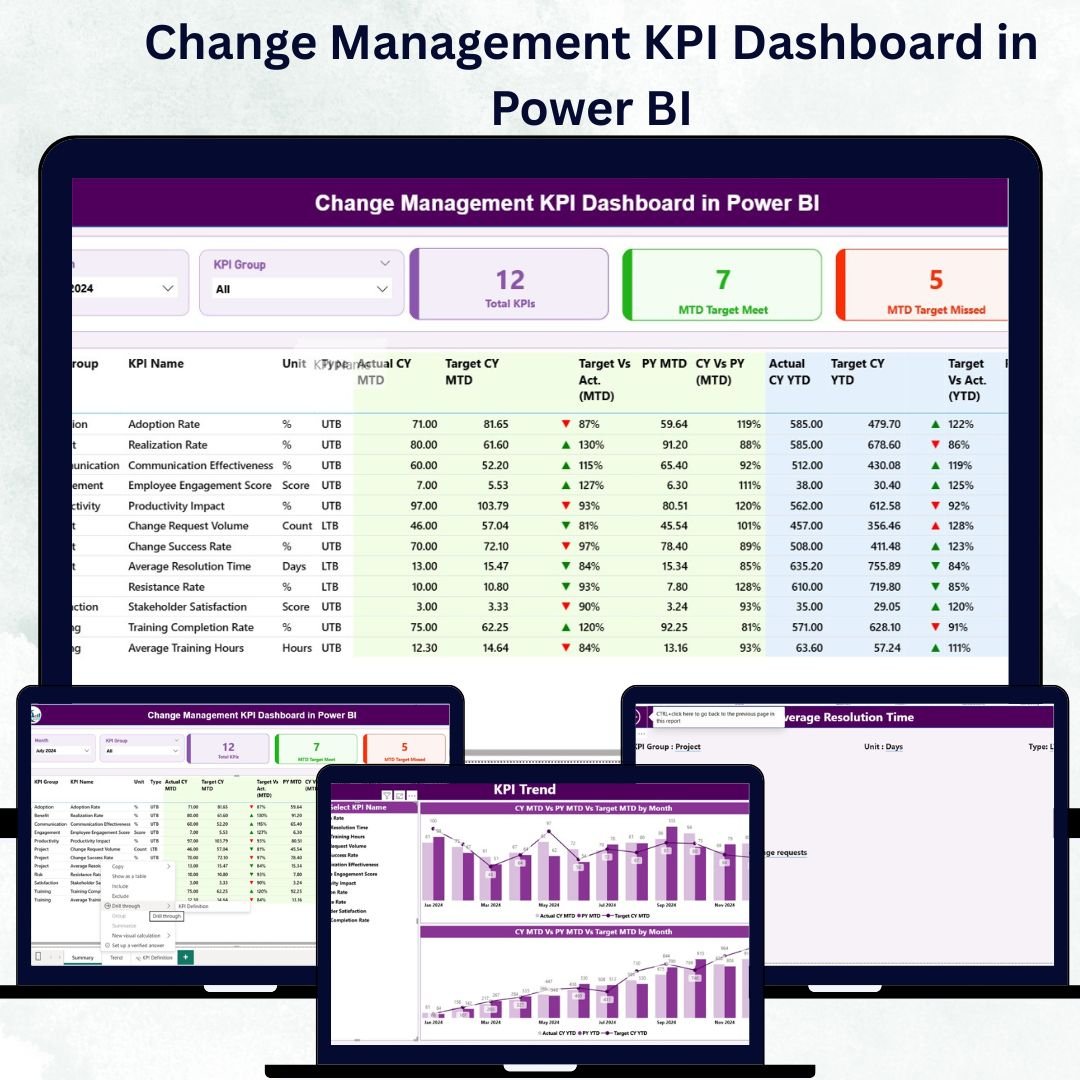
In today’s fast-changing business world, adapting to new systems, processes, and technologies is the key to long-term success. The Change Management KPI Dashboard in Power BI helps organizations measure, monitor, and manage transformation performance effortlessly. Built with Microsoft Power BI and powered by Excel data, this dashboard turns complex numbers into meaningful insights that drive smarter decisions and faster results.
With this dashboard, you’ll know exactly how well your change initiatives are performing — all in one interactive, visually rich platform.
⚡ Key Features of Change Management KPI Dashboard in Power BI
✅ Real-Time Change Tracking: Get instant visibility into change initiative progress with dynamic Power BI visuals.
📊 Interactive Filters: Filter by Month, KPI Group, or KPI Name to analyze performance from every angle.
📈 MTD & YTD Comparison: Track Month-to-Date and Year-to-Date performance alongside previous year data.
🎯 Target vs Actual Analysis: Identify whether KPIs are meeting targets using up/down icons and color-coded visuals.
🔁 Excel-Integrated Data: The dashboard is powered by Excel sheets that automatically refresh to ensure accuracy.
🧩 Drill-Through Feature: Dive deep into each KPI for definitions, formulas, and calculation methods.
🖥️ User-Friendly Interface: Clean navigation, slicers, and visual indicators make it simple for anyone to use.
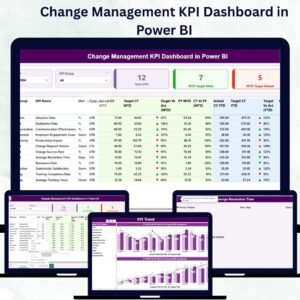
📂 What’s Inside the Change Management KPI Dashboard
This Power BI dashboard includes three powerful pages, each designed to deliver clarity and actionable insights:
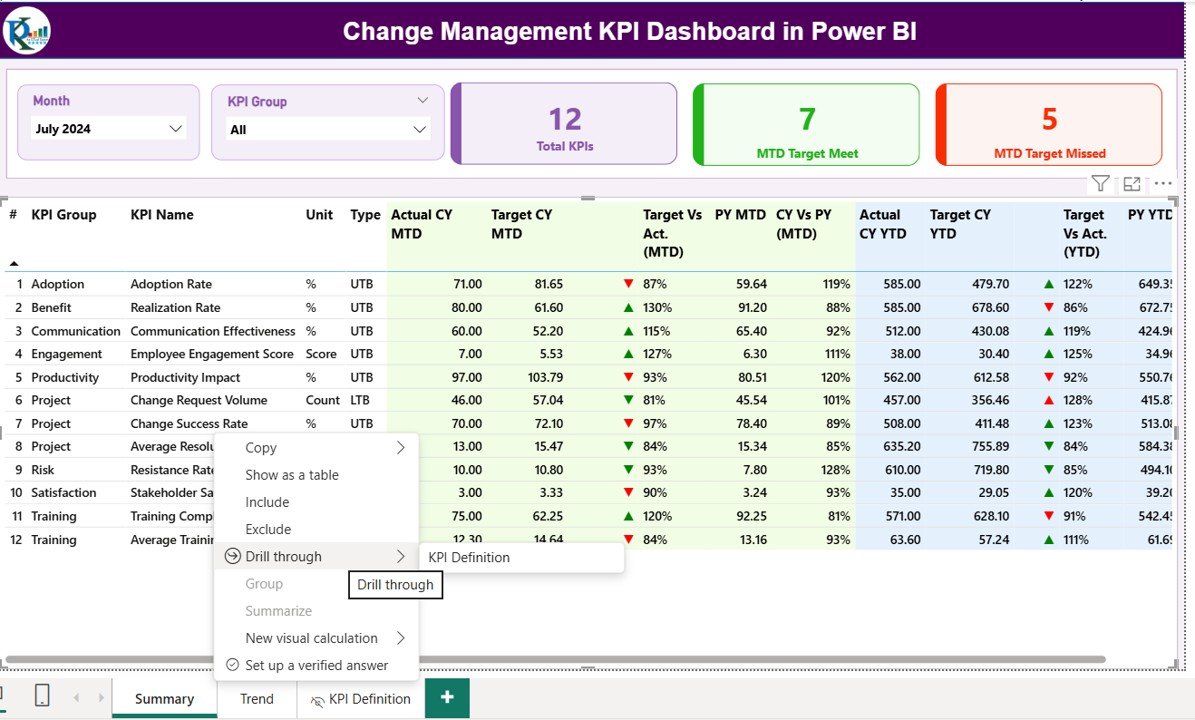
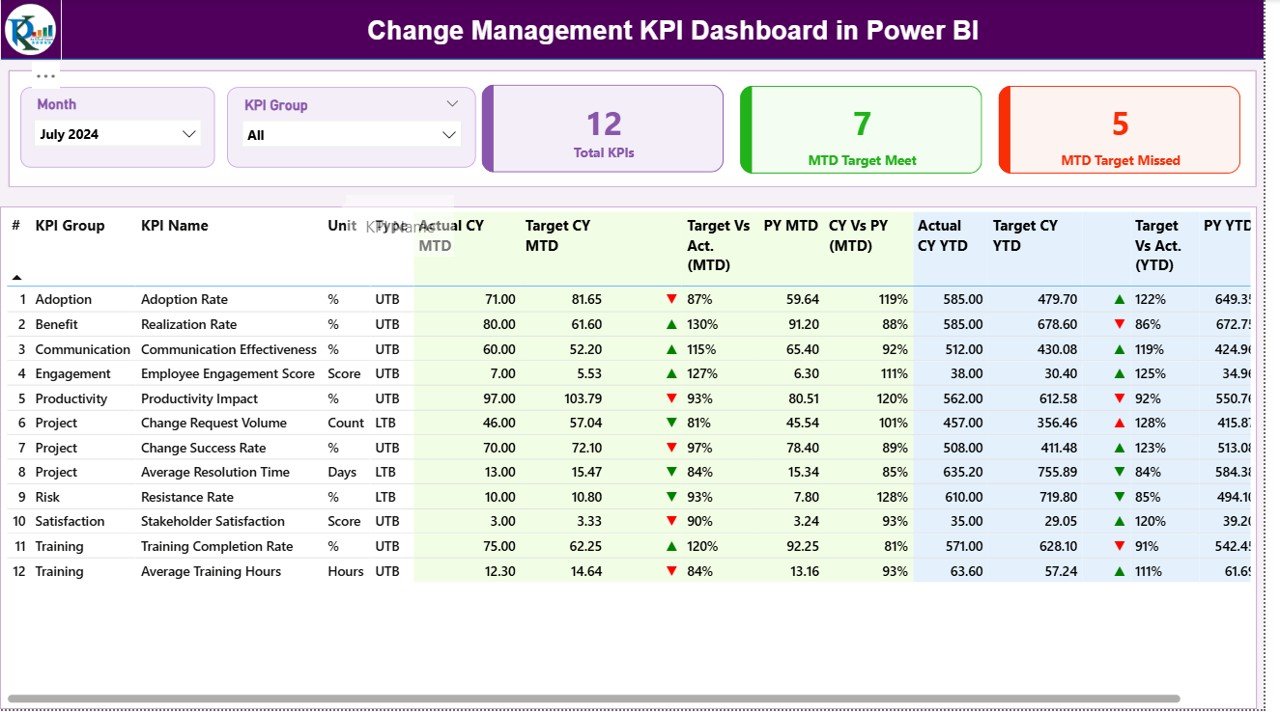
1️⃣ Summary Page:
Your main command center — showing total KPIs, MTD targets met, and missed counts with intuitive slicers for Month and KPI Group.
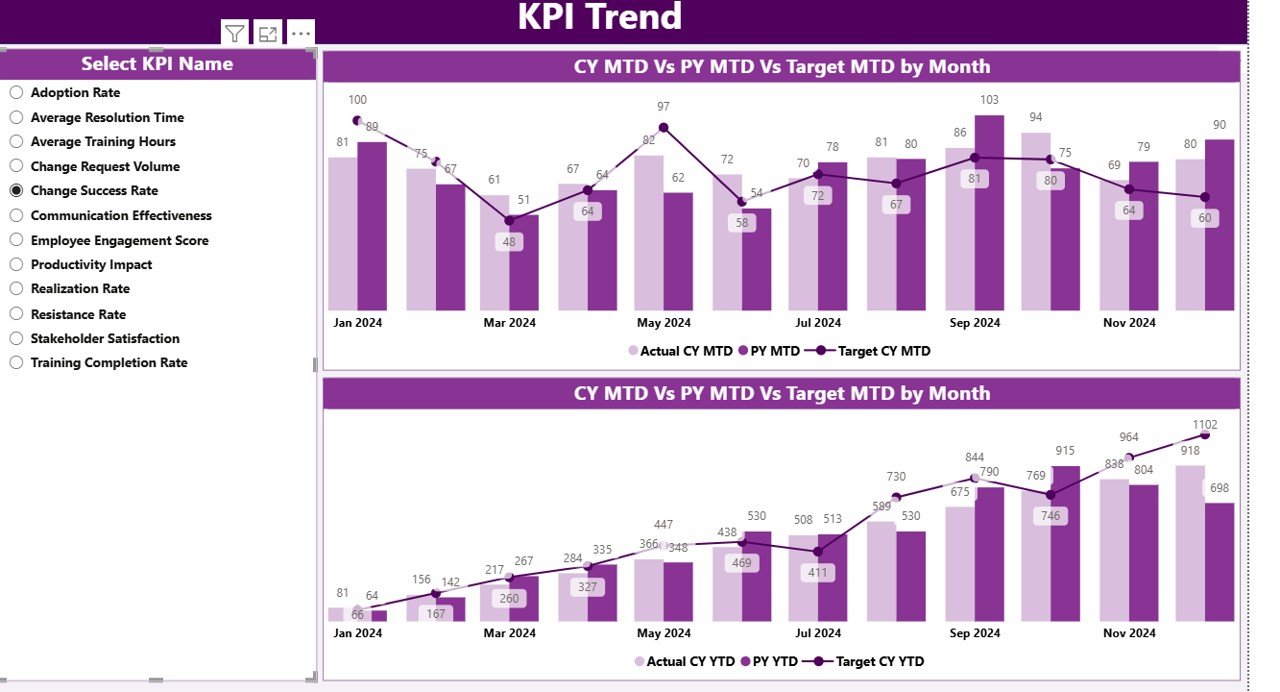
2️⃣ KPI Trend Page:
Visualize progress with combo charts that compare Actual vs Target and Current vs Previous Year performance. Perfect for spotting trends and areas needing attention.
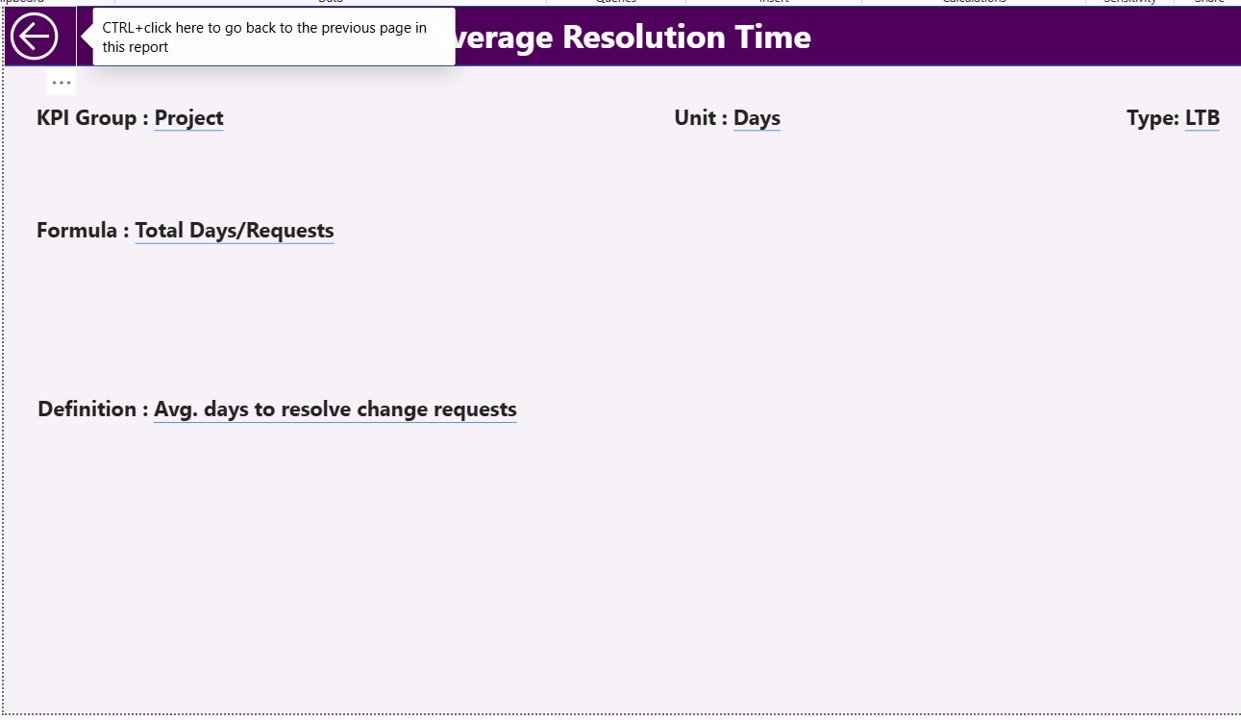
3️⃣ KPI Definition Page:
A dedicated drill-through page for full transparency. See formulas, units, KPI types (UTB/LTB), and definitions — all accessible by right-clicking on a KPI name.
Each page is designed for speed, simplicity, and strategic decision-making.
🧠 How to Use the Change Management KPI Dashboard in Power BI
1️⃣ Update Your Excel Data:
Add or refresh monthly actuals and targets in your linked Excel sheets — including Input_Actual, Input_Target, and KPI Definition.
2️⃣ Open in Power BI:
Import the Excel file into Power BI Desktop or Service. The dashboard will automatically update visuals using the latest data.
3️⃣ Apply Slicers and Filters:
Use slicers to explore different months or KPI groups and instantly see performance changes.
4️⃣ Drill Through for Details:
Right-click on any KPI to explore its definition, formula, and calculation method.
5️⃣ Refresh and Share:
Set up automated refresh schedules in Power BI Service and share reports securely with your team.
👥 Who Can Benefit from This Dashboard
💼 Corporate Leaders:
Monitor transformation success across teams and departments.
🏥 Healthcare Administrators:
Track adoption of new processes, systems, and compliance improvements.
🎓 Education Managers:
Measure training effectiveness and staff adaptation to new policies.
🏦 Financial Analysts:
Evaluate regulatory or technology-driven organizational changes.
🏭 Manufacturing Supervisors:
Monitor equipment upgrades, automation projects, and workforce retraining.
Whether you’re managing digital transformation or internal restructuring, this dashboard provides the clarity you need to lead change confidently.


Reviews
There are no reviews yet.