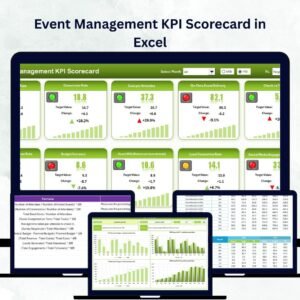
In the world of events, every moment counts 🎟️ — from pre-event promotions to post-event feedback. Success isn’t luck; it’s data-driven. That’s why the Event Management KPI Scorecard in Excel is the ultimate companion for planners, coordinators, and agencies that want measurable success at every stage.
This ready-to-use Excel template helps you track, analyze, and visualize key performance indicators (KPIs) across all event functions — marketing, budgeting, logistics, and attendee satisfaction. It transforms complex numbers into actionable insights 📊 so you can identify what’s working, fix what isn’t, and deliver flawless events every time.
⚙️ Key Features of the Event Management KPI Scorecard in Excel
📈 4 Interactive Sheets – Scorecard, KPI Trend, Input Data, and KPI Definition for complete transparency.
🎯 MTD & YTD Tracking – Switch between Month-to-Date and Year-to-Date results instantly.
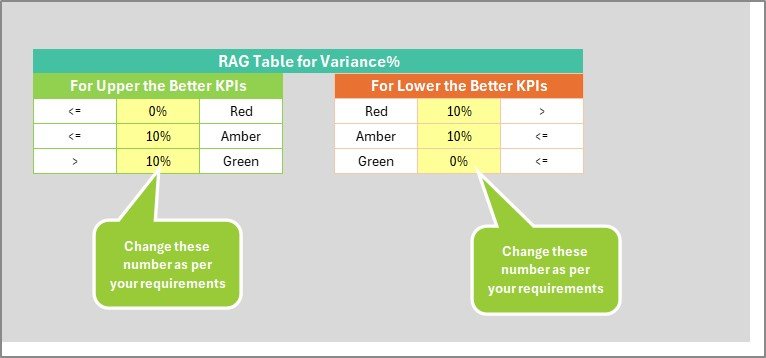
🟢 Color-Coded Performance Alerts – Green = On Track ✅ | Red = Below Target ⛔.
📊 Actual vs Target Comparison – Instantly spot wins and gaps.
📅 Dropdown Selection – Pick a month or view full-year performance.
💡 Automated Formulas & Charts – No manual calculations required.
💾 Centralized Data Input – Update once; watch every sheet refresh automatically.
💰 Low-Cost Analytics Tool – Professional-grade insights without expensive software.
📦 What’s Inside the Scorecard
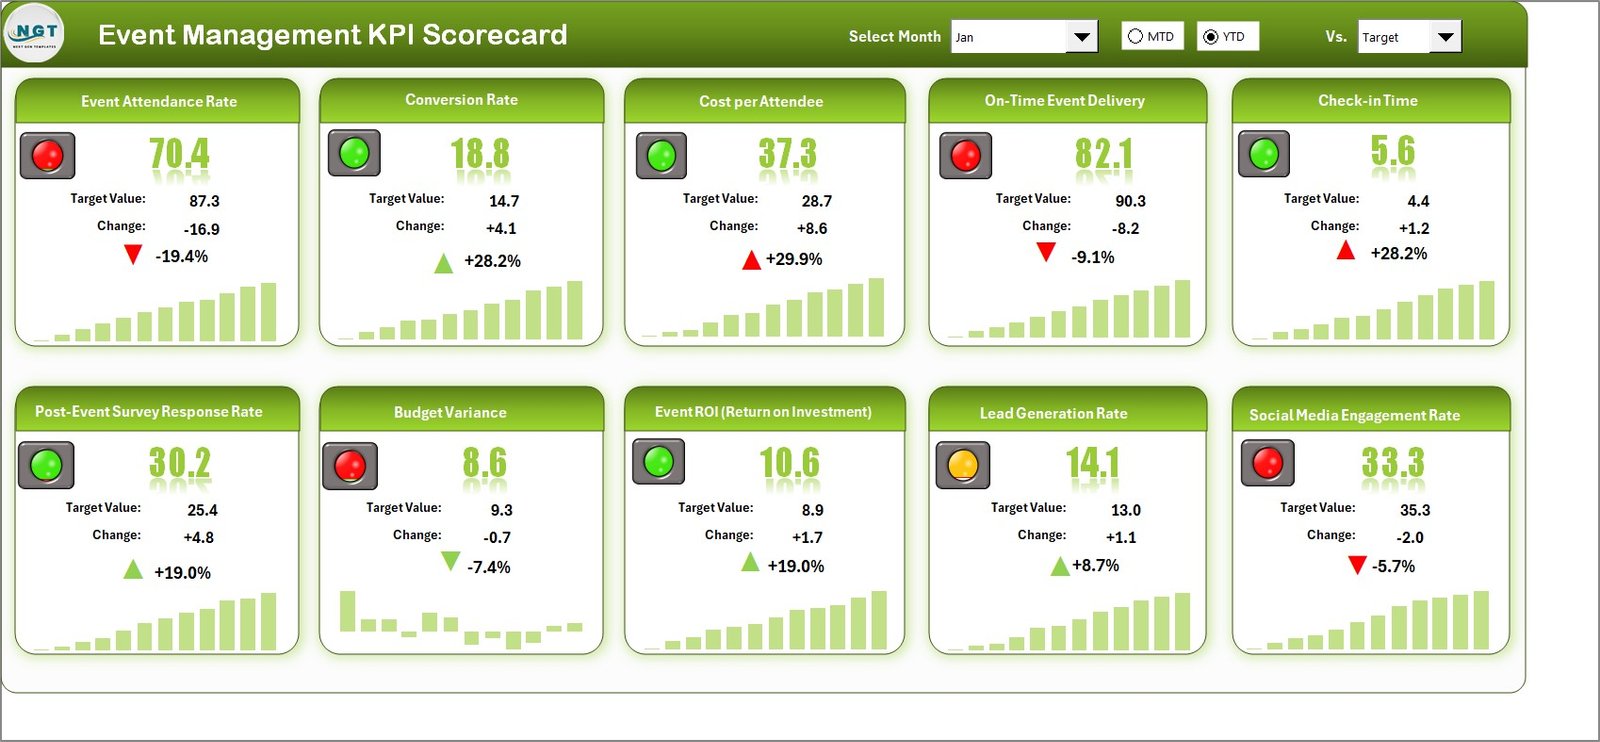
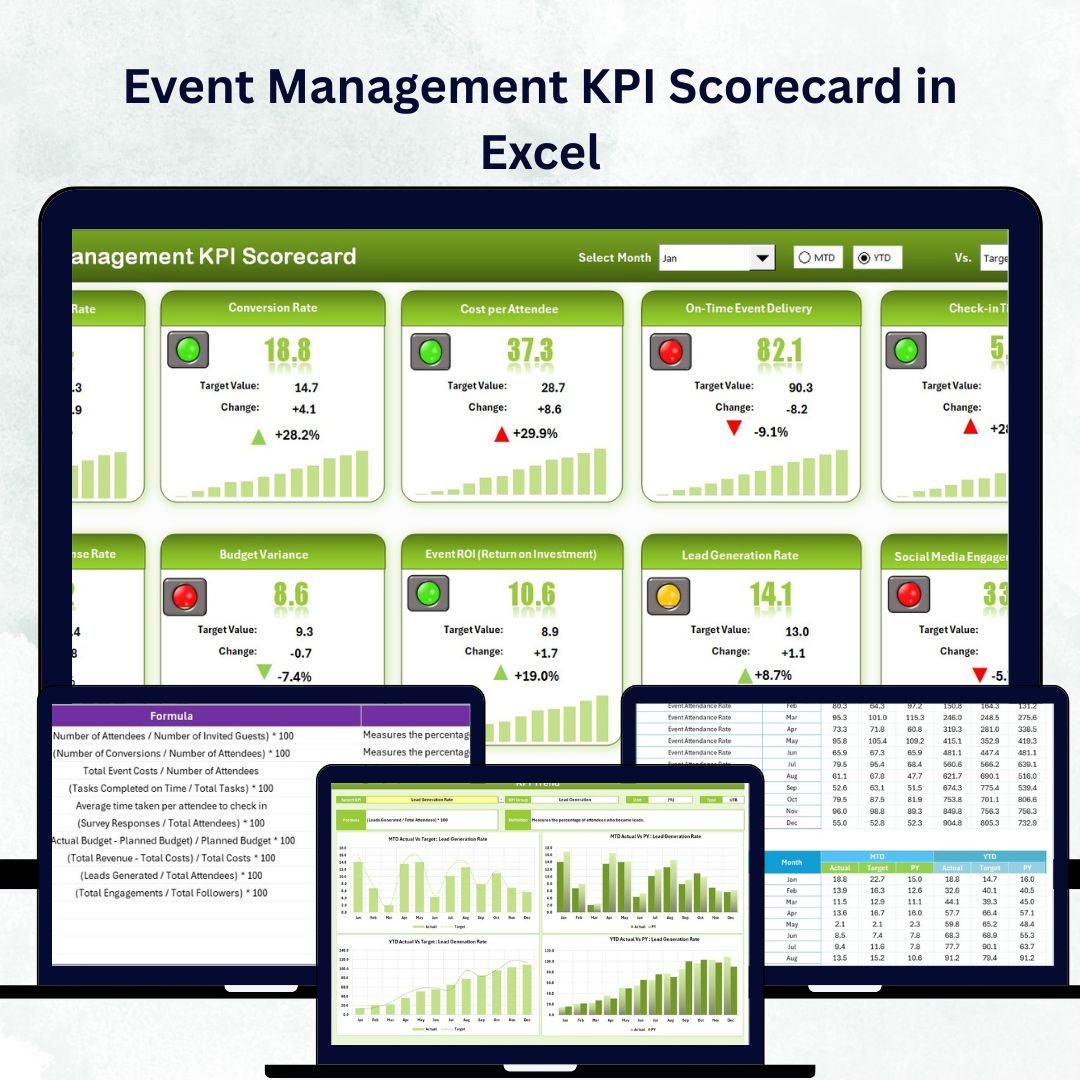
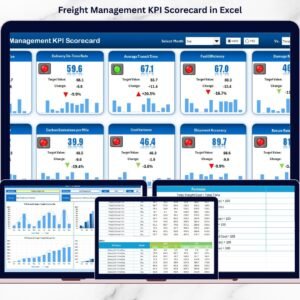
1️⃣ Scorecard Sheet – Your Control Center
The main dashboard provides a high-level snapshot of all KPIs: budget variance, attendance, engagement, and ROI.
-
Dropdown menus to select month or analysis type (MTD/YTD).
-
Automatic Actual vs Target comparison.
-
Conditional color formatting for immediate clarity.
Perfect for management reviews and stakeholder updates.
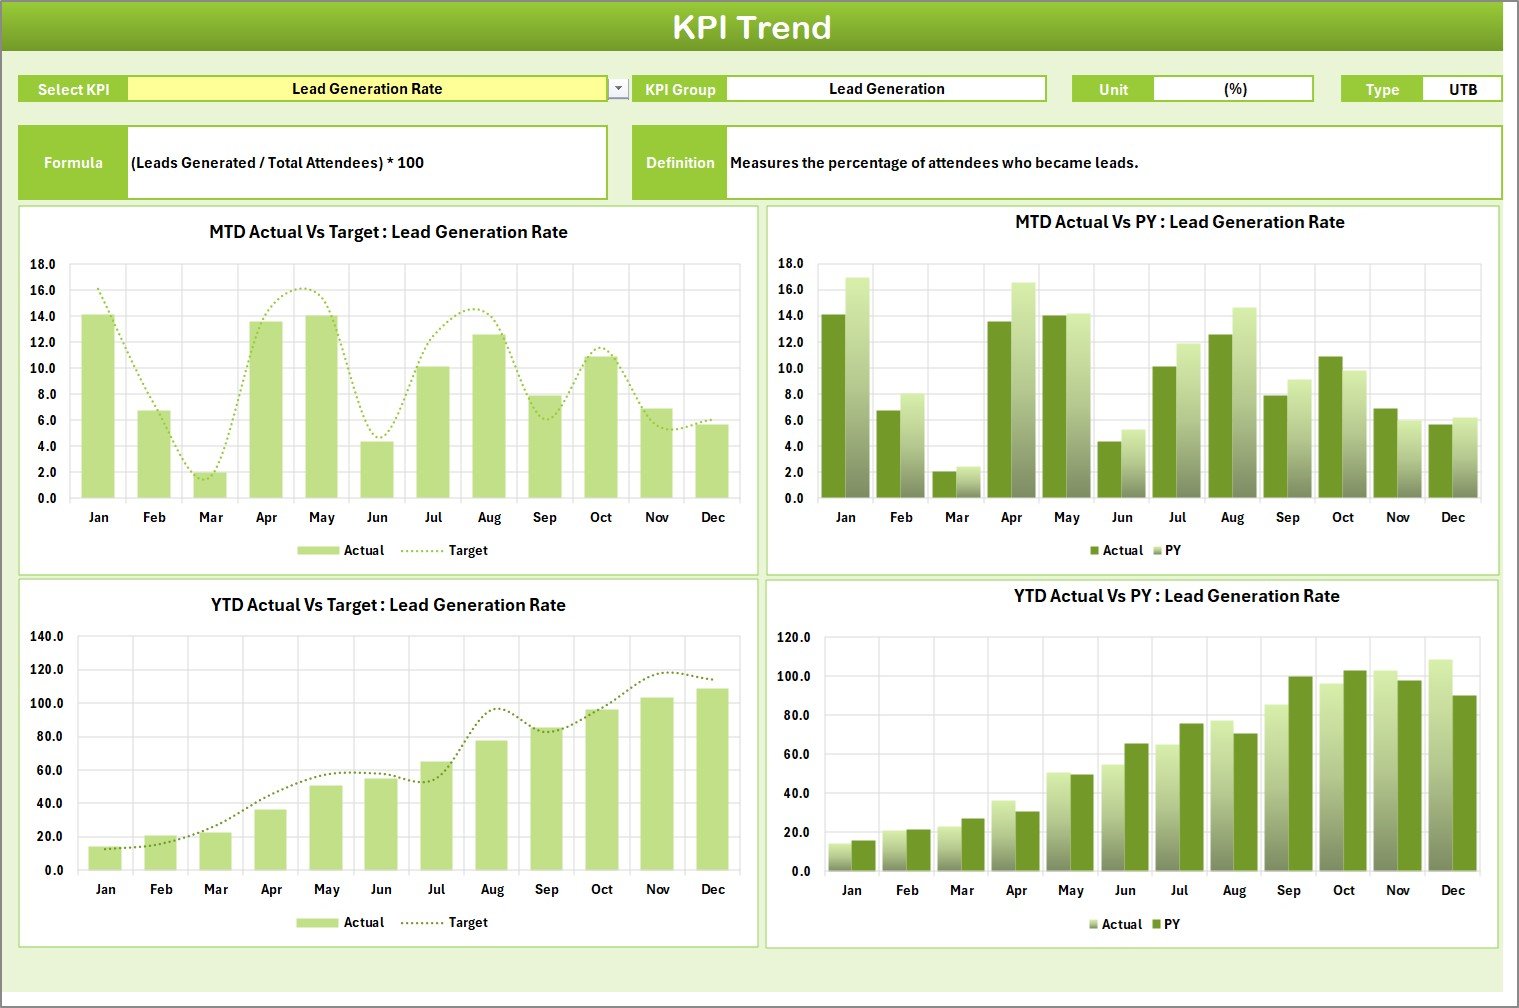
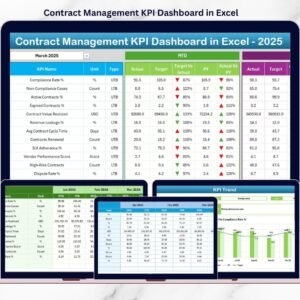
2️⃣ KPI Trend Sheet – Analyze Performance Over Time
Select any KPI (cell C3) to see its formula, unit, type (LTB/UTB), and definition.
Line and bar charts illustrate Actual vs Target vs Previous Year data, helping you spot seasonal patterns and performance consistency.
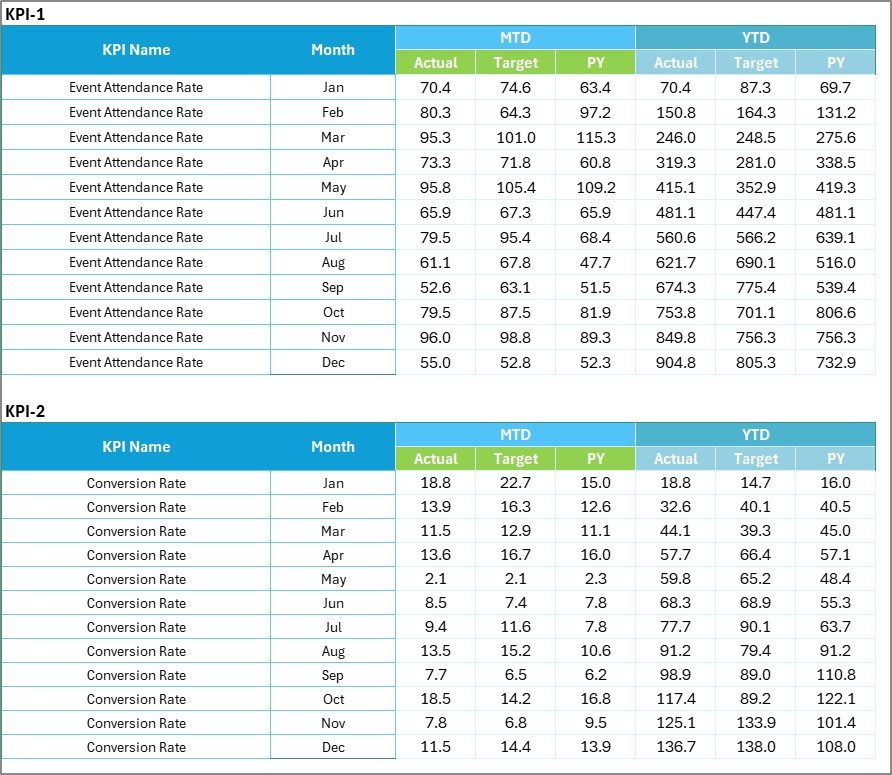
3️⃣ Input Data Sheet – Your Data Hub
Enter Actual, Target, and Previous Year values for each KPI.
Once updated, the entire workbook (auto-linked formulas and charts) refreshes instantly.
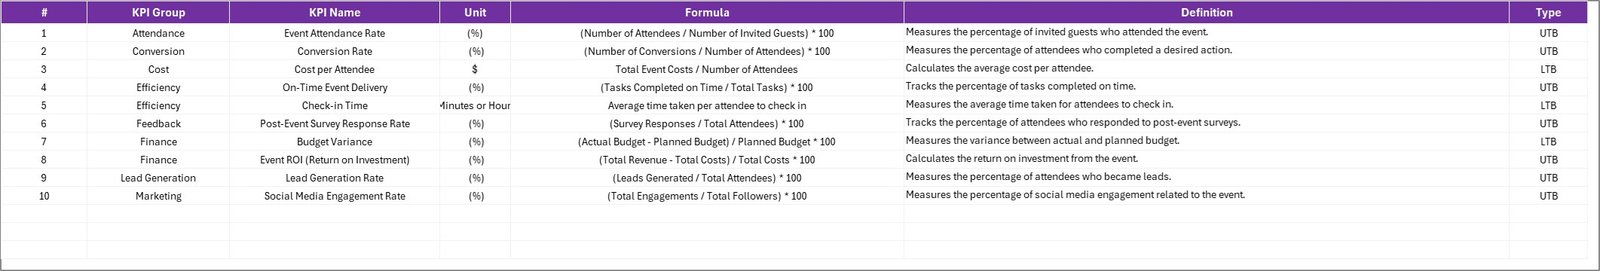
4️⃣ KPI Definition Sheet – Ensuring Consistency
Every metric is defined clearly with KPI Name, Group (Marketing, Operations, Finance, Customer Experience), Unit, Formula, and Definition.
This ensures everyone interprets data the same way 🔍.
🎪 Example KPIs You Can Track
📢 Marketing KPIs – Event Reach, Conversion Rate, Social Engagement, Website Visits.
💰 Financial KPIs – Budget Variance %, Sponsorship Revenue, Cost per Attendee, ROI.
⚙️ Operational KPIs – Task Completion %, Vendor Performance, Resource Utilization, Setup Time.
😊 Customer Experience KPIs – Attendee Satisfaction, Feedback Response Rate, Repeat Attendance, Net Promoter Score.
You can customize or expand these metrics to match your event type — corporate seminars, trade shows, concerts, or weddings 🎉.
🧭 How to Use the Scorecard Effectively
1️⃣ List your event KPIs and define their formulas.
2️⃣ Set monthly or annual targets in the Input Data sheet.
3️⃣ Enter actual data after each event.
4️⃣ Compare results in the Scorecard sheet for quick insights.
5️⃣ Use the KPI Trend sheet to monitor long-term performance.
6️⃣ Review underperforming areas and apply corrective actions.
Everything updates automatically — no technical skills required ⚙️.
🌟 Advantages of Using the Event Management KPI Scorecard in Excel
✅ Real-Time Insights – Track live performance before, during, and after events.
✅ Smarter Decisions – Make data-backed choices instead of guesses.
✅ Automation – Save hours with auto-formulas and charts.
✅ Enhanced Accountability – Each team sees its own KPIs.
✅ Flexible Customization – Adapt for any event size or industry.
✅ Collaboration Friendly – Share on OneDrive or Google Drive for team use.
✅ Budget-Smart Solution – Professional analytics with zero recurring costs.
💡 Best Practices for Maximum Impact
-
🎯 Align KPIs with your event objectives.
-
📊 Keep indicators clear and measurable.
-
🔁 Update data consistently to maintain accuracy.
-
🟢 Use charts and color codes for instant clarity.
-
🧩 Collaborate across marketing, finance, and operations teams.
-
📆 Review both MTD and YTD trends for short and long-term insights.
By following these best practices, you turn data into a continuous improvement engine for event success 🚀.


Reviews
There are no reviews yet.