In today’s rapidly evolving electronics industry ⚙️, staying ahead requires more than innovation — it demands precise performance tracking. From production efficiency and sales growth to quality control and customer satisfaction, every metric plays a vital role.
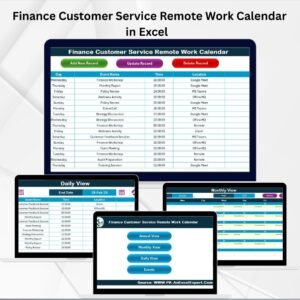
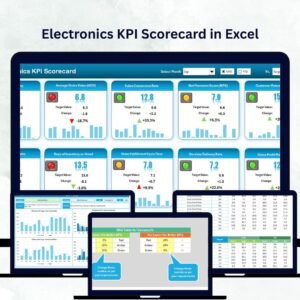
The Electronics KPI Scorecard in Excel is a ready-to-use, data-driven solution designed to help electronics manufacturers, distributors, and service providers measure, monitor, and optimize performance across all departments.
Built entirely in Microsoft Excel, this scorecard transforms raw data into interactive dashboards and visual insights — empowering teams to make informed decisions faster and smarter 💡. Whether you’re managing production lines, analyzing sales performance, or tracking warranty claims, this tool gives you a 360° view of your business efficiency.
⚙️ Key Features of the Electronics KPI Scorecard in Excel
📊 4 Functional Sheets – Scorecard, KPI Trend, Input Data, and KPI Definition sheets for complete visibility.
🎯 Actual vs Target Comparison – Instantly view how your performance measures up to set goals.
📅 MTD & YTD Analysis – Track Month-to-Date and Year-to-Date data for accurate trend evaluation.
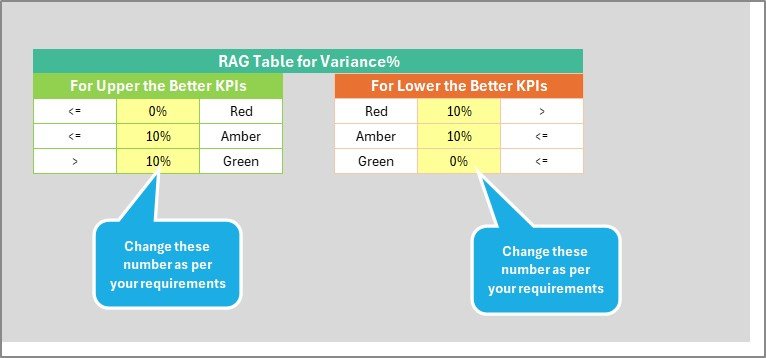
🟢 Visual Indicators – Arrows and color-coded icons highlight improvement or decline.
📈 Dynamic Trend Charts – Analyze performance changes and long-term patterns over time.
🧩 KPI Reference Library – Clear formulas, definitions, and units ensure consistency across teams.
💻 Auto-Updating Dashboard – All visuals refresh automatically when data changes.
💰 Customizable Template – Add, remove, or adjust KPIs to suit your organization’s needs.
📦 What’s Inside the Scorecard Template
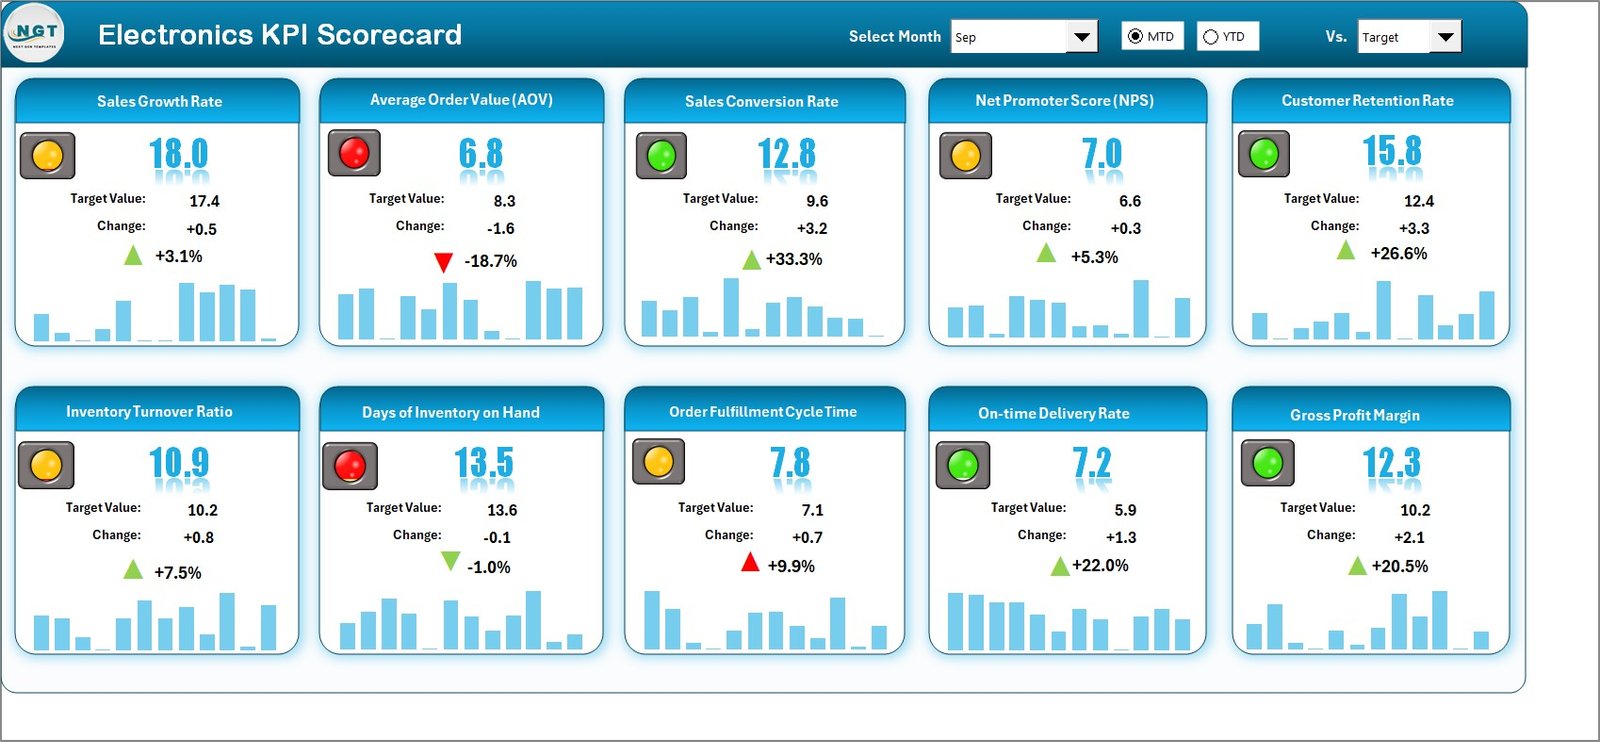
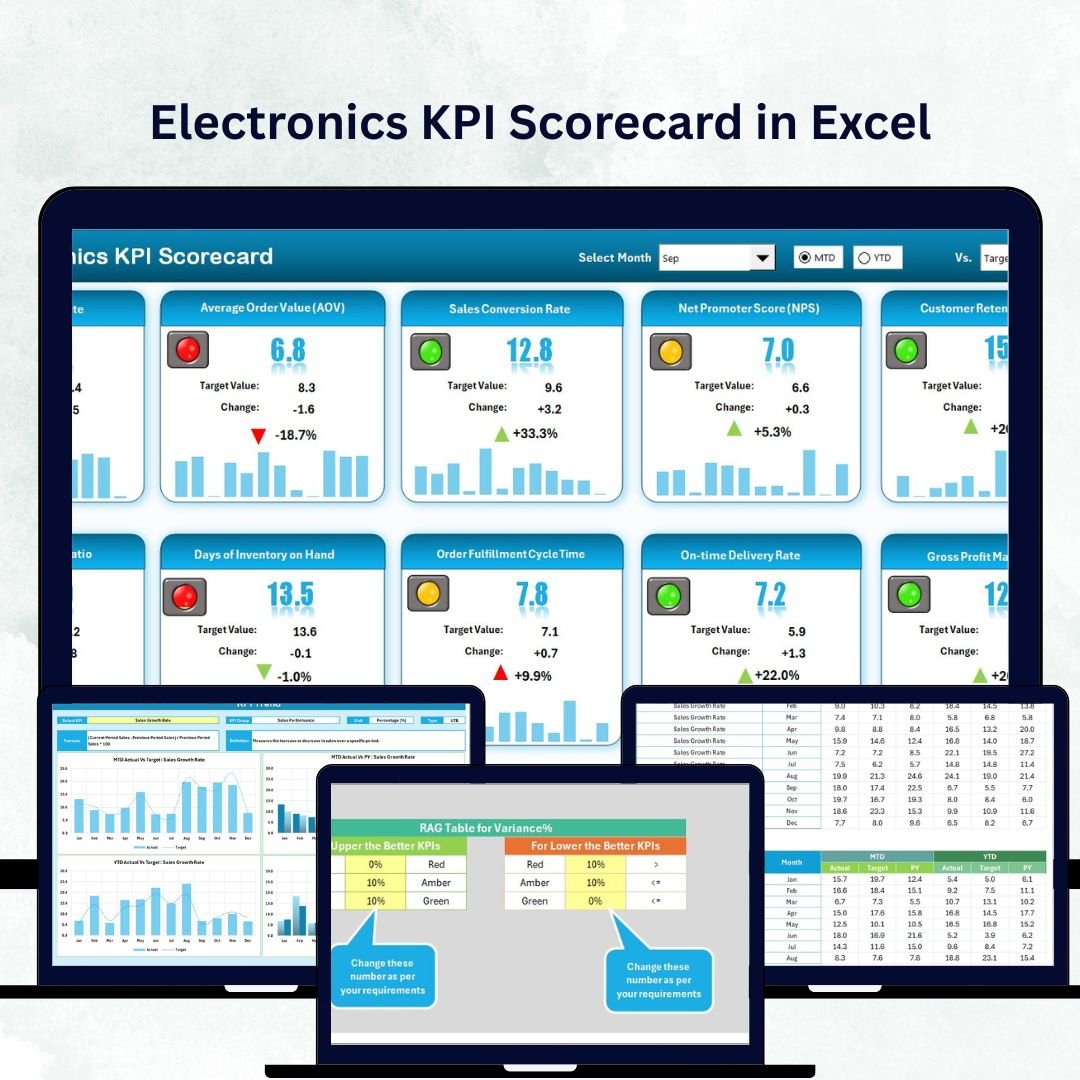
1️⃣ Scorecard Sheet – Your Main Dashboard
-
Displays key KPIs for Production, Sales, Quality, and Customer Service.
-
Dropdown menus let you select Month and MTD/YTD mode.
-
Includes color-coded arrows for instant performance feedback.
-
Provides KPI Group, Unit, Actual, Target, Variance, and Status — all in one glance.
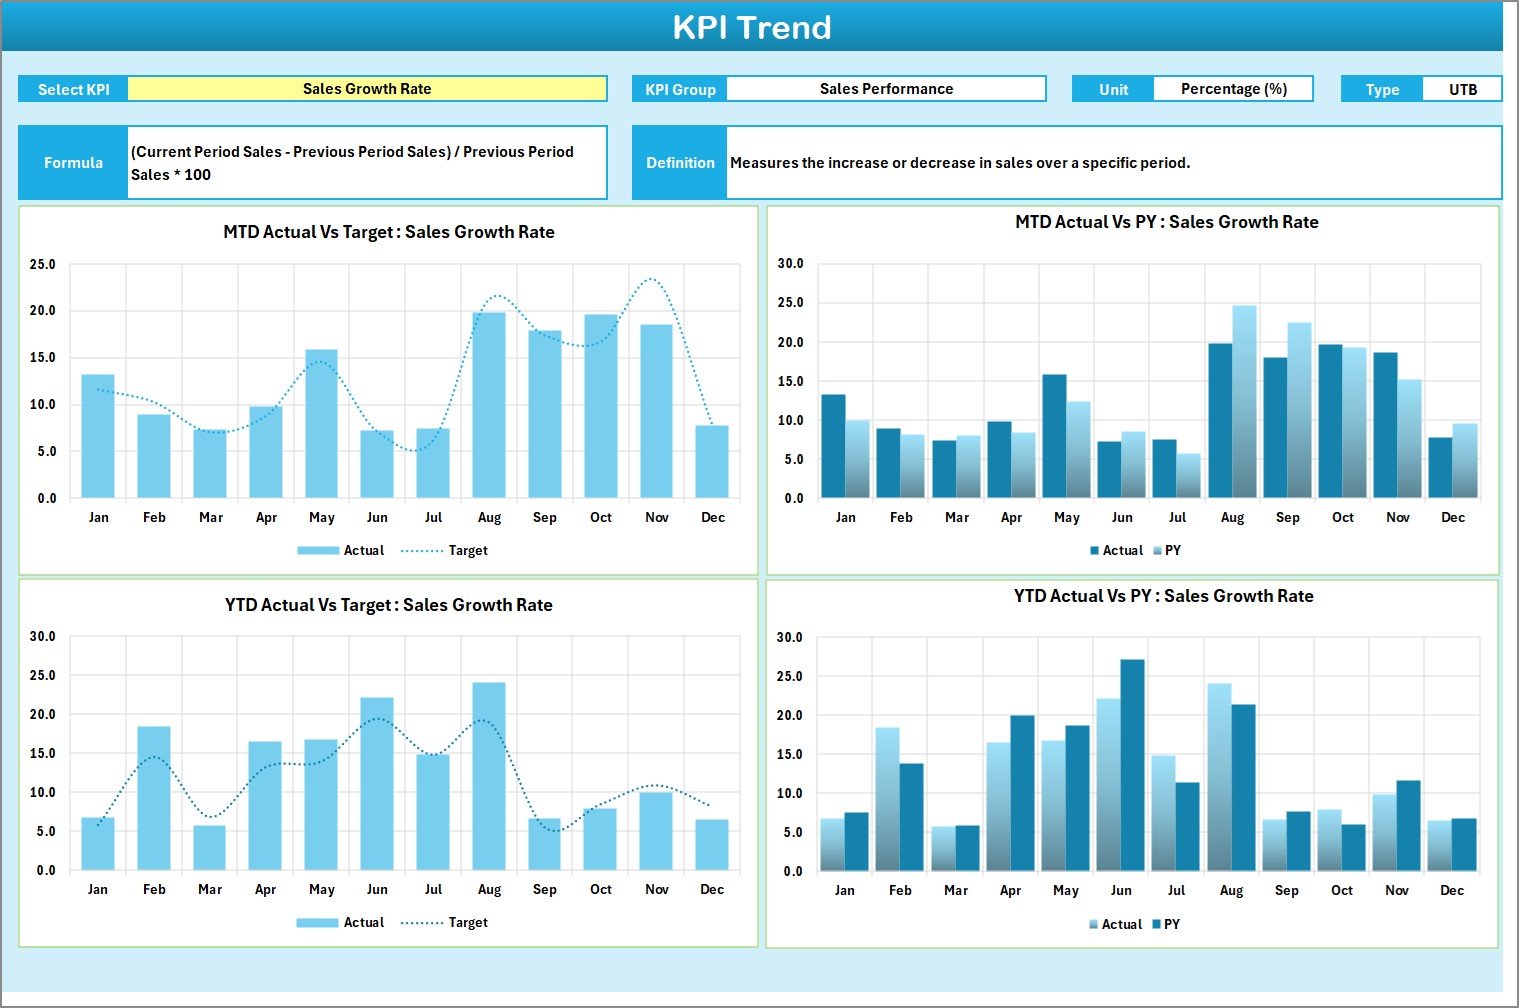
2️⃣ KPI Trend Sheet – Analyze Historical Progress
-
Select any KPI from a dropdown to view long-term performance trends.
-
Visualize MTD and YTD charts for Actual, Target, and Previous Year (PY) data.
-
Identify deviations, improvements, and opportunities for optimization.
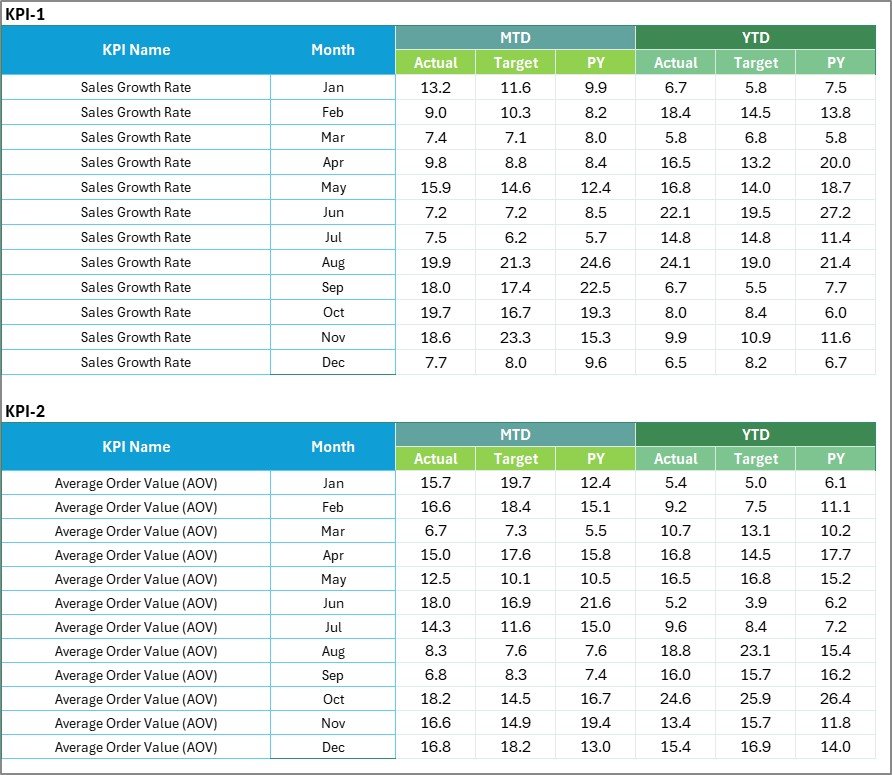
3️⃣ Input Data Sheet – Centralized Data Entry
-
Record monthly data for Actual, Target, and Previous Year results.
-
Automatically updates the Scorecard and Trend pages.
-
Keeps data organized, structured, and error-free.
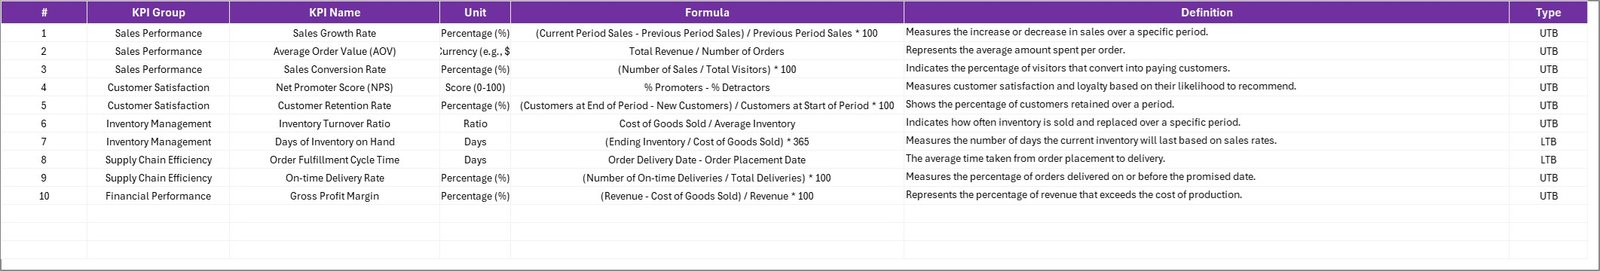
4️⃣ KPI Definition Sheet – Performance Dictionary
-
Lists all KPIs with their Group, Unit, Formula, and Definition.
-
Ensures everyone interprets metrics consistently across departments.
🔋 Common KPIs in an Electronics Scorecard
🏭 Manufacturing KPIs – Production Yield (%), Machine Downtime (Hours), Defect Rate (%), Lead Time.
💼 Sales & Distribution KPIs – Total Revenue, On-Time Delivery (%), Return Rate (%), Order Fulfillment Rate.
🧪 Quality Control KPIs – First Pass Yield (FPY), Customer Complaints, Warranty Claims, Recall Rate.
📦 Inventory KPIs – Stock-Out Frequency, Supplier Lead Time, Inventory Turnover Ratio.
💰 Financial KPIs – Gross Profit Margin, Cost per Unit, Budget Utilization (%), Revenue per Employee.
These KPIs help your business maintain quality, profitability, and customer trust.
🧭 How to Use the Electronics KPI Scorecard
1️⃣ Enter monthly Actual, Target, and Previous Year data into the Input Sheet.
2️⃣ The Scorecard Sheet automatically updates with visuals and variance metrics.
3️⃣ Use the KPI Trend Sheet to study progress and patterns over time.
4️⃣ Refer to the KPI Definition Sheet for clarity on each metric.
This workflow ensures your data is accurate, automated, and easy to interpret — even for non-technical users.
🚀 Advantages of Using the Electronics KPI Scorecard in Excel
✅ Centralized Monitoring – Consolidates KPIs from multiple departments into one file.
✅ Real-Time Visibility – Dashboards update instantly when data changes.
✅ Improved Decision-Making – Enables data-backed strategic and operational choices.
✅ Customizable Design – Modify KPIs, formulas, and visuals effortlessly.
✅ Budget-Friendly Solution – Delivers professional analytics without costly software.
✅ Enhanced Collaboration – Share via OneDrive or Google Drive for multi-user access.
✅ Scalable System – Expand KPI lists as your business grows.
⚡ Best Practices for Using the Scorecard
-
Focus on high-impact KPIs aligned with your strategic goals.
-
Use Excel’s conditional formatting for clear visual cues.
-
Protect formula cells to maintain calculation accuracy.
-
Update data monthly for reliable performance insights.
-
Review quarterly trends to align with long-term objectives.
Follow these practices to transform your Excel file into a powerful performance intelligence system.


Reviews
There are no reviews yet.