In modern sports management, data is the ultimate game-changer 🏆. From analyzing player fitness to monitoring financial performance, every winning decision depends on accurate insights. The Sports KPI Scorecard in Excel brings all those insights together into a single, structured system — helping teams, academies, and organizations track every critical performance metric efficiently.
Built entirely in Microsoft Excel, this ready-to-use scorecard is a comprehensive performance tracking solution that centralizes metrics for players, teams, operations, and finance. It transforms raw numbers into visual dashboards, allowing coaches, managers, and analysts to make data-driven decisions that lead to consistent improvement and greater success.
⚙️ Key Features of the Sports KPI Scorecard in Excel
📊 Four Core Worksheets – Scorecard, KPI Trend, Input Data, and KPI Definition sheets for complete analysis.
🎯 Actual vs Target Comparison – Instantly measure how your team or player performs against goals.
📅 MTD & YTD Tracking – View Month-to-Date and Year-to-Date results to identify season-long trends.
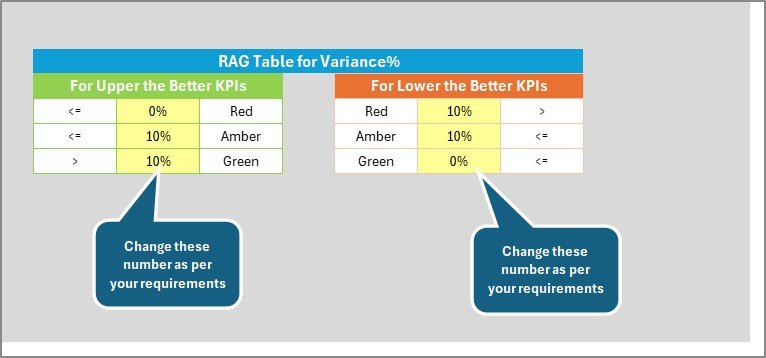
🟢 Visual Indicators – Conditional formatting and color-coded arrows highlight performance gaps and improvements.
📈 Dynamic Trend Charts – Analyze player or team performance over time using automated visuals.
📋 KPI Definitions Included – Every KPI has a clear formula and definition for consistent reporting.
💼 Customizable & Scalable – Add sports-specific KPIs, modify formulas, or tailor visuals for your organization.
💰 Cost-Effective Solution – A one-time Excel file that replaces expensive analytics software.
📦 What’s Inside the Scorecard Template
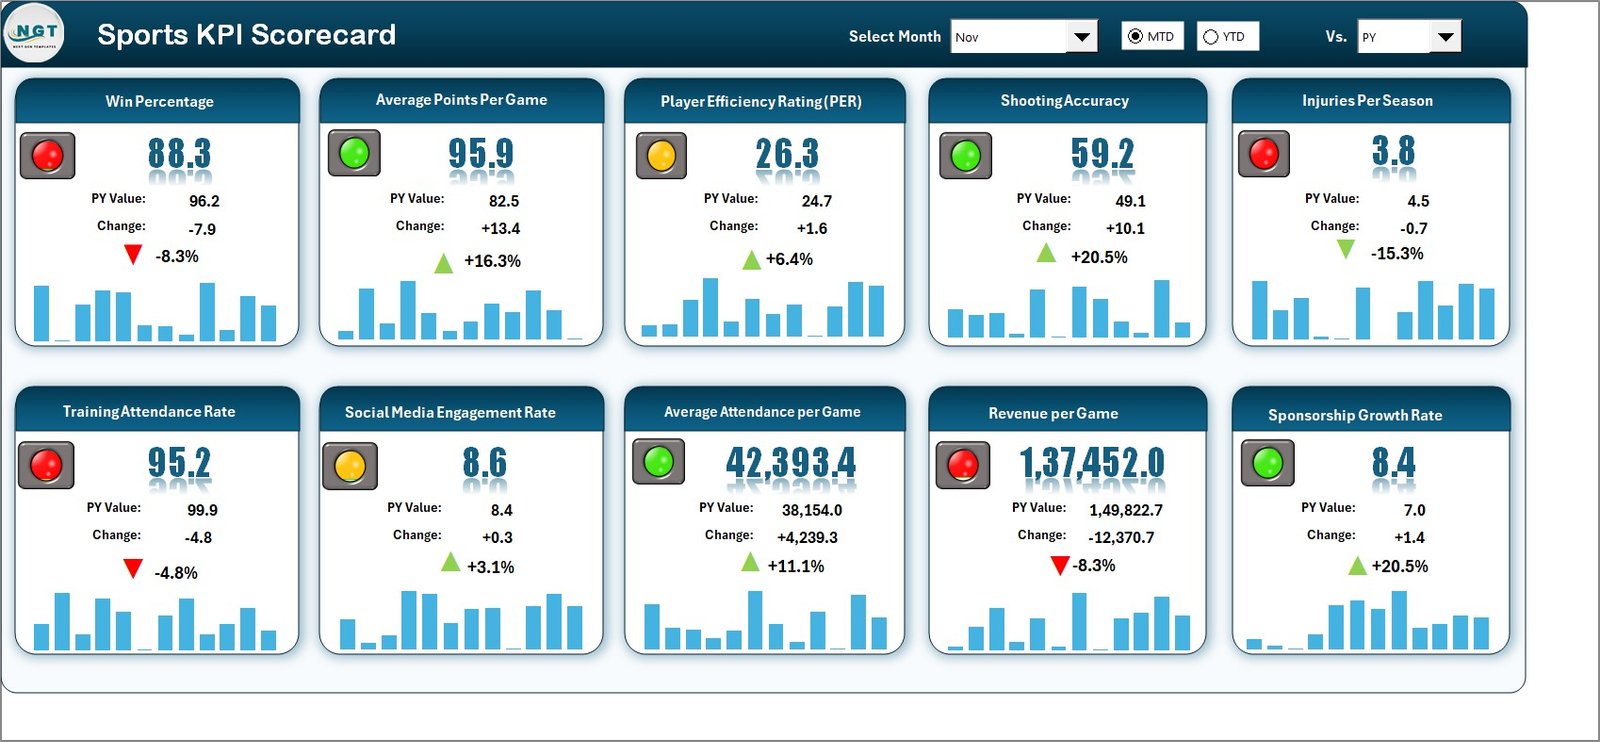
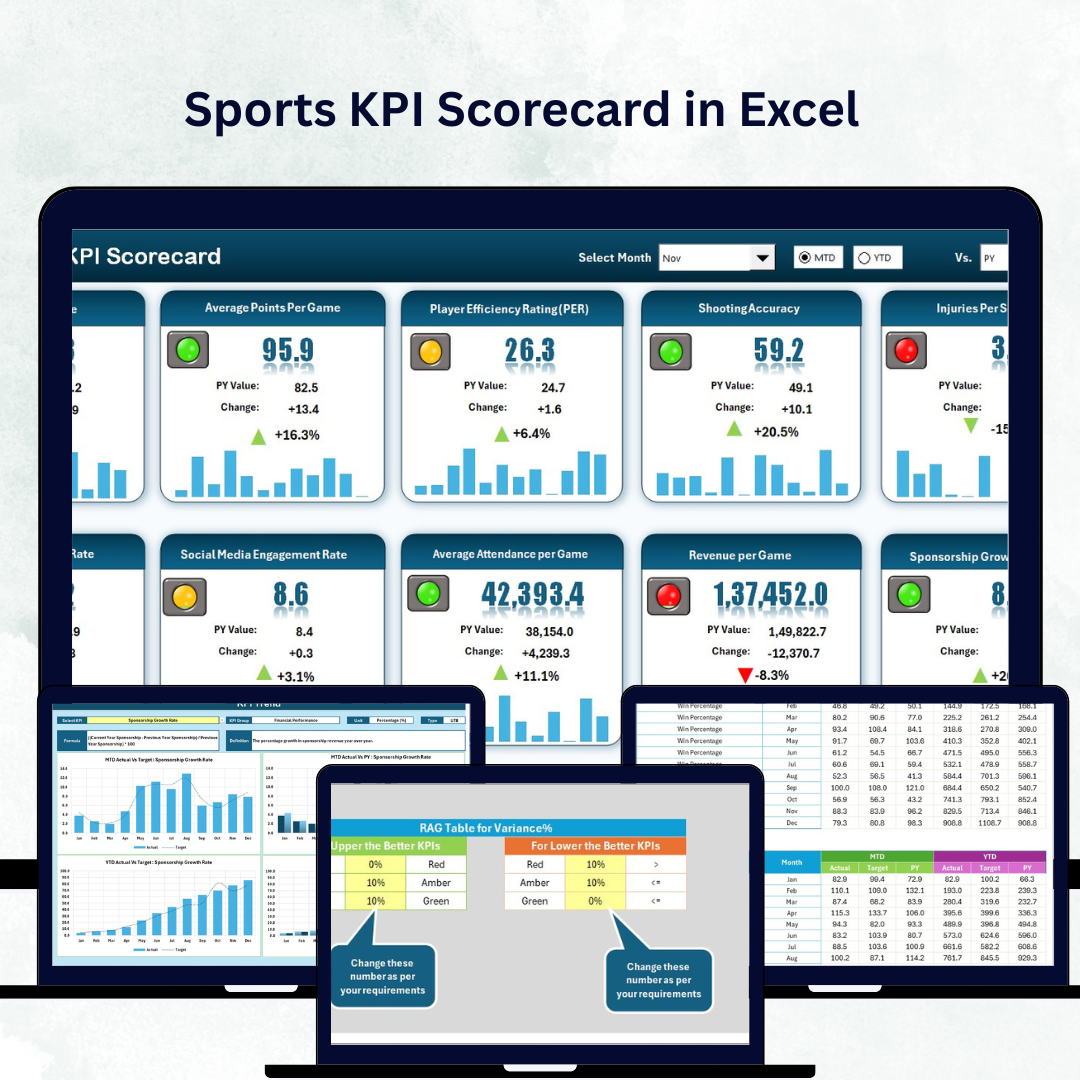
1️⃣ Scorecard Sheet (Main Dashboard)
-
View all KPIs at a glance with dropdown filters for Month and MTD/YTD mode.
-
Compare Actual vs Target values with color-coded indicators (green for good, red for poor).
-
Displays KPI Name, Group, Unit, Actuals, Targets, and Gaps for transparent analysis.
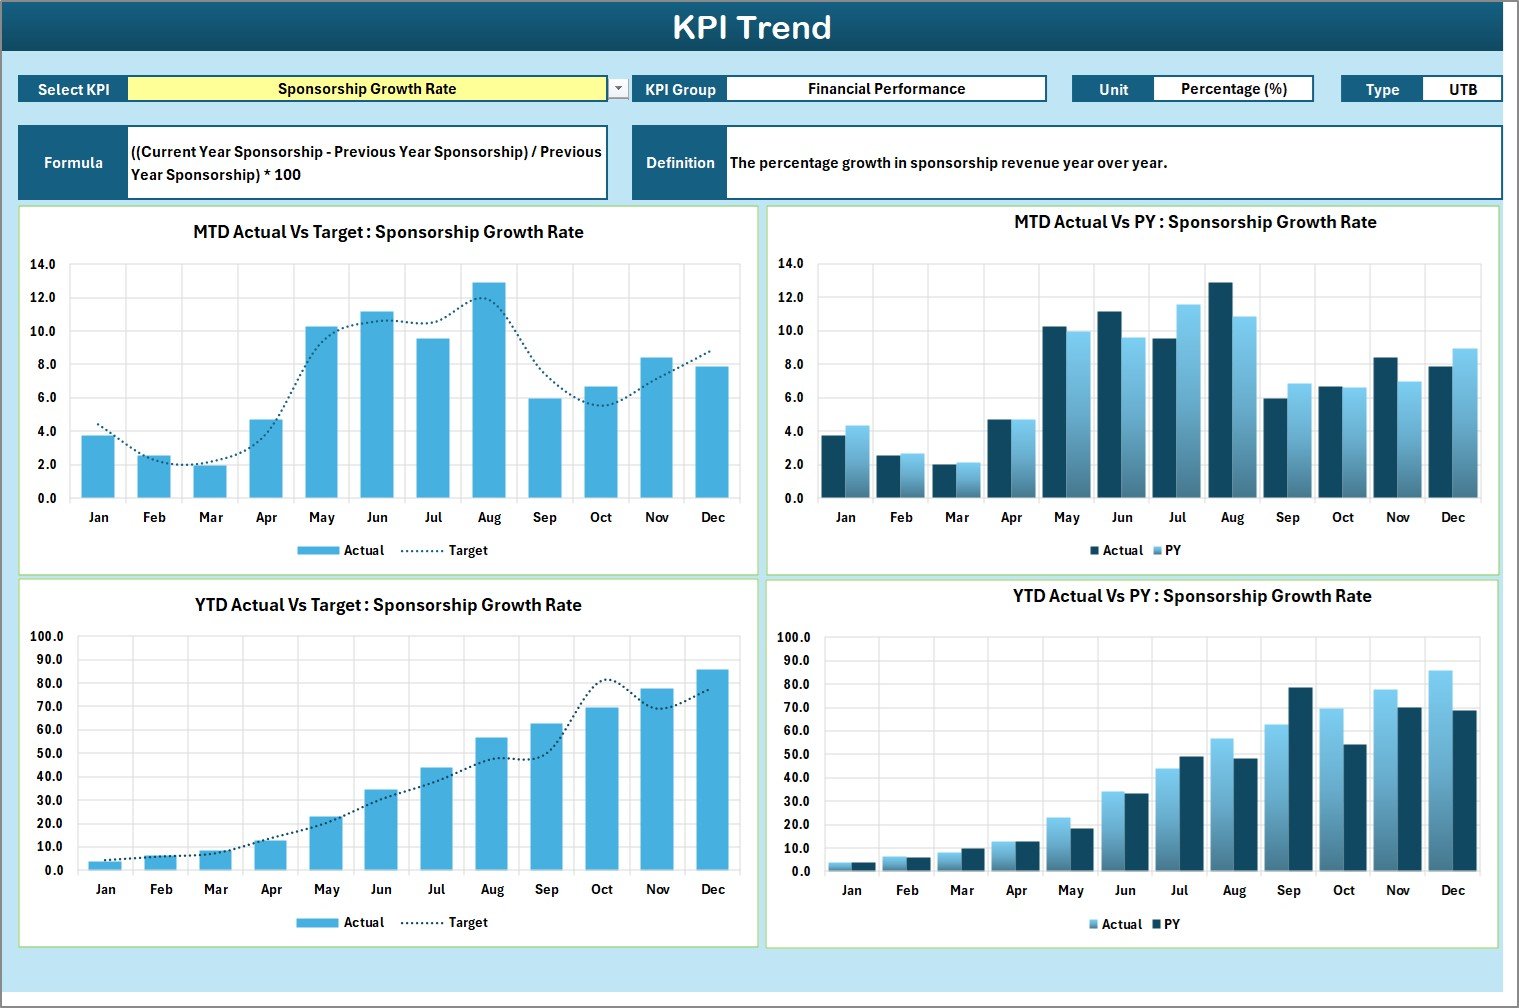
2️⃣ KPI Trend Sheet
-
Select a KPI from a dropdown (cell C3) to explore detailed performance patterns.
-
Displays KPI Group, Unit, Type (UTB/LTB), Formula, and Definition.
-
Includes dual charts for MTD and YTD data (Actual vs Target vs Previous Year).
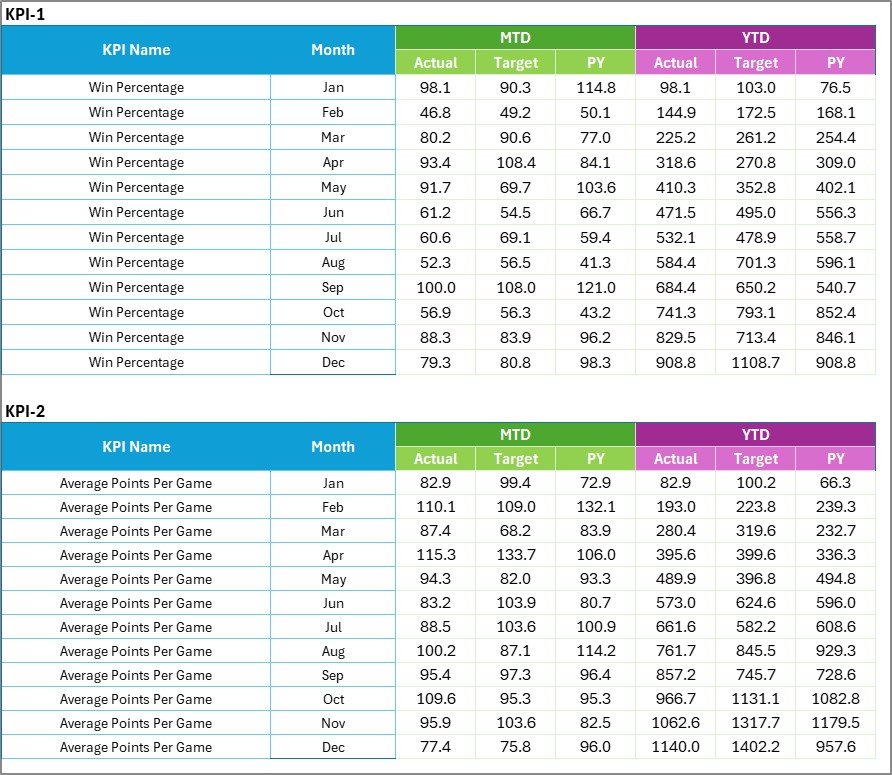
3️⃣ Input Data Sheet
-
Record monthly Actual, Target, and PY (Previous Year) values for each KPI.
-
Automatically updates all visuals and summaries across sheets.
-
Ensures real-time reporting with minimal manual effort.
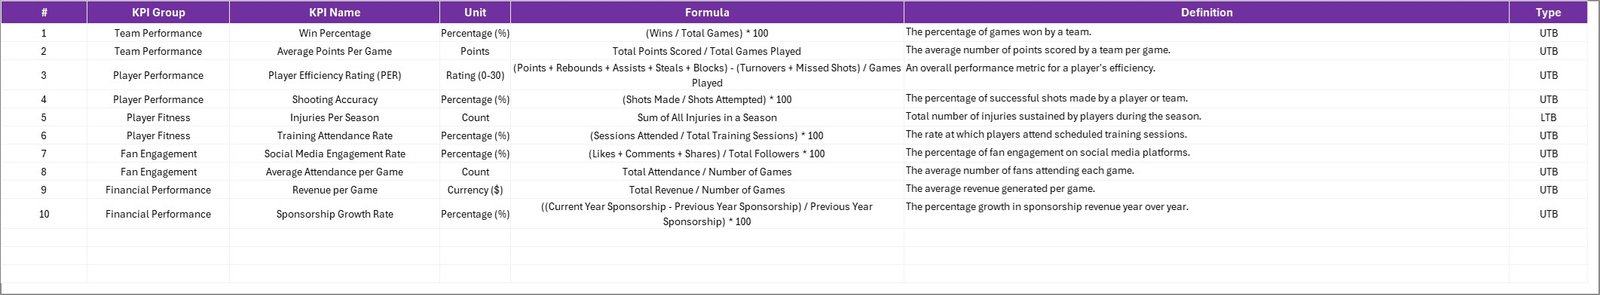
4️⃣ KPI Definition Sheet
-
Acts as your internal glossary.
-
Includes KPI Name, Group, Formula, Unit, and Definition.
-
Guarantees that everyone—from coaches to finance staff—interprets KPIs consistently.
⚽ Common KPIs Tracked in the Sports Scorecard
🏃 Player & Team Performance – Goals Scored, Win/Loss Ratio, Injury Rate (%), Training Hours, Fitness Score.
🧠 Operational Efficiency – Coaching Session Effectiveness, Attendance (%), Equipment Utilization Rate.
💰 Financial Performance – Revenue per Match, Sponsorship ROI, Cost per Player, Budget Utilization (%).
🎟️ Fan Engagement – Attendance per Game, Merchandise Sales, Social Media Interaction Rate.
These KPIs give a 360° view of performance—from on-field execution to off-field management.
🧭 How It Works
1️⃣ Enter your monthly Actual, Target, and Previous Year data into the Input Sheet.
2️⃣ The Scorecard and Trend Sheets automatically calculate variances and display updated visuals.
3️⃣ Use the Trend Sheet to study progress and make tactical adjustments.
4️⃣ Refer to the Definition Sheet anytime to clarify how each KPI is measured.
This integrated workflow provides real-time accuracy and saves hours of manual analysis.
🏅 Advantages of the Sports KPI Scorecard in Excel
✅ Centralized Tracking – Combine athletic, operational, and financial data in one view.
✅ Informed Decision-Making – Compare Actual vs Target data for smarter coaching choices.
✅ Accountability & Transparency – Assign KPIs to specific players or teams.
✅ Instant Visualization – Auto-updating charts and arrows show progress in real time.
✅ Fully Customizable – Works for football, cricket, basketball, tennis, or any other sport.
✅ Budget-Friendly Analytics – Leverage Excel’s power without expensive software licenses.
🏆 Best Practices for Maximum Impact
-
Define clear objectives before selecting KPIs.
-
Limit KPIs to 10–15 key metrics for clarity.
-
Use conditional formatting to highlight priorities.
-
Update data after each match or training cycle.
-
Protect formula cells to maintain accuracy.
-
Review quarterly trends to inform strategy and resource allocation.
By following these steps, your scorecard becomes a real-time performance playbook that empowers data-driven sports management.


Reviews
There are no reviews yet.