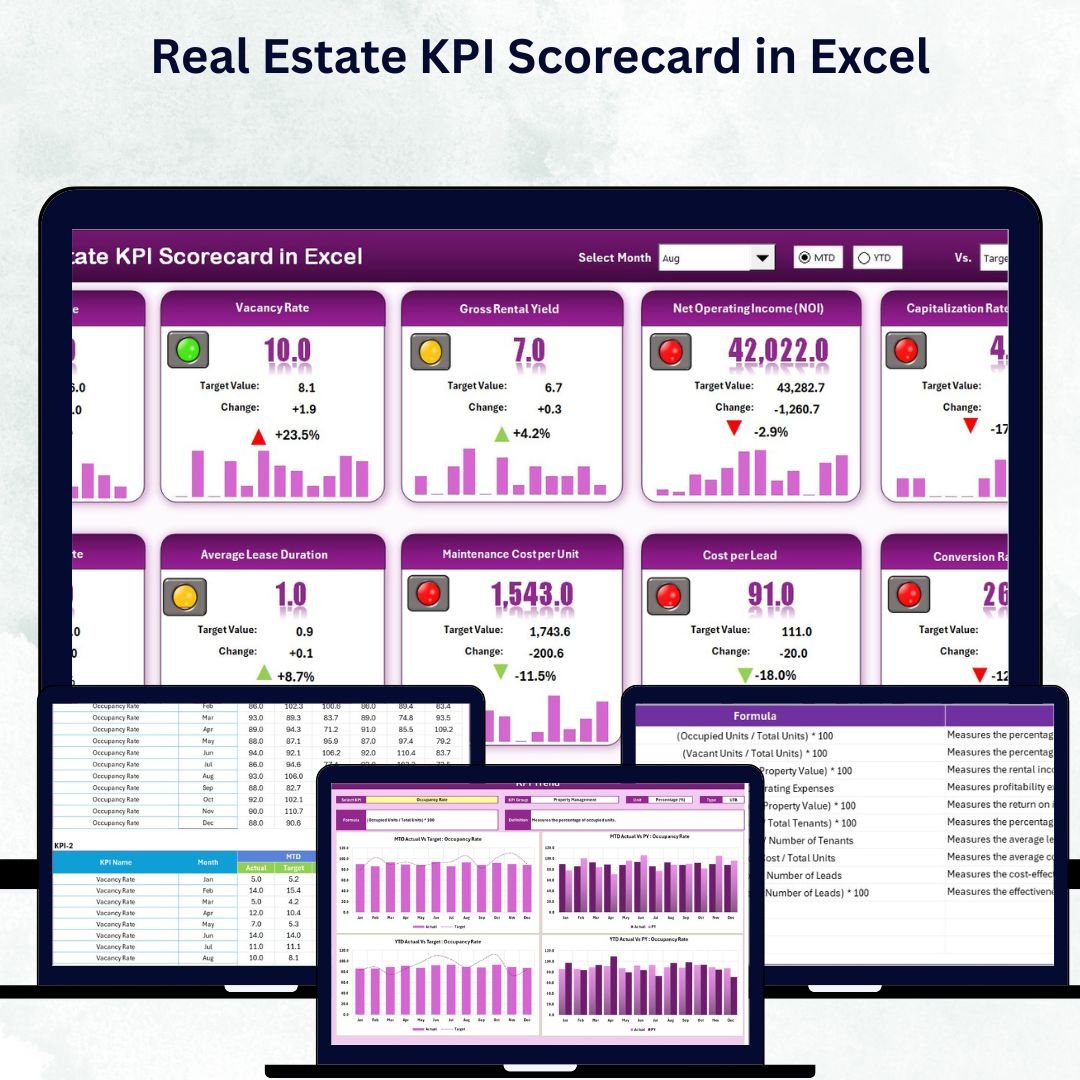
Managing a real estate business means dealing with dozens of performance indicators — from occupancy rates and rent collection to marketing ROI and sales conversions. Without a structured performance-tracking system, it’s easy to miss insights that impact profitability. That’s why we built the Real Estate KPI Scorecard in Excel — a ready-to-use, data-driven tool that helps real estate professionals visualize performance, track KPIs, and make informed decisions effortlessly.Real Estate KPI Scorecard in Excel
This Excel-based scorecard gives you complete control over your data. Whether you manage commercial properties, residential units, or real estate development projects, this tool helps you measure results, set benchmarks, and drive growth with clarity.
✨ Key Features of Real Estate KPI Scorecard in Excel
-
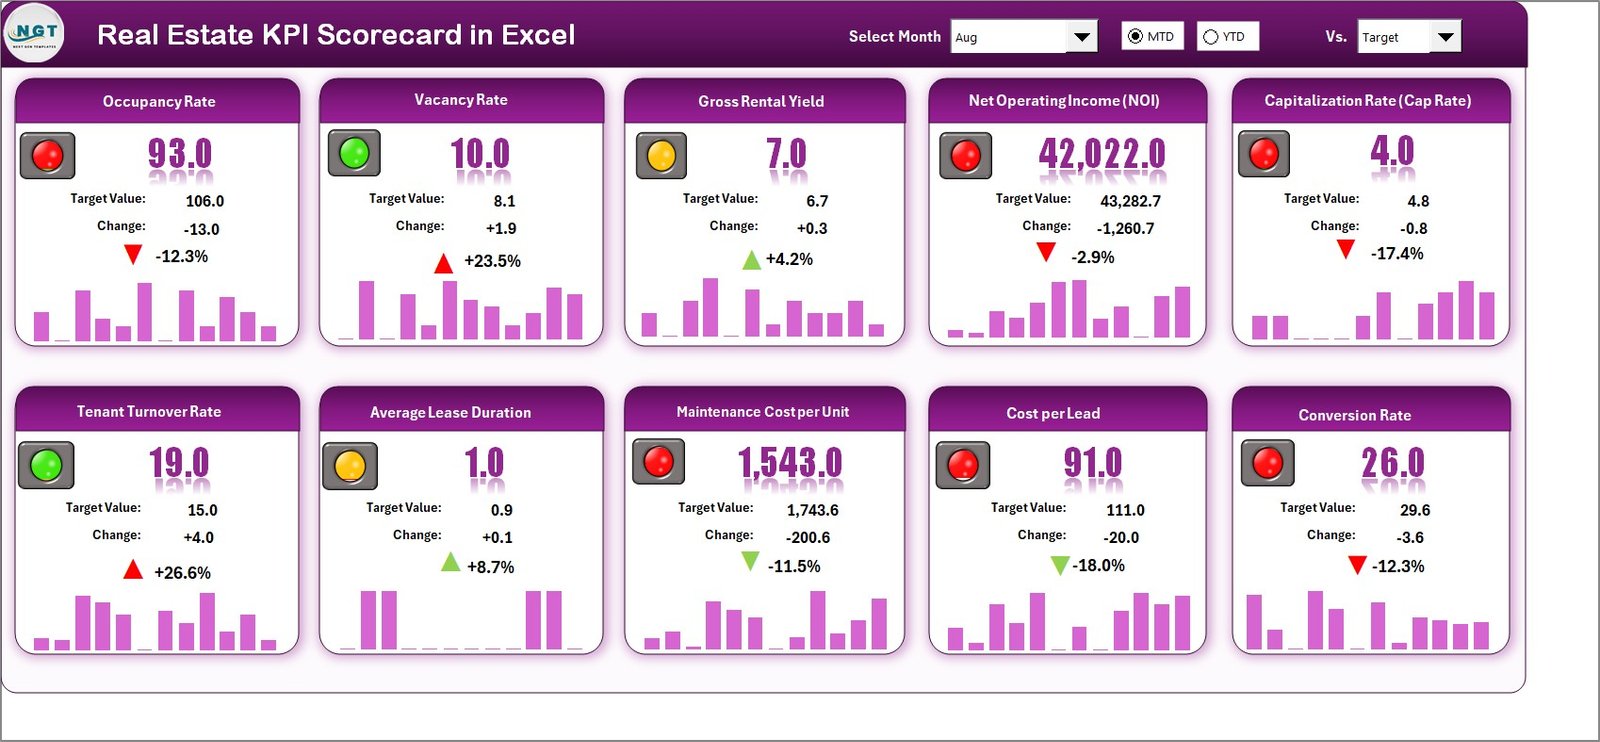
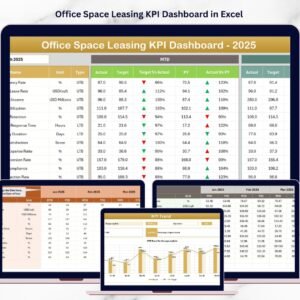
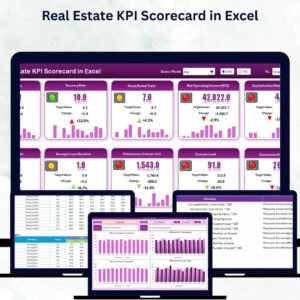
📊 Interactive Scorecard Sheet – The main dashboard lets you view Month-to-Date (MTD) and Year-to-Date (YTD) results. Use dropdowns to select your month and instantly compare Actual vs Target values.
-
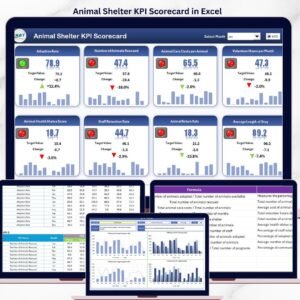
🎯 Color-Coded Visuals – Instantly identify areas of improvement with traffic-light indicators (green for excellent, red for below target).
-
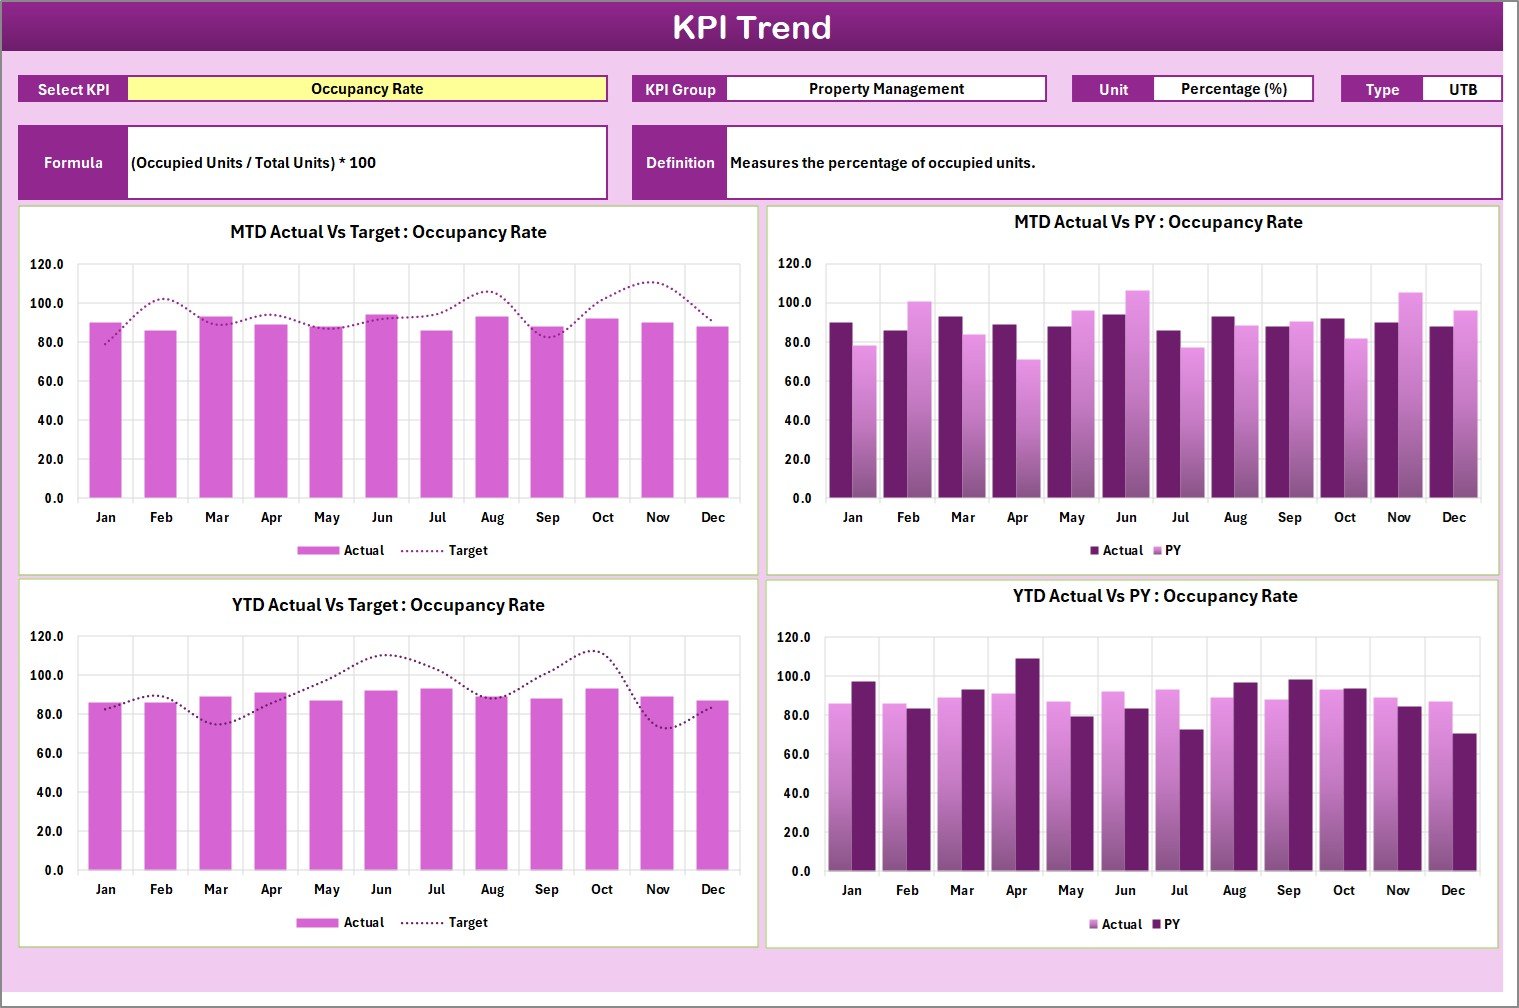
📈 Dynamic KPI Trend Sheet – Analyze the performance of individual KPIs over time with auto-updating trend charts and comparative visuals.
-
⚙️ Automated Calculations – No manual formulas! Just input your data and watch the dashboard auto-refresh.
-
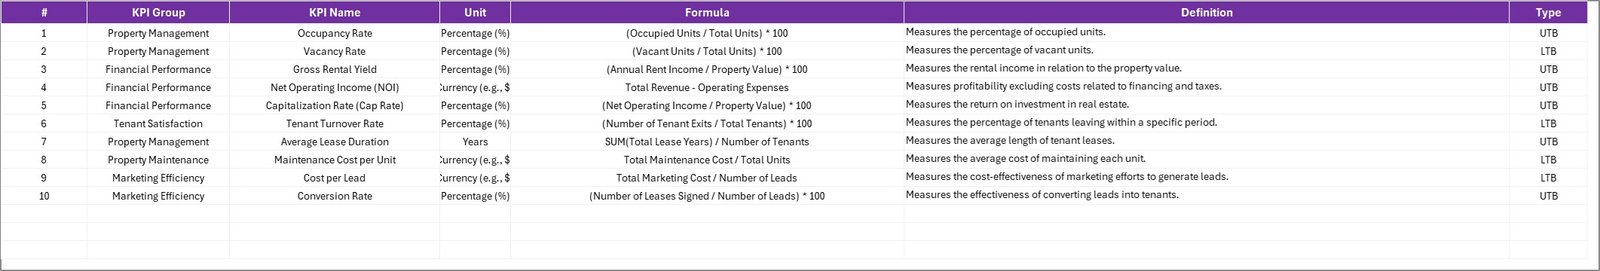
🧩 Data Transparency – Includes a comprehensive KPI Definition Sheet that lists KPI Groups, Units, Formulas, and Definitions.
-
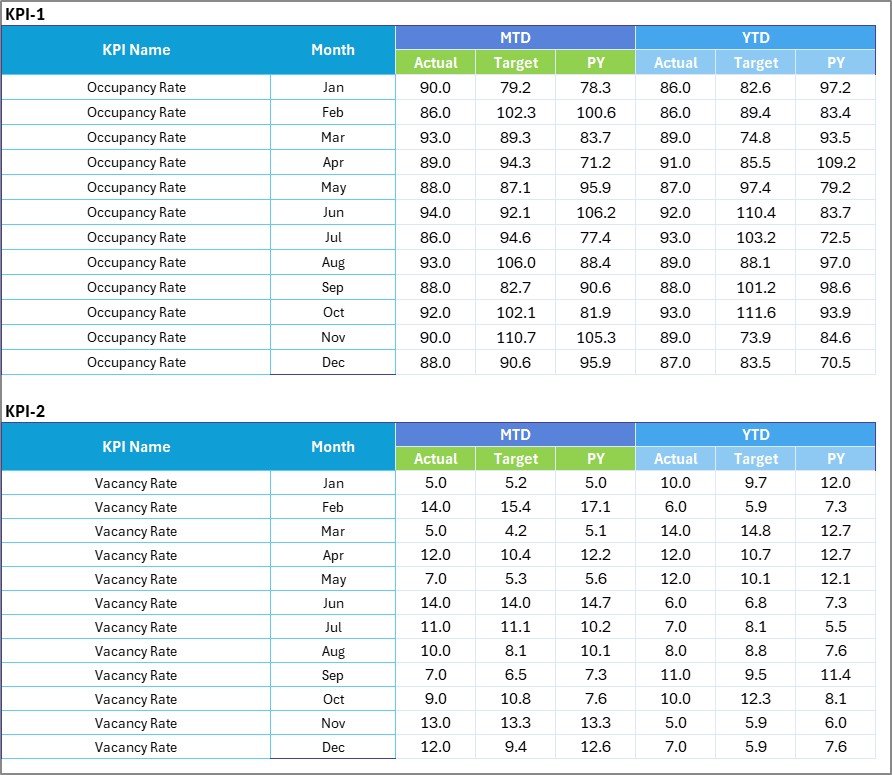
🗂️ Flexible Input Sheet – Update your Actual, Target, and Previous Year data easily each month in a structured table.
-
🧠 Smart Insights – Identify trends, track progress, and make data-backed decisions to improve operational efficiency.

📦 What’s Inside the Real Estate KPI Scorecard in Excel
This professionally designed Excel template includes four functional worksheets:
1️⃣ Scorecard Sheet – Your central performance hub with KPI summaries, comparisons, and visuals.
2️⃣ KPI Trend Sheet – Displays MTD and YTD trends using dynamic charts and dropdown selection.
3️⃣ Input Data Sheet – The data backbone where you enter monthly Actual, Target, and PY values.
4️⃣ KPI Definition Sheet – Ensures consistent understanding with clear KPI names, formulas, and units.
Each tab is fully linked, so data entered in one place automatically updates across the workbook — ensuring accuracy, speed, and consistency.
🧭 How to Use the Real Estate KPI Scorecard in Excel
1️⃣ Enter Data – Input your Actual, Target, and Previous Year data in the Input Data Sheet.
2️⃣ Define KPIs – Review or customize KPI definitions and formulas in the KPI Definition Sheet.
3️⃣ View Dashboard – Open the Scorecard Sheet, choose a month, and view instant results.
4️⃣ Analyze Trends – Switch to the KPI Trend Sheet to identify performance shifts and patterns.
5️⃣ Take Action – Use insights to realign strategies, optimize spending, or improve performance.
No coding, no macros — just plug in your data and start tracking immediately!Real Estate KPI Scorecard in Excel
👥 Who Can Benefit from This Real Estate KPI Scorecard
-
🏢 Property Managers – Track occupancy, rent collection, and maintenance KPIs in real time.
-
🏗️ Developers – Monitor project budgets, progress rates, and profitability indicators.
-
🏬 Commercial Real Estate Firms – Measure leasing performance and client retention trends.
-
🏘️ Residential Agents – Analyze sales conversions, listing status, and revenue metrics.
-
🏦 Corporate Teams – Assess cost per square foot, facility utilization, and department-wise efficiency.
This scorecard brings every stakeholder on the same page with unified data visibility and standardized metrics.
🌟 Why Choose This Template
-
Fully editable and beginner-friendly
-
Works seamlessly in all Excel versions
-
One-time purchase — lifetime access
-
Ideal for professionals seeking quick, accurate KPI tracking without technical complexity


Reviews
There are no reviews yet.