In the fast-moving world of energy trading, data is power. Every decision — from buying electricity and gas to forecasting renewable supply — depends on accurate, timely insights. The Energy Trading KPI Dashboard in Power BI delivers a smart, visual, and fully automated solution to monitor your trading performance, profitability, and operational efficiency in one place.
Built entirely in Power BI and powered by Excel data, this dashboard helps traders, analysts, and executives make data-driven decisions faster. It transforms complex datasets into interactive charts and KPIs, providing clear insights into trading margins, volumes, prices, and performance trends — without requiring any coding or database setup.
⚙️ Key Features of Energy Trading KPI Dashboard in Power BI
-
⚡ Three Interactive Pages — Summary, KPI Trend, and KPI Definition.
-
📊 Real-Time KPI Visualization — Instantly view actual, target, and previous-year metrics.
-
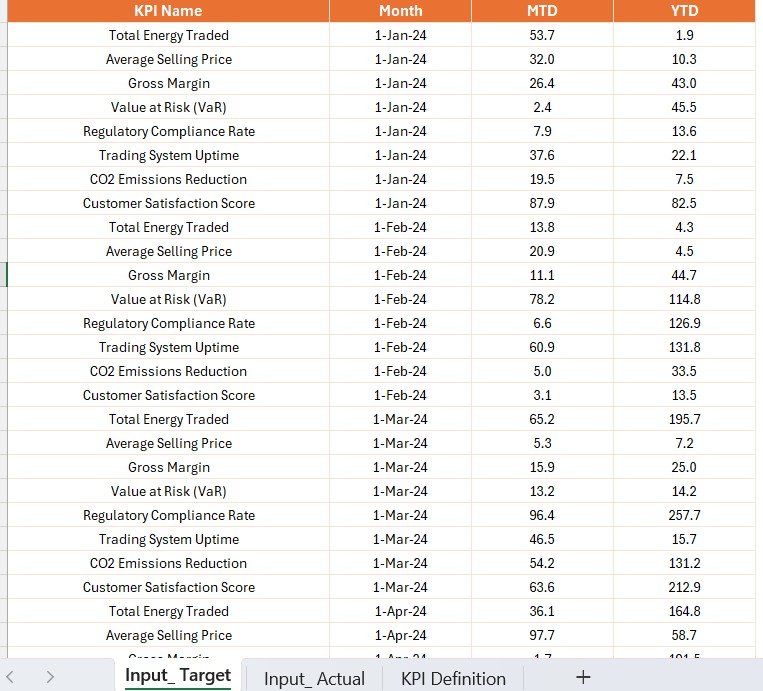
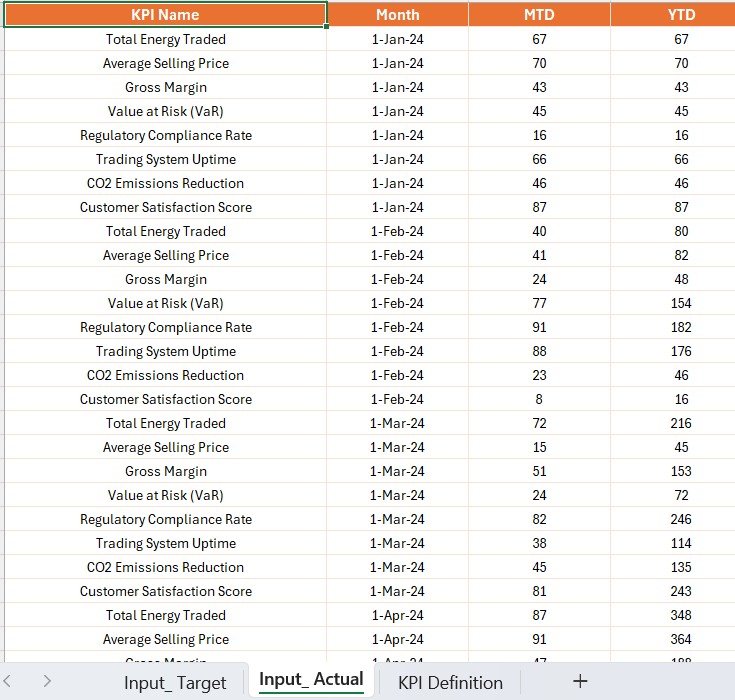
🧮 Excel-Powered Data Model — Simple to update with Actuals, Targets, and KPI Definitions.
-
🧩 Dynamic Slicers — Filter by Month or KPI Group for focused analysis.
-
📈 Trend Tracking — Compare monthly and yearly trends to identify performance shifts.
-
🎯 Performance Cards — View Total KPIs, MTD Target Met, and MTD Target Missed in one glance.
-
🟢 Conditional Formatting — Green and red arrows automatically highlight KPI status.
-
🔄 Drill-Through Functionality — Understand KPI definitions and formulas with a single click.
-
💼 Customizable KPIs — Add, edit, or remove metrics directly from Excel.
-
🌍 Industry Ready — Suitable for power, oil, gas, and renewable energy trading firms.
📂 What’s Inside the Energy Trading KPI Dashboard
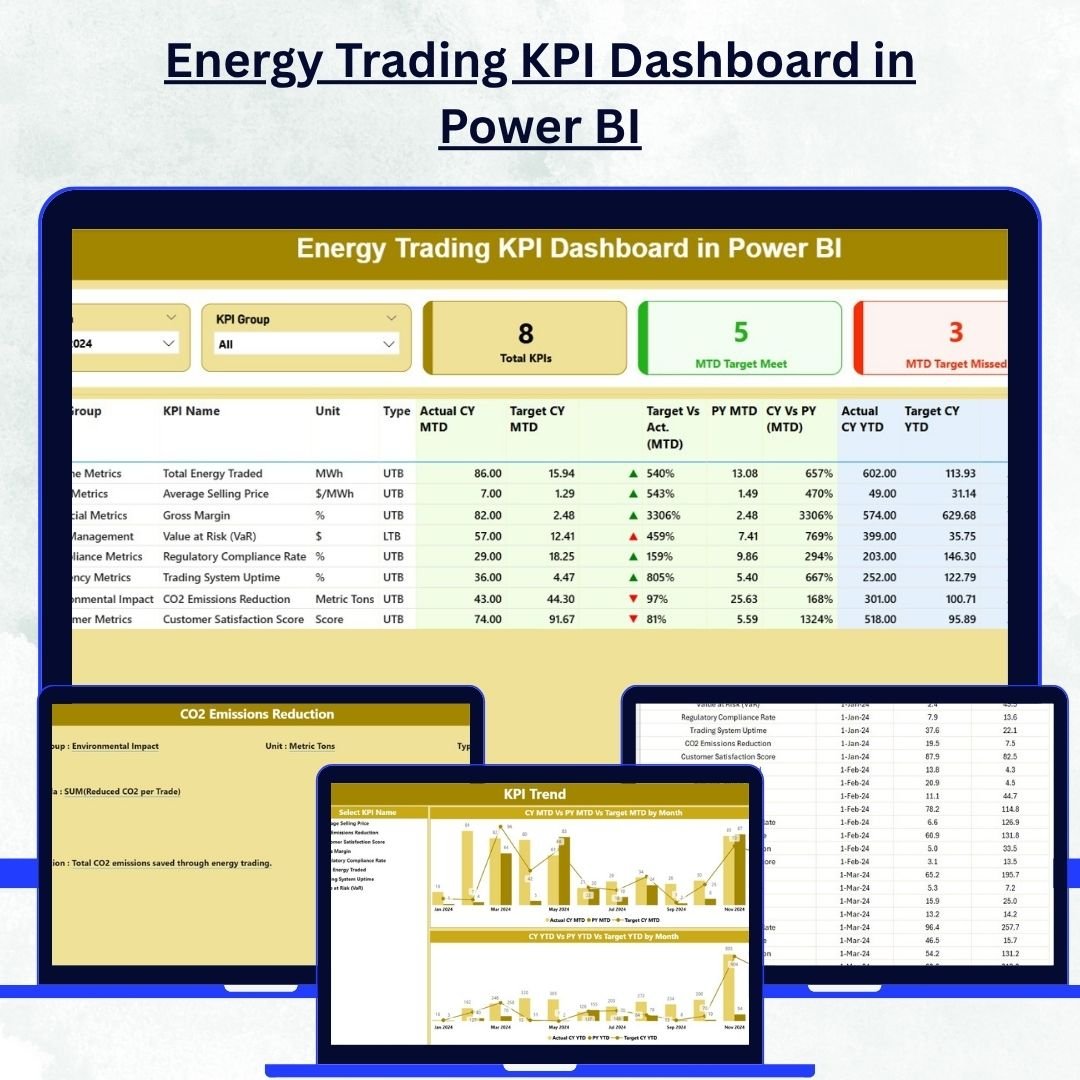
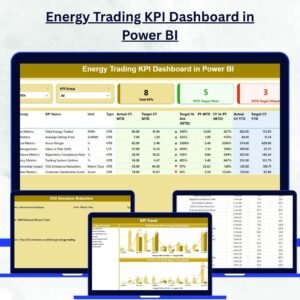
1️⃣ Summary Page – Performance Overview
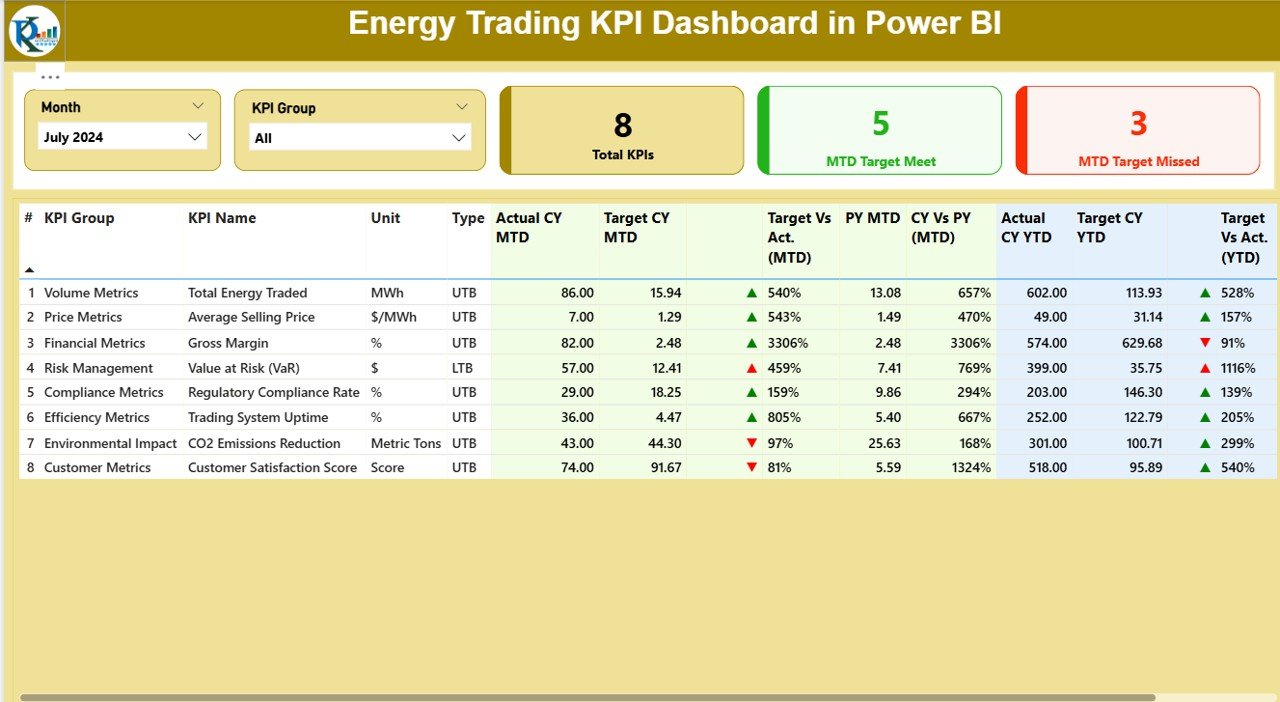
The Summary Page is your control center, showing high-level insights at a glance.
-
KPI Cards: Display total KPI count, KPIs meeting MTD targets, and KPIs missing targets.
-
Dynamic Filters: Choose Month and KPI Group to narrow the focus.
-
Comprehensive Table: Includes KPI Name, Group, Unit, Type (UTB/LTB), Actuals, Targets, Variance %, and Year-over-Year Comparison.
This page provides instant visibility into where your trading operation stands today.
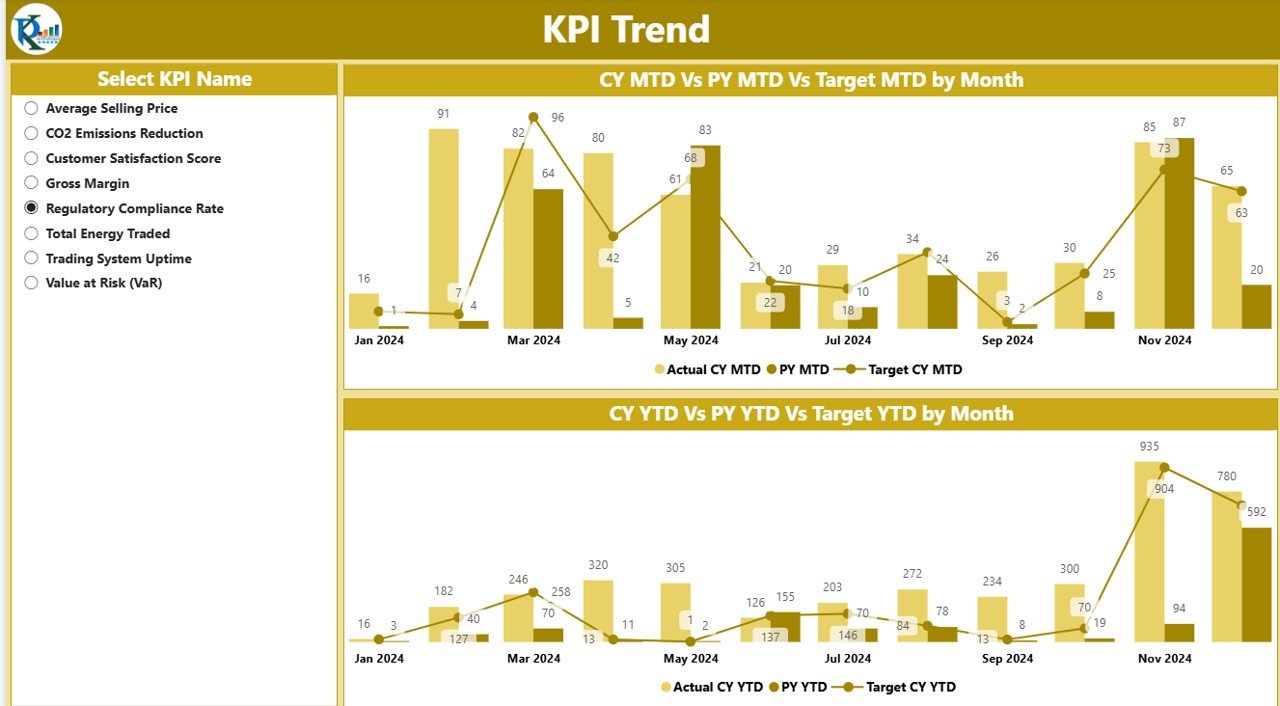
2️⃣ KPI Trend Page – Track Performance Over Time
Understand long-term trends with interactive combo charts.
-
MTD Chart: Compare Actual vs Target vs Previous Year for current-month data.
-
YTD Chart: Analyze cumulative trends across the year.
-
Slicers: Choose any KPI to visualize its monthly performance.
Example insights:
✅ A rising Trade Margin per MWh means improved profitability.
⚠️ A drop in Price Forecast Accuracy signals a need for model recalibration.
🌱 A steady Renewable Energy Purchase Ratio highlights sustainability progress.
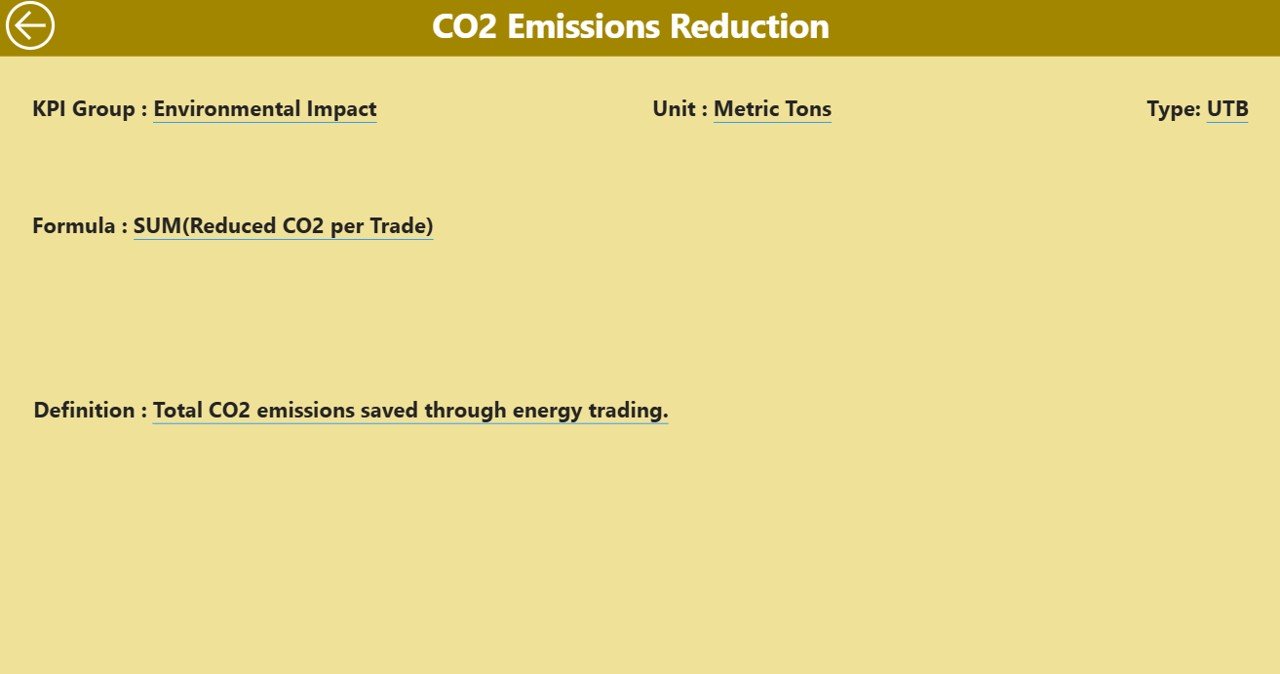
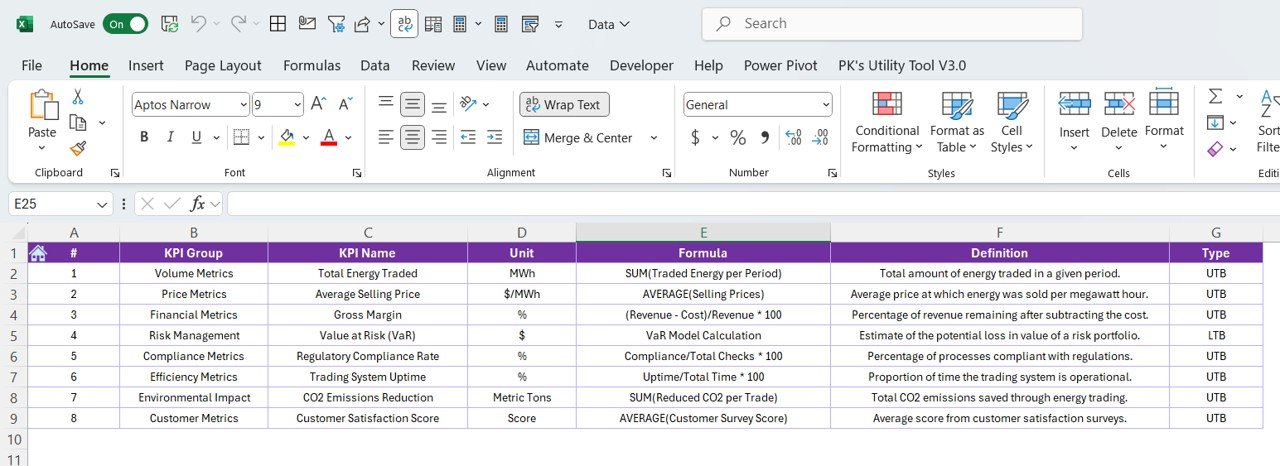
3️⃣ KPI Definition Page – Your Data Dictionary
Transparency matters. This page documents every KPI with its:
-
KPI Number & Name
-
KPI Group
-
Unit of Measurement
-
Formula
-
Definition
-
Type (Lower or Upper the Better)
This ensures everyone — from analysts to leadership — interprets KPIs consistently.
🧠 How to Use the Dashboard
-
Enter Data in Excel: Fill in Actual, Target, and KPI Definition sheets.
-
Connect to Power BI: Load the data into the Power BI file.
-
Refresh: Update visuals with one click for real-time accuracy.
-
Filter and Analyze: Use slicers to drill down by month or category.
-
Drill Through: Click any KPI to open its detailed definition page.
-
Share Results: Export visuals or publish to Power BI Service for team collaboration.
👥 Who Can Benefit from This Dashboard
-
⚙️ Energy Traders: Track profitability, trading volume, and price performance.
-
💹 Finance Teams: Analyze revenue per MWh, margins, and cost efficiency.
-
📊 Risk Managers: Monitor volatility, exposure, and target achievement.
-
🌍 Sustainability Analysts: Evaluate renewable participation ratios.
-
💼 Executives: Access real-time insights for faster strategic decisions.
Whether you’re trading oil, gas, electricity, or renewables — this dashboard adapts to your energy business.
🚀 Why Choose This Dashboard
✅ Real-time energy trading performance insights
✅ Eliminates manual reporting with automated visuals
✅ Easy Excel-based data management
✅ Tracks MTD, YTD, and YoY performance
✅ Fully customizable metrics and groups
✅ No coding, no database — just Power BI simplicity
This dashboard helps energy businesses move from reactive monitoring to proactive decision-making — all through the power of data visualization.
📖 Click here to read the Detailed blog post
👉 Visit our YouTube channel to learn step-by-step video tutorials


Reviews
There are no reviews yet.