


In today’s fast-changing world, Green Building KPI Dashboard it’s essential. Organizations are under immense pressure to reduce their environmental footprint, optimize energy and water usage, and achieve compliance with green regulations. But how do you track and manage all these sustainability KPIs in one place without getting lost in endless spreadsheets?
The answer is simple: Green Building KPI Dashboard in Power BI 🚀.
This ready-to-use Power BI dashboard transforms raw Excel data into interactive visuals that highlight key sustainability metrics. It’s designed to help businesses analyze performance, compare actuals vs. targets, and identify improvement areas with just a few clicks. Whether you manage a single office building or an entire real estate portfolio, this dashboard empowers you to make data-driven decisions for a greener tomorrow.
🌟 Key Features of Green Building KPI Dashboard in Power BI
-
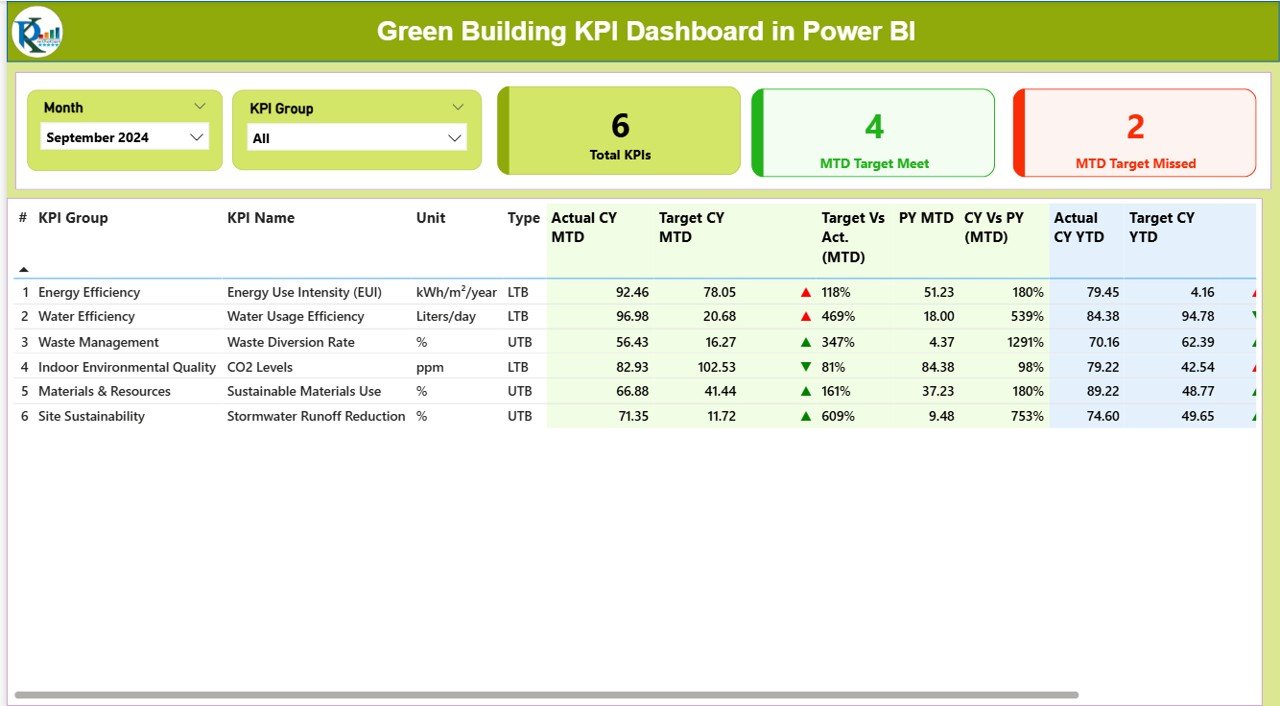
📊 Summary Page: Get a quick snapshot of KPI performance with cards, slicers, and detailed tables. Track MTD (Month-to-Date) and YTD (Year-to-Date) results instantly.
-
📈 KPI Trend Page: Analyze sustainability performance over time with interactive combo charts comparing actuals vs. targets, current year vs. previous year.
-
📑 KPI Definition Page: Access detailed KPI descriptions, formulas, and metadata with drill-through functionality.
-
🔗 Excel Integration: Seamlessly connect to structured Excel files for Actuals, Targets, and KPI Definitions.
-
🎯 Performance Icons: Instantly see whether you’re meeting goals with green ▲ or red ▼ indicators.
-
📱 User-Friendly: Navigate easily with slicers, filters, and drill-throughs—even for non-technical users.
📦 What’s Inside the Green Building KPI Dashboard
When you download this product, you’ll get:
-
A Power BI file with three pages: Summary, KPI Trend, and KPI Definition.
-
A structured Excel dataset with three sheets:
-
Input_Actual: Actual KPI values (MTD & YTD).
-
Input_Target: Target KPI values (MTD & YTD).
-
KPI_Definition: KPI Number, Group, Name, Unit, Formula, Type (LTB/UTB).
-
-
Built-in conditional formatting, slicers, and charts for instant insights.
-
A ready-to-use framework that you can customize to your business needs.
🛠 How to Use the Green Building KPI Dashboard
-
Update Excel Data: Enter your monthly actuals and targets in the provided Excel sheets.
-
Load into Power BI: The dashboard automatically connects and updates visuals.
-
Filter & Explore: Use Month and KPI Group slicers to narrow results.
-
Analyze Trends: Compare current year vs. previous year across multiple KPIs.
-
Drill into Definitions: Understand each KPI’s formula, unit, and type.
-
Make Decisions: Use real-time visuals to align operations with sustainability goals.
No coding required—just update Excel regularly and let Power BI do the heavy lifting! ⚡
👥 Who Can Benefit from This Dashboard
This dashboard is perfect for:
-
🏢 Corporate Offices → Monitor energy usage, recycling rates, and compliance.
-
🏭 Manufacturing Plants → Track emissions, waste reduction, and resource use.
-
🎓 Educational Institutions → Ensure sustainable campus operations.
-
🏨 Hospitality Industry → Optimize water and energy use across properties.
-
🌐 Government & NGOs → Measure sustainability progress in infrastructure projects.
-
📈 Small Businesses → Even small offices can track green KPIs easily.
If your organization is working toward green certifications, cost savings, or corporate sustainability goals, this dashboard is your ultimate companion.
📖 Click here to read the Detailed Blog Post
🎥 Visit our YouTube channel to learn step-by-step video tutorials


Reviews
There are no reviews yet.