
Managing logistics is one of the most complex and critical functions in supply chain operations. From monitoring inventory accuracy to controlling transportation costs and ensuring on-time deliveries, every detail matters. Without proper tracking, businesses risk delays, higher costs, and dissatisfied customers.
That’s why we created the Logistics KPI Dashboard in Excel — a ready-to-use, cost-effective solution that transforms raw logistics data into visual insights. With structured worksheets, powerful charts, and automation-friendly design, this tool empowers managers to make faster, smarter, and data-driven decisions.
✨ Key Features of the Logistics KPI Dashboard in Excel
-
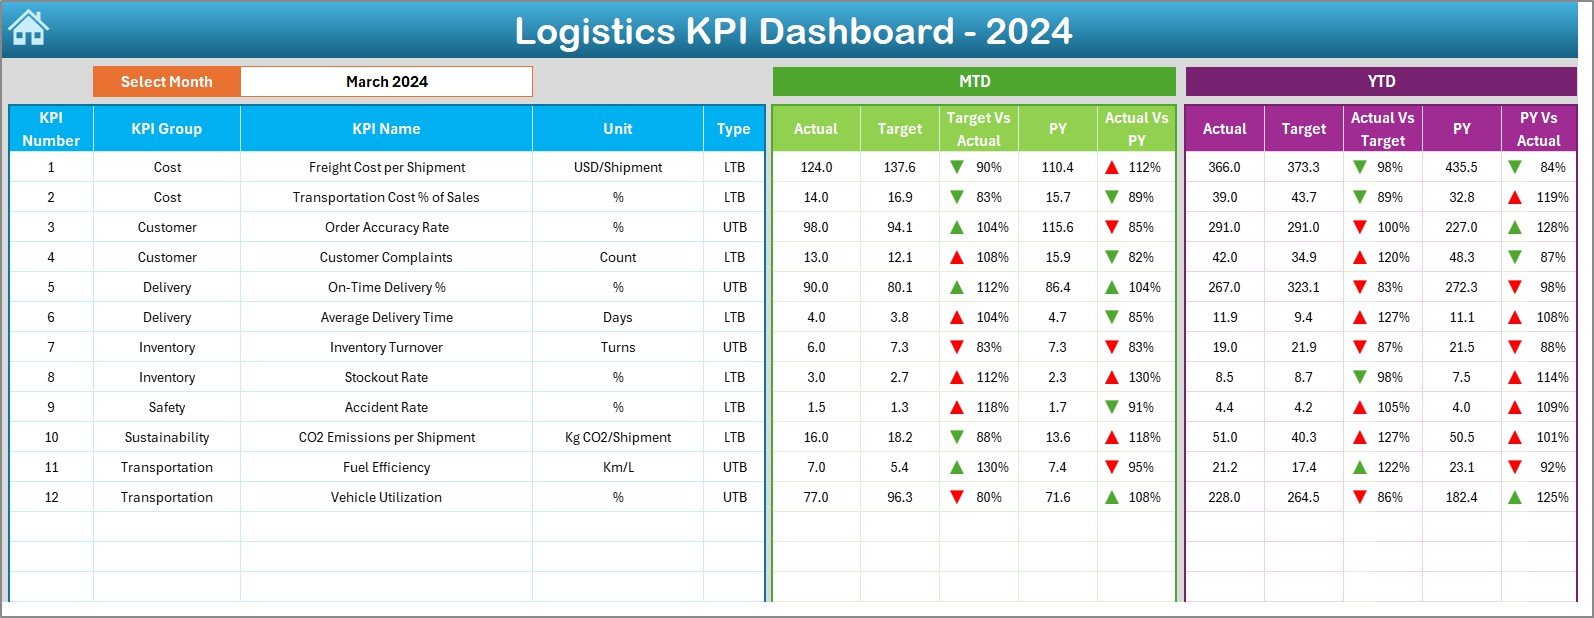
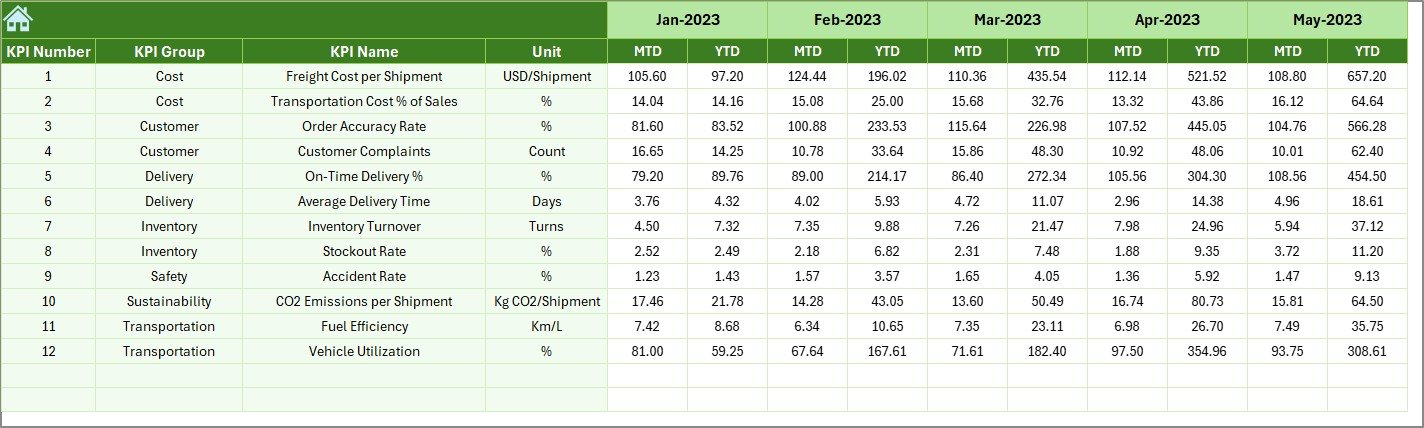
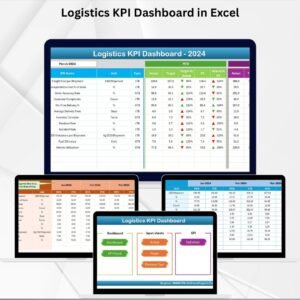
📊 Interactive Dashboard Sheet – Displays all KPIs with Month-to-Date (MTD) and Year-to-Date (YTD) comparisons.
-
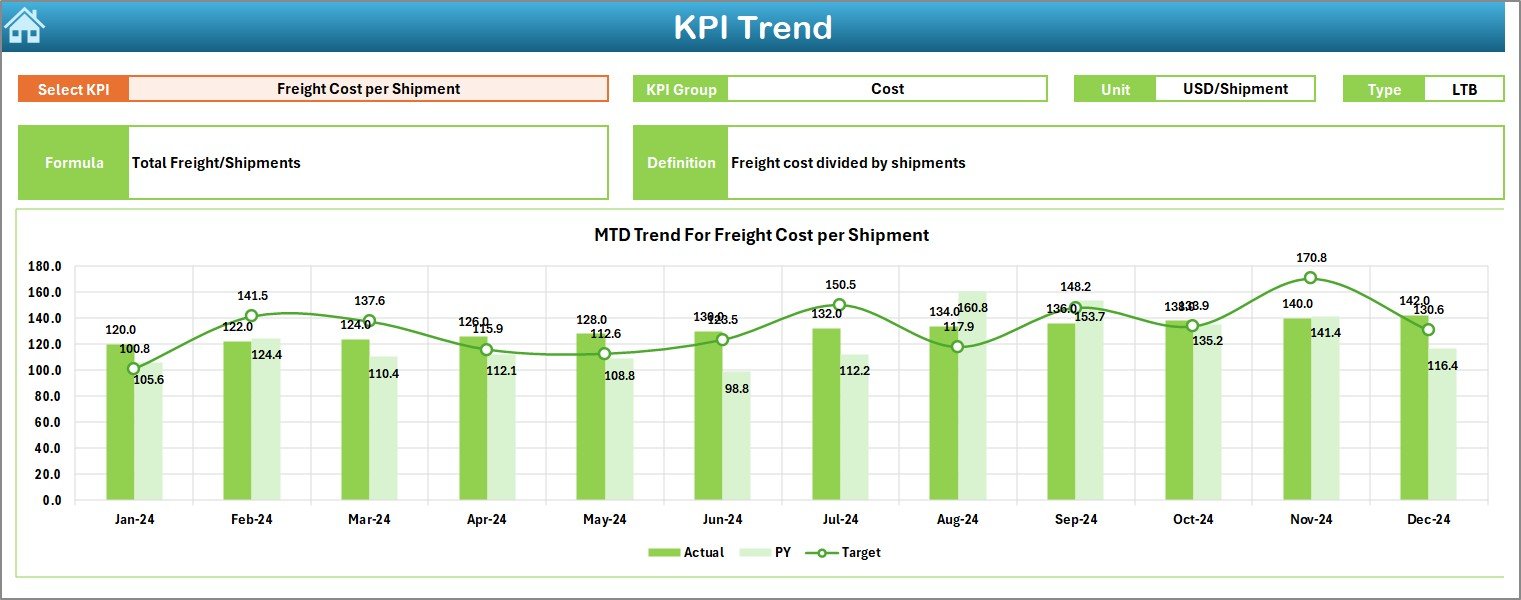
📉 Trend Analysis – KPI Trend Sheet provides insights into historical patterns with Actual vs Target vs Previous Year metrics.
-
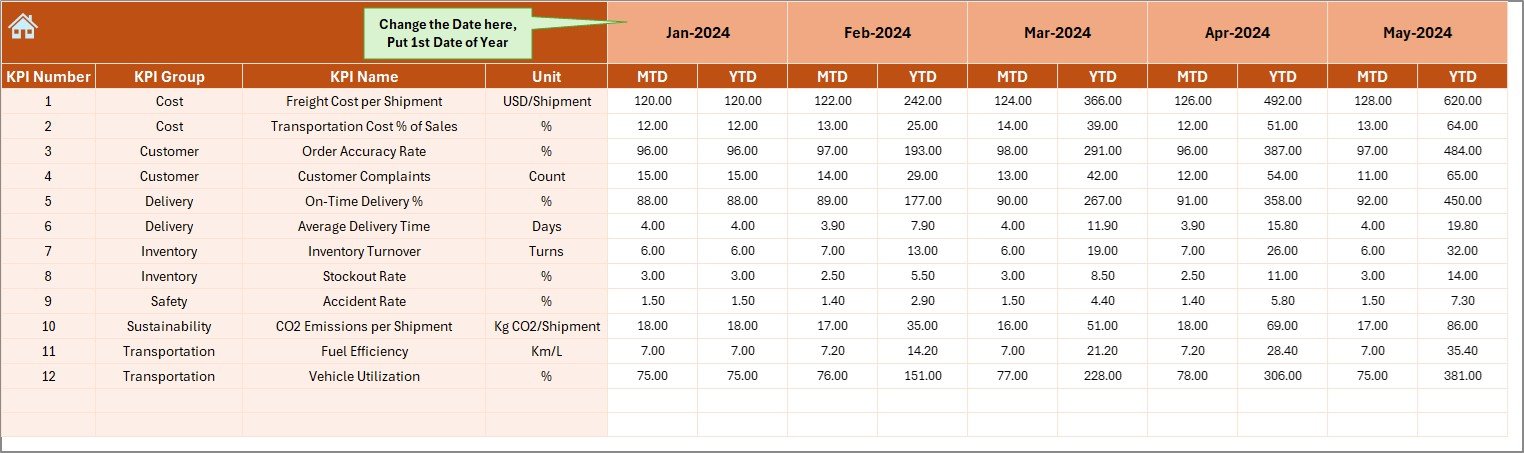
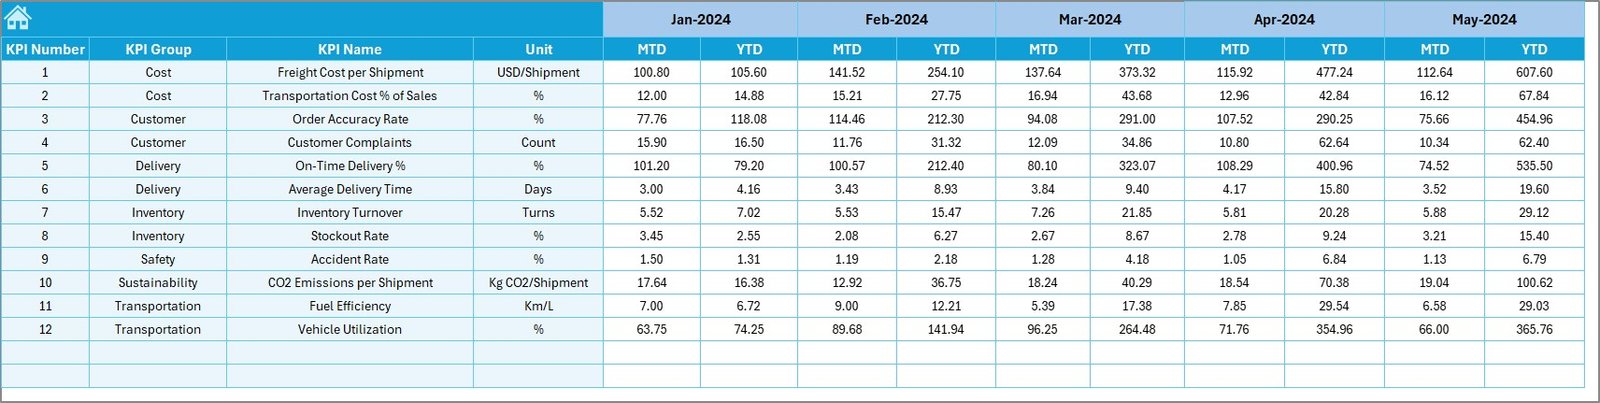
📝 Data Input Sheets – Separate tabs for Actual Numbers, Targets, and Previous Year data ensure clean and structured inputs.
-
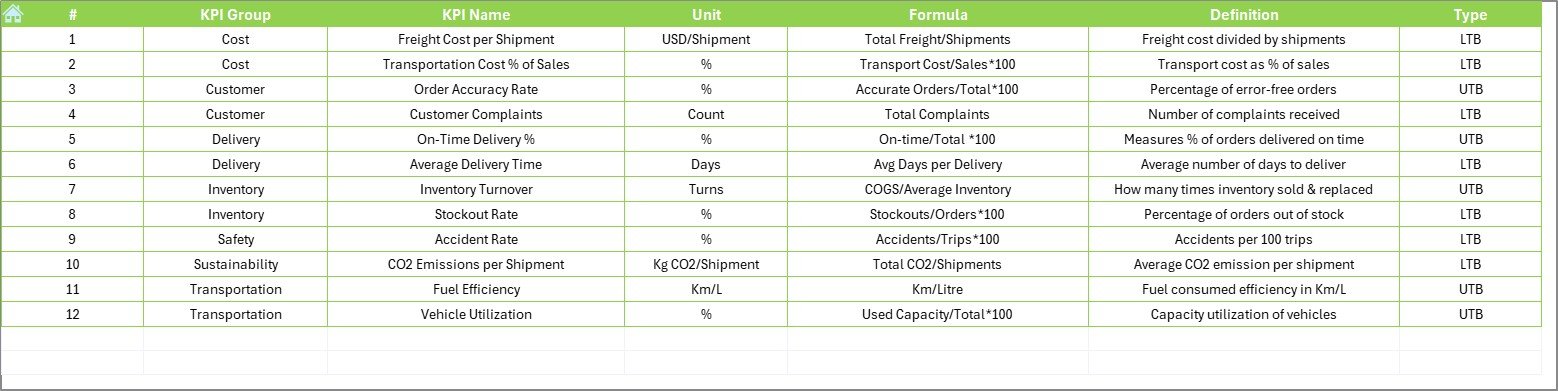
📚 KPI Definition Sheet – Standardized reference with KPI name, group, unit, formula, and definition.
-
🔄 Dynamic Updates – Change the month selector, and all KPI values update instantly.
-
✅ Conditional Formatting – Green ↑ and red ↓ arrows highlight whether KPIs meet or miss targets.
-
🖱️ Easy Navigation – Home Sheet with buttons to jump directly to relevant sections.
📦 What’s Inside the Dashboard Template
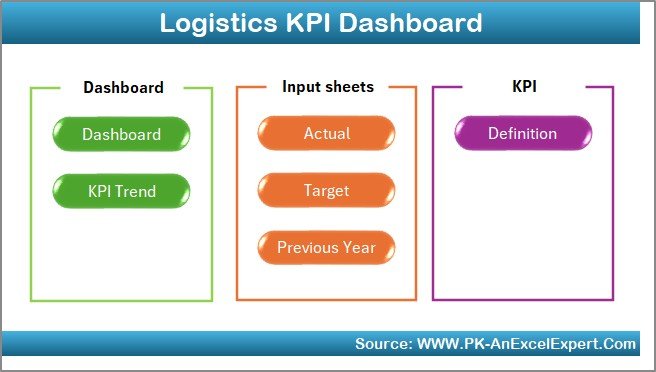
The template includes seven worksheet tabs, each with a defined purpose:
-
Home Sheet – Acts as the index page with navigation buttons.
-
Dashboard Sheet – The main visualization area with KPI cards, charts, and comparisons.
-
KPI Trend Sheet – Analyze performance trends for selected KPIs.
-
Actual Numbers Input Sheet – Enter current year performance data.
-
Target Sheet – Set monthly and yearly KPI benchmarks.
-
Previous Year Numbers Sheet – Store last year’s values for historical comparisons.
-
KPI Definition Sheet – Provides clarity and consistency for all KPIs.
This structure makes it easy to use, scalable, and ideal for logistics teams across industries.
🛠️ How to Use the Logistics KPI Dashboard
-
Start at the Home Sheet – Use buttons to navigate quickly.
-
Enter Targets – Fill in KPI targets on the Target Sheet.
-
Input Historical Data – Populate Previous Year Numbers Sheet for comparison.
-
Update Actuals – Enter MTD and YTD values on the Actual Numbers Input Sheet.
-
Analyze Dashboard – View KPI performance with instant visual updates.
-
Check Trends – Use KPI Trend Sheet to understand long-term performance patterns.
With this step-by-step flow, logistics managers can keep a real-time pulse on their operations.
👥 Who Can Benefit from This Dashboard?
-
Warehouse Managers – Monitor order picking efficiency, accuracy, and storage utilization.
-
Transport Managers – Track fleet costs, delivery times, and fuel consumption.
-
Customer Service Teams – Measure order accuracy and on-time delivery.
-
Finance Teams – Analyze logistics cost per shipment and financial impact.
-
Operations Managers – Identify bottlenecks and optimize supply chain workflows.
🎯 Advantages of the Logistics KPI Dashboard in Excel
-
📌 Centralized View – All KPIs in one place for easy monitoring.
-
💰 Cost-Effective – Built entirely in Excel; no expensive software required.
-
🛠️ Customizable – Modify KPIs, formulas, or charts to fit business needs.
-
⏳ Time-Saving – Automates reporting with prebuilt formulas and visuals.
-
📈 Data-Driven Insights – Compare Actual vs Target vs Previous Year performance.
-
🌍 Scalable – Works for startups, SMEs, and large enterprises.
🚀 Opportunities for Improvement
-
🔄 Automate updates with Power Query or VBA macros.
-
☁️ Enable real-time collaboration via OneDrive or Google Drive.
-
📡 Integrate with ERP/WMS systems for live data feeds.
-
📊 Add Power BI for advanced visualization and big-data scalability.
🏆 Best Practices for Using the Dashboard
-
Define KPIs clearly and share with all teams.
-
Focus only on the most impactful KPIs.
-
Use conditional formatting to highlight urgent issues.
-
Keep data entry standardized with dropdowns.
-
Update monthly (or weekly) for accurate reporting.
-
Review trends over time to predict and prevent bottlenecks.


Reviews
There are no reviews yet.