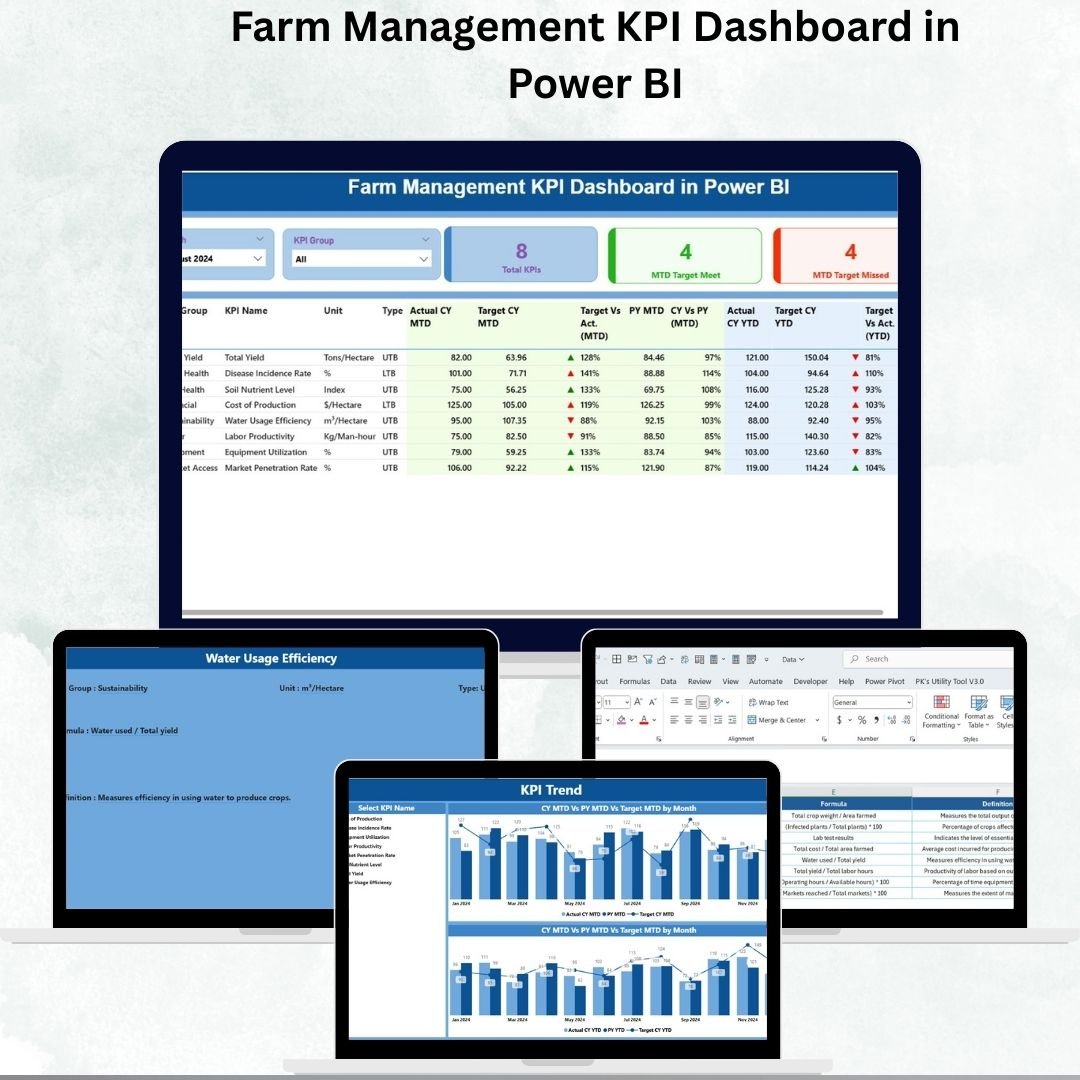
Farm Management KPI Dashboard in Power BI 🚜📊🌱
Modern farming is no longer just about intuition—it’s about data-driven decision-making. Farmers, agribusiness managers, and stakeholders need clear, actionable insights into performance, resources, and sustainability. The Farm Management KPI Dashboard in Power BI is a ready-to-use solution designed to give you complete visibility into your farm operations.
Built with Power BI and powered by a structured Excel data source, this interactive dashboard enables you to track crop yields, livestock health, resource efficiency, and financial performance—all in one place. With real-time monitoring, trend analysis, and visual KPIs, you can make smarter decisions that improve profitability and resilience.
✨ Key Features of the Farm Management KPI Dashboard
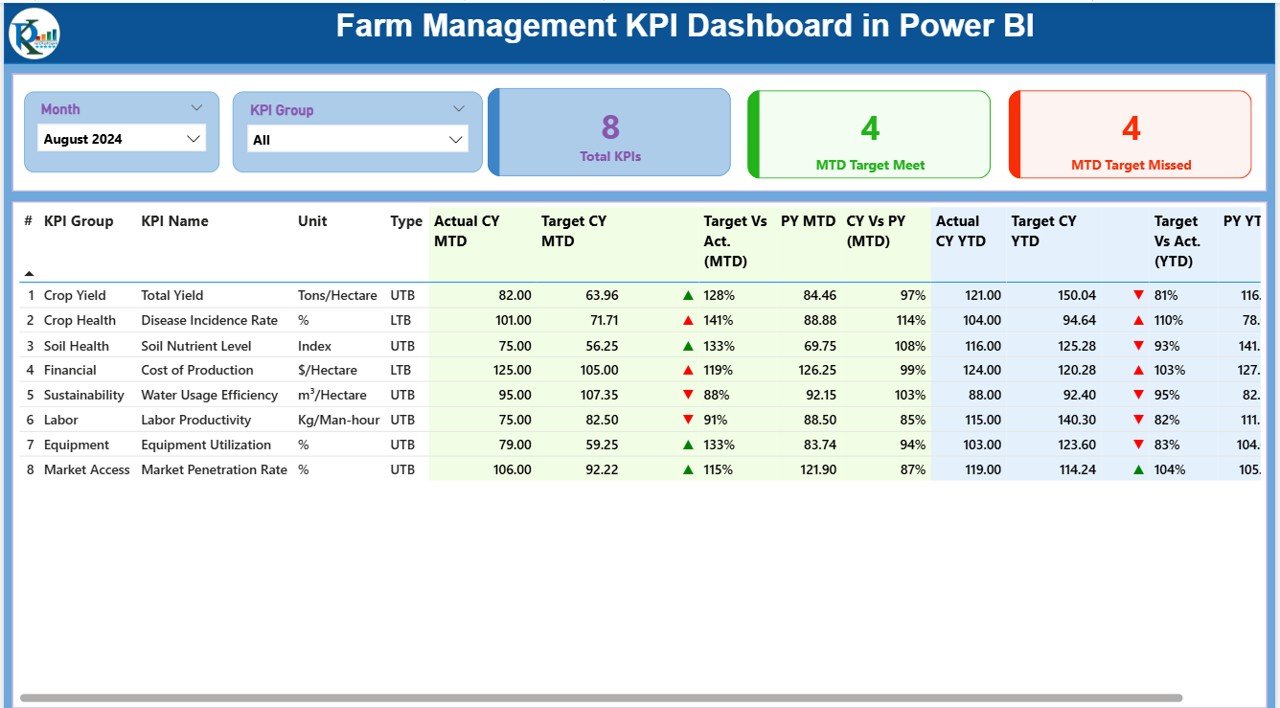
📌 Summary Page – At-a-Glance Farm Insights
-
Month and KPI Group slicers for quick filtering.
-
KPI cards for Total Count, MTD Targets Met, and MTD Targets Missed.
-
Detailed KPI table with:
-
KPI Number, Name, and Group (Crops, Livestock, Finance, Sustainability).
-
Unit of Measurement and Type (LTB = Lower the Better, UTB = Upper the Better).
-
Actual vs Target values for MTD and YTD.
-
Previous Year comparisons.
-
Green ▲ and red ▼ icons for instant performance tracking.
-
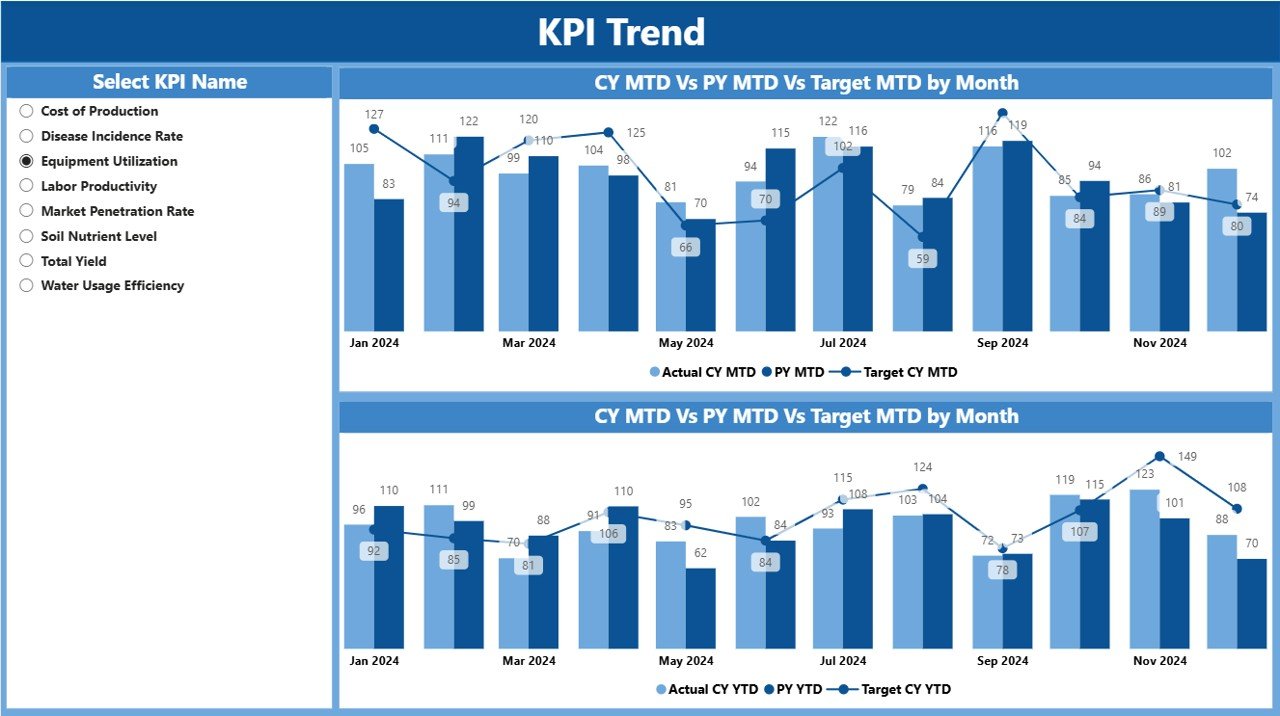
📊 KPI Trend Page – Track Patterns Over Time
-
Combo charts showing Actual vs Target for MTD and YTD.
-
Side-by-side comparisons for Current Year, Previous Year, and Targets.
-
Slicer for selecting individual KPIs.
-
Spot issues early, like rising fertilizer costs or declining yields.
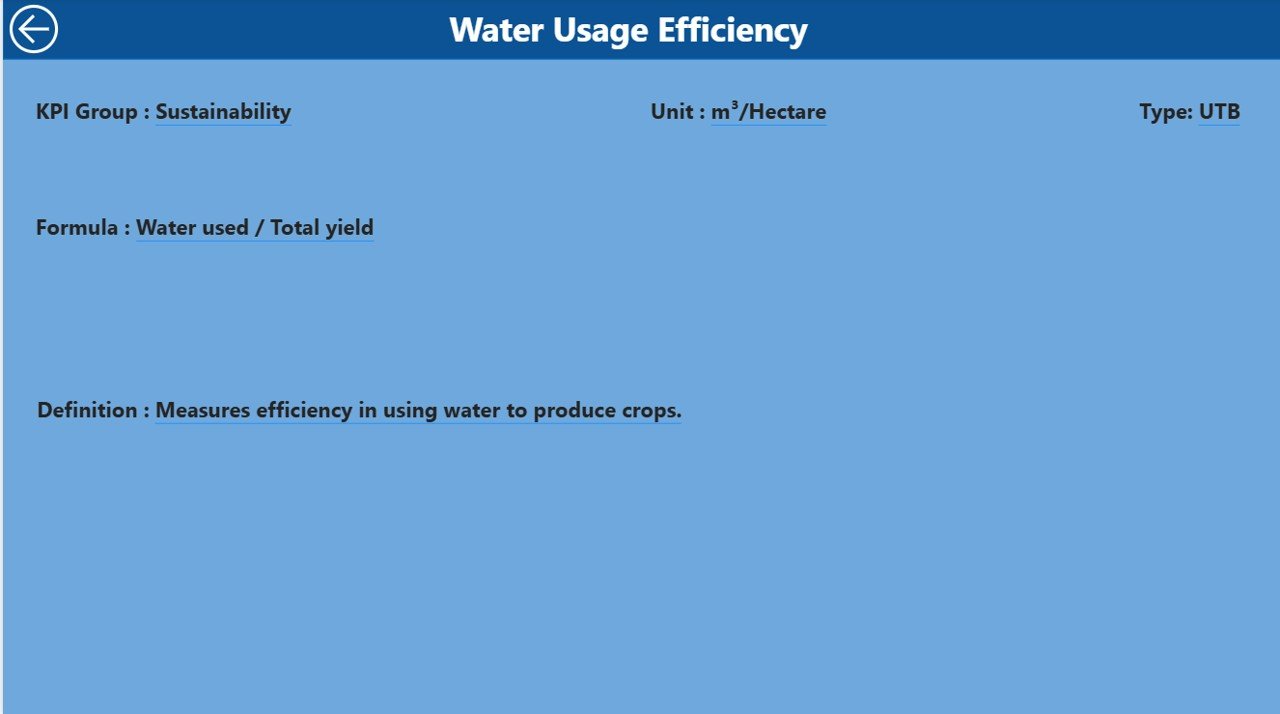
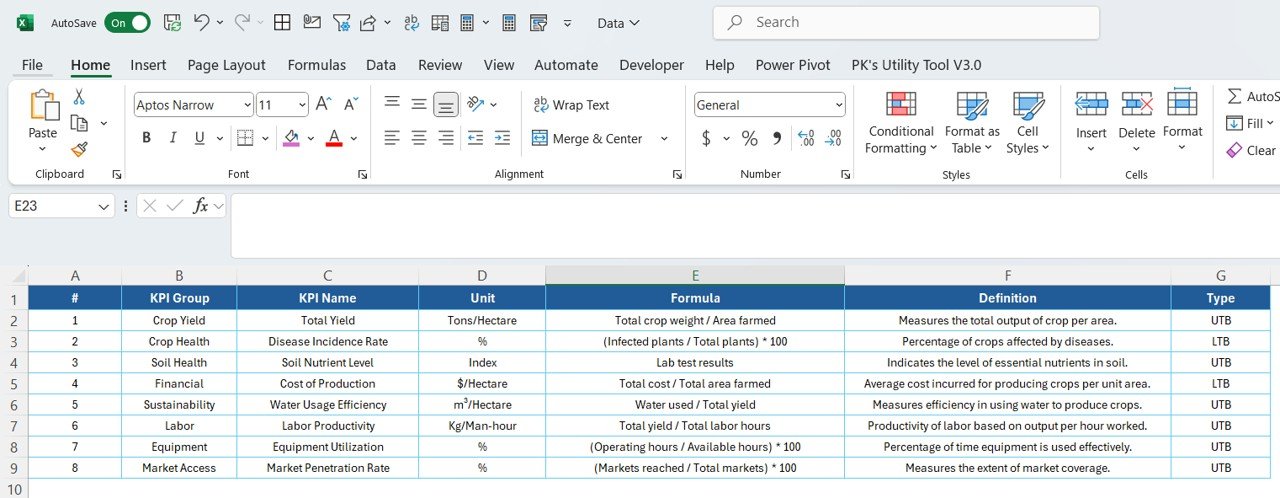
📖 KPI Definition Page – Clarity for Every Metric
-
Drill-through details for each KPI.
-
KPI formulas and definitions explained.
-
Ensures consistency across all farm managers and stakeholders.
-
Easy navigation with a built-in back button.
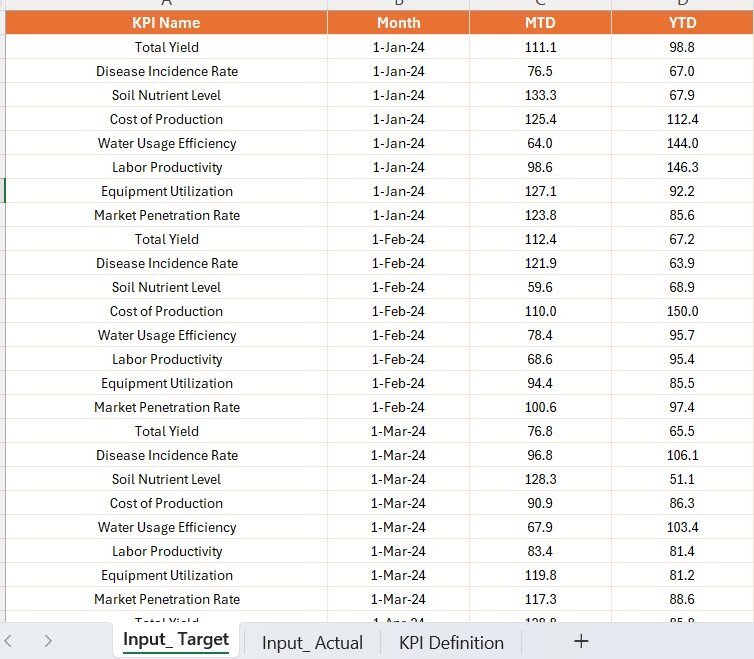
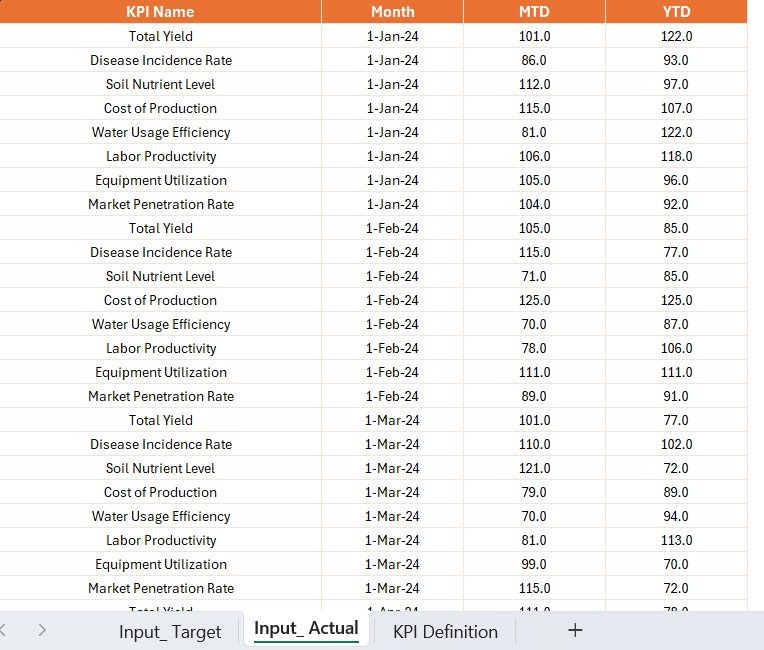
📑 Excel Data Source – Simple & Flexible
-
Input_Actual Tab – Enter MTD and YTD actual performance.
-
Input_Target Tab – Record monthly targets for all KPIs.
-
KPI Definition Tab – Store KPI metadata, formulas, and type (LTB/UTB).
-
Seamlessly connects with Power BI for automatic refresh and updates.
✅ Advantages of the Farm Management KPI Dashboard
-
🌍 Centralized Monitoring – All KPIs in one dashboard.
-
⚡ Real-Time Insights – Instantly spot variances and risks.
-
📊 Transparent Reporting – Compare MTD, YTD, and Previous Year results.
-
📈 Performance Tracking – Quickly see if targets are being met.
-
🔍 Visual Indicators – Green/red icons highlight problem areas.
-
💡 Forecasting – Identify patterns and predict future outcomes.
-
🌱 Scalability – Works for small farms and large agribusiness operations alike.
-
💻 Ease of Use – Excel-powered input means no steep learning curve.
🔧 Opportunities for Improvement
-
🌦 IoT sensor integration for soil, water, and climate tracking.
-
🐄 Livestock health metrics for more detailed analysis.
-
💧 Advanced sustainability KPIs like water-use efficiency.
-
🤖 AI-driven predictive analytics for yield and cost forecasting.
-
☁ Cloud-based sharing and mobile access for teams on the move.
📌 Best Practices for Using the Dashboard
-
Define Clear KPIs – Track only what matters most to your farm.
-
Update Data Regularly – Refresh Excel inputs monthly or weekly.
-
Segment KPIs – Use groups for crops, livestock, finance, and sustainability.
-
Review Trends – Compare YTD vs Previous Year to evaluate progress.
-
Collaborate – Share reports across teams using Power BI Service.
-
Leverage Automation – Over time, connect with IoT or ERP systems.
👥 Who Can Benefit?
-
Farmers & Growers – Monitor yield, cost, and efficiency daily.
-
Agribusiness Managers – Track financials and sustainability KPIs.
-
Investors & Stakeholders – Gain confidence with transparent reporting.
-
Consultants – Provide data-driven recommendations.
-
Educational Institutions – Teach modern farm management practices.
🚀 Conclusion
The Farm Management KPI Dashboard in Power BI is more than a reporting tool—it’s a farm management powerhouse. By consolidating crop, livestock, financial, and sustainability KPIs into one interactive dashboard, it empowers you to make informed decisions quickly and effectively.
With its Excel-based input structure, intuitive design, and powerful visualization features, this tool is perfect for small farms looking to get started with data-driven management as well as large agribusinesses seeking advanced insights.
In today’s competitive agricultural landscape, managing your farm with data isn’t optional—it’s essential. This dashboard ensures your farm runs efficiently, sustainably, and profitably.


Reviews
There are no reviews yet.