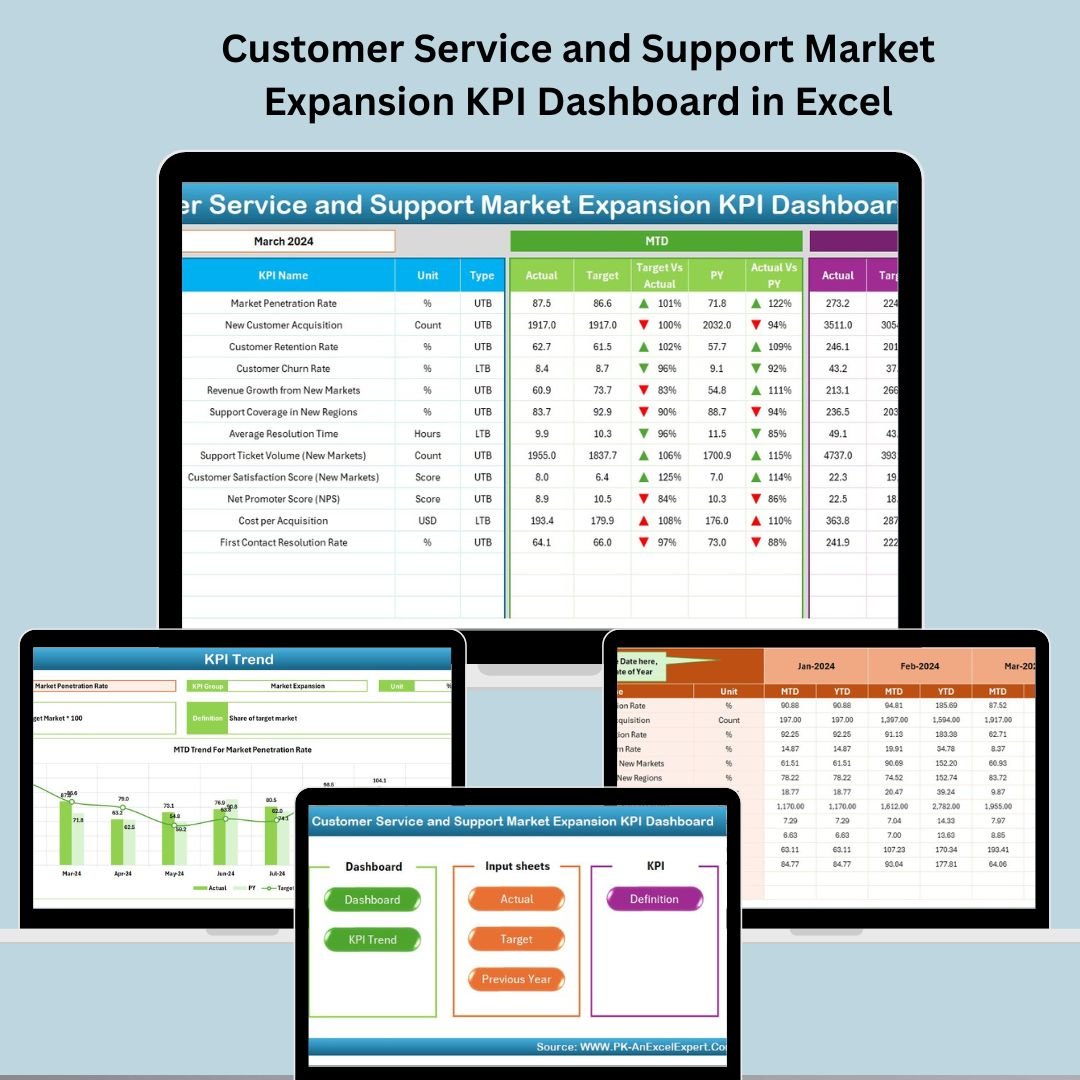
In a business world that moves fast and demands more, your customer service and market expansion strategies must work hand in hand. That’s why we created the Customer Service and Support Market Expansion KPI Dashboard in Excel—a ready-to-use template designed to help you track service performance while scaling into new territories.
This Excel dashboard gives you a 360° view of your KPIs—from support ticket metrics to growth indicators—allowing you to make smarter, data-driven decisions. Whether you’re a startup, mid-sized business, or enterprise leader, this template will help you stay informed, take action, and grow sustainably.
✨ Key Features of Customer Service and Support Market Expansion KPI Dashboard in Excel
🏠 All-in-One Navigation

Start from the Home Sheet, where you can jump to any of the 6 critical dashboards using interactive buttons. Everything is just a click away!
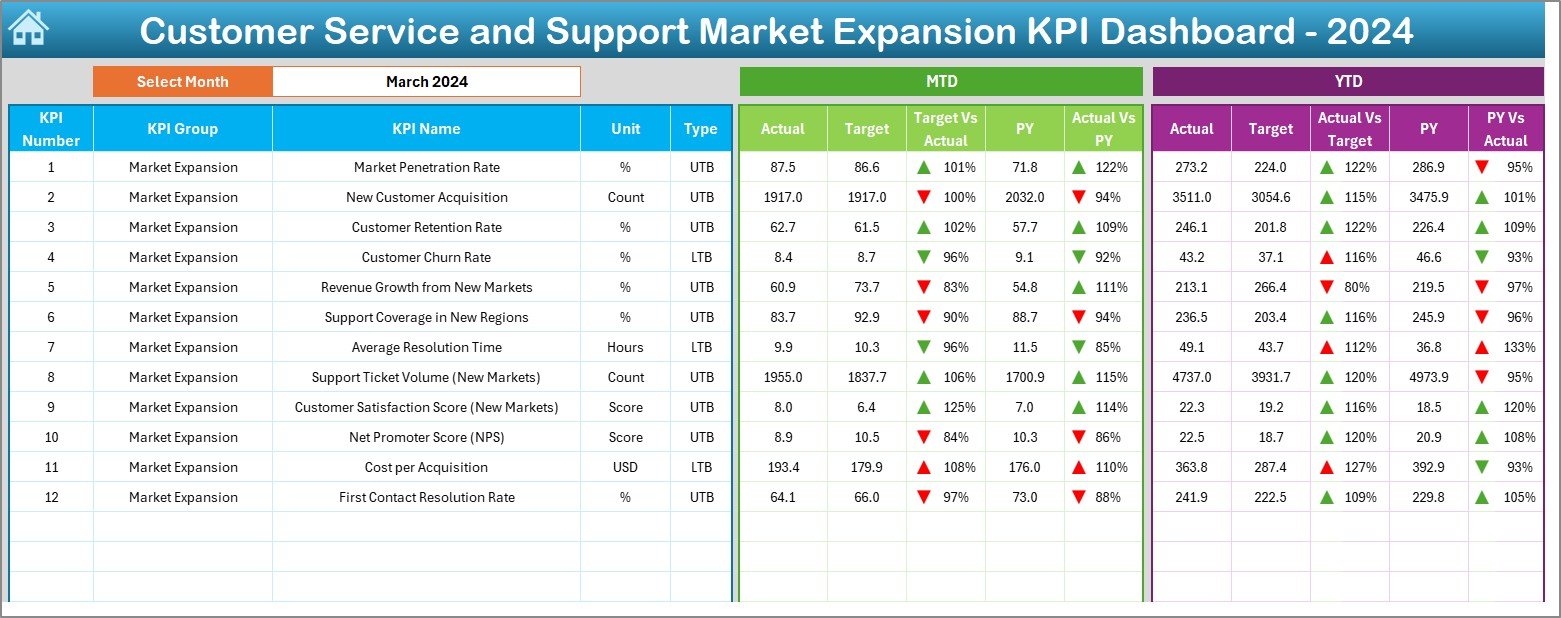
📊 Dashboard View with Filters
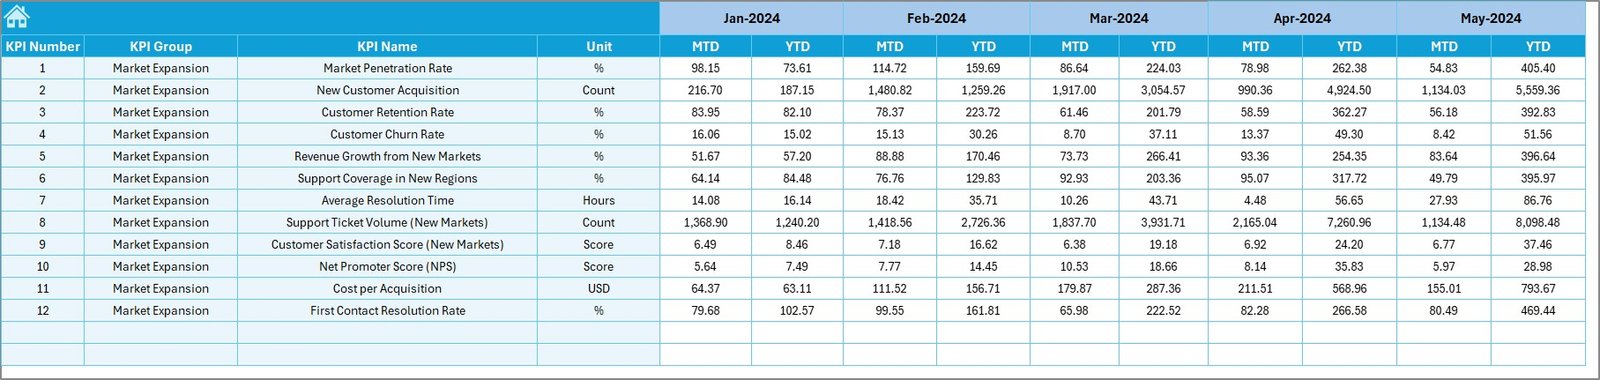
Select a specific month and see Month-to-Date (MTD) and Year-to-Date (YTD) performance with visuals that auto-update instantly.
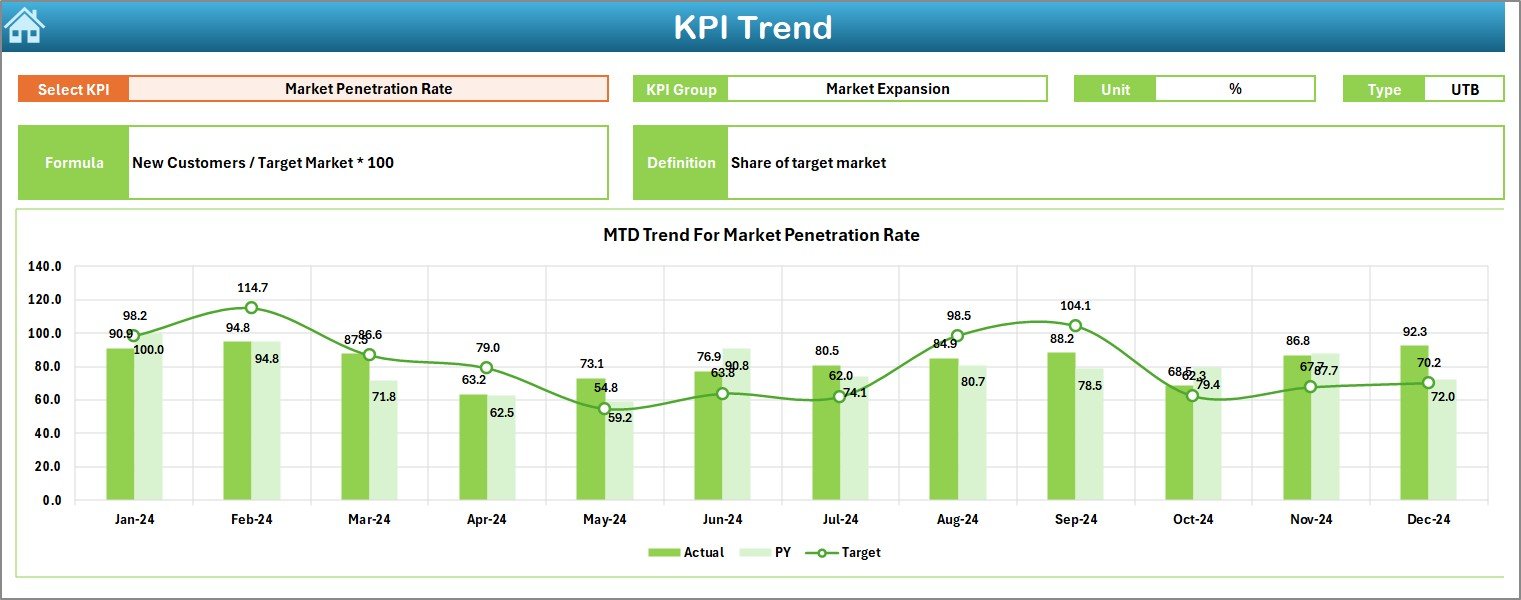
🔁 Trend Tracking with Visual Charts
Use the KPI Trend Sheet to visualize the ups and downs of individual KPIs over time—spot problems or wins early!
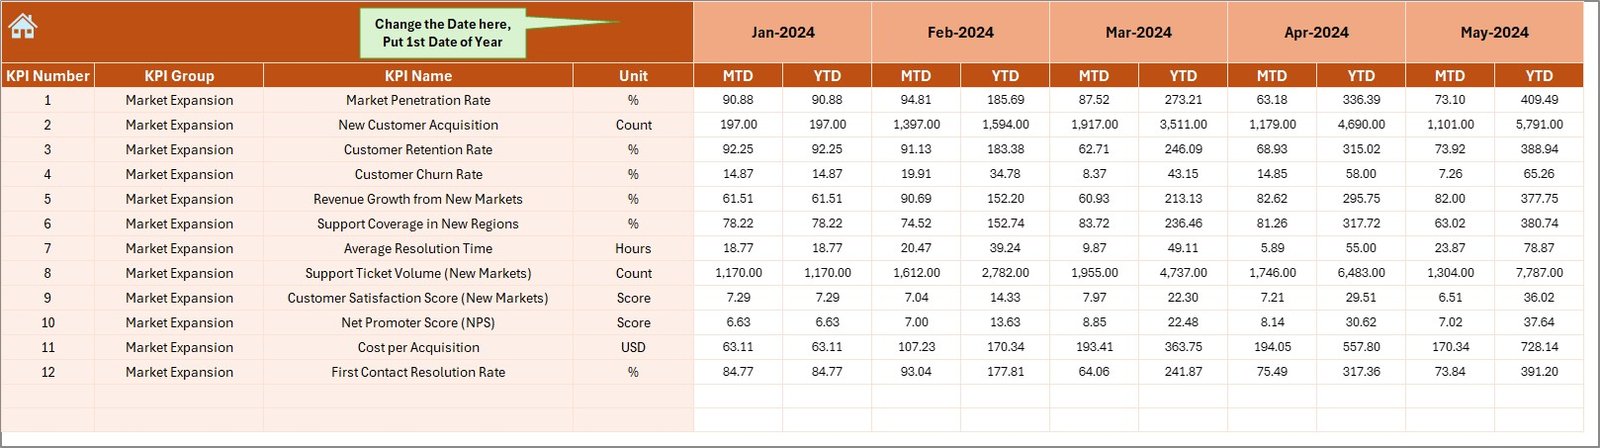
✍️ Data-Driven Input Sheets
Enter your Actuals, Targets, and Previous Year values manually and watch your dashboard calculate, compare, and highlight gaps automatically.
📘 KPI Dictionary Tab
Maintain clarity across teams with a built-in KPI Definition Sheet—it includes KPI names, formulas, units, and performance types (UTB or LTB).
📂 What’s Inside the Dashboard?
This dashboard is structured into seven easy-to-navigate worksheet tabs:
1️⃣ Home Sheet
Your command center—navigate with one-click buttons to each report tab.
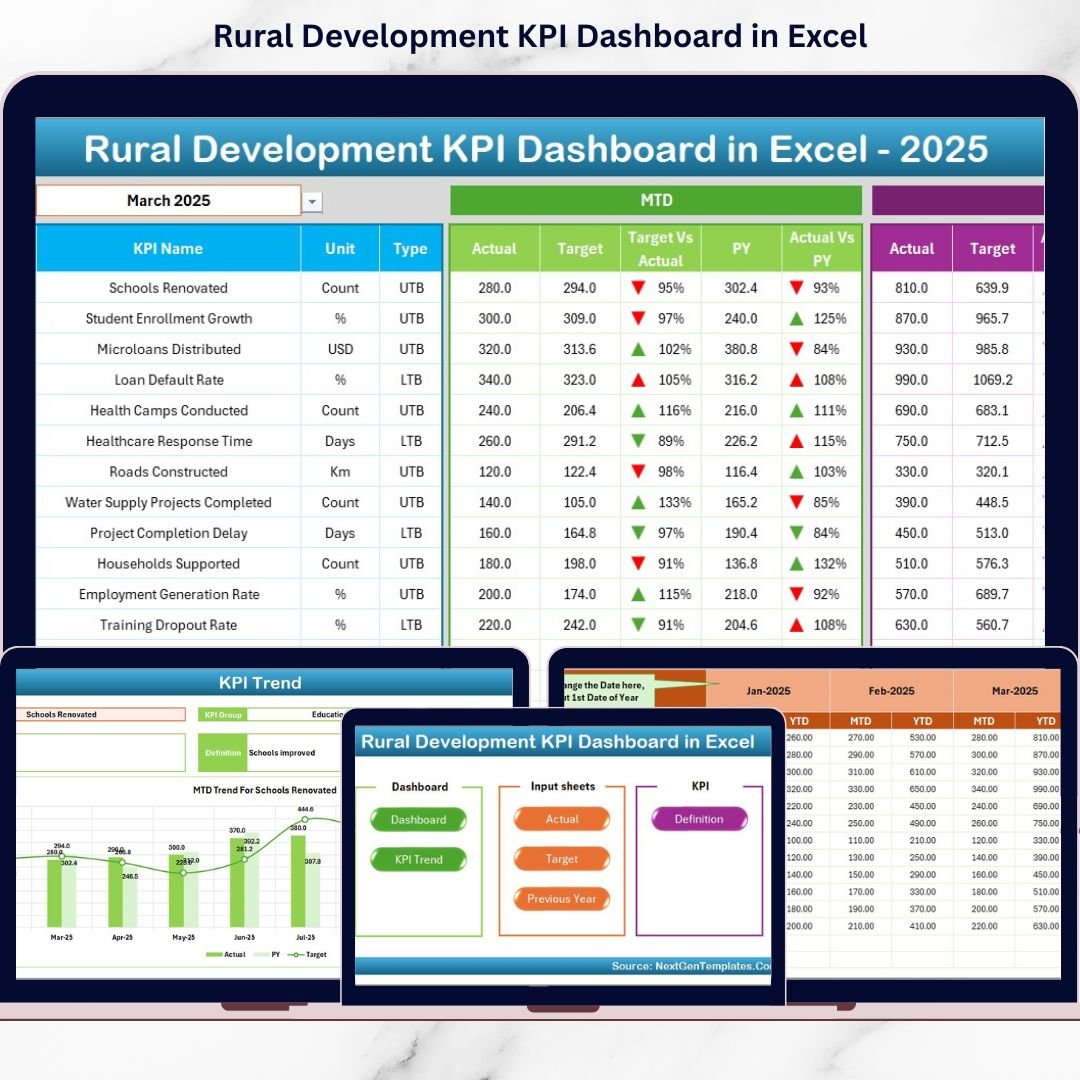
2️⃣ Dashboard Sheet
The core dashboard view—select the month, compare MTD/YTD vs. Target and Previous Year, with arrows and conditional formatting to track direction.
3️⃣ KPI Trend Sheet
Choose a KPI and see monthly line charts for Actual, Target, and Previous Year metrics. Forecast and adjust strategies easily!
4️⃣ Actual Numbers Input
Feed your monthly MTD and YTD Actuals here—this is the engine behind your live data!
5️⃣ Target Sheet
Set performance targets for every KPI by month—this fuels the comparative visuals.
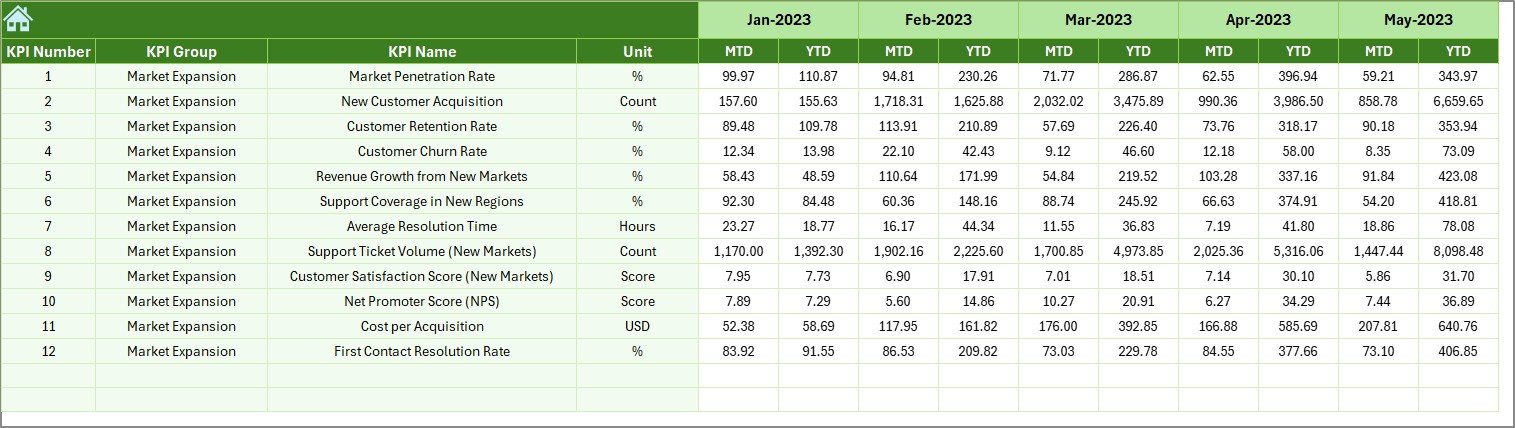
6️⃣ Previous Year Numbers
Track YoY growth by entering previous year’s data.
7️⃣ KPI Definition Sheet
Keep documentation centralized with KPI formula, unit, and type to avoid confusion.
🛠️ How to Use the Dashboard
-
📥 Download and open the Excel template
-
✍️ Add or update your KPI definitions
-
📅 Choose your fiscal start month (cell E1 in Actuals sheet)
-
📈 Input Actuals, Targets, and Previous Year data
-
✅ Select a month in the Dashboard tab to view updates
-
🔍 Use the KPI Trend tab for forecasting and pattern recognition
👥 Who Can Benefit from This Dashboard?
-
💼 Customer Support Teams – Reduce resolution time, improve SLA performance
-
🌍 Expansion Managers – Measure support efficiency across new markets
-
📊 Executives – Monitor KPIs from one place with boardroom-ready visuals
-
📞 Call Center Heads – Track agent productivity, ticket trends, and satisfaction
-
🧑💻 Startups & SMBs – Build structured, scalable service performance reviews
🔗 Click here to read the Detailed blog post
🔗 Visit our YouTube channel to learn step-by-step video tutorials


Reviews
There are no reviews yet.