



Managing customer relationships just got easier! With the Customer Relationship Management Dashboard in Excel, you can organize, analyze, and act on client data—without investing in expensive CRM software. This all-in-one Excel template is designed to help businesses monitor deals, analyze sources, and improve team performance in a familiar, user-friendly environment.
Whether you’re a startup, small business, or freelancer managing your own pipeline, this dynamic dashboard puts you in control of your sales process. Get ready to turn raw data into smart decisions.
✨ Key Features of CRM Dashboard
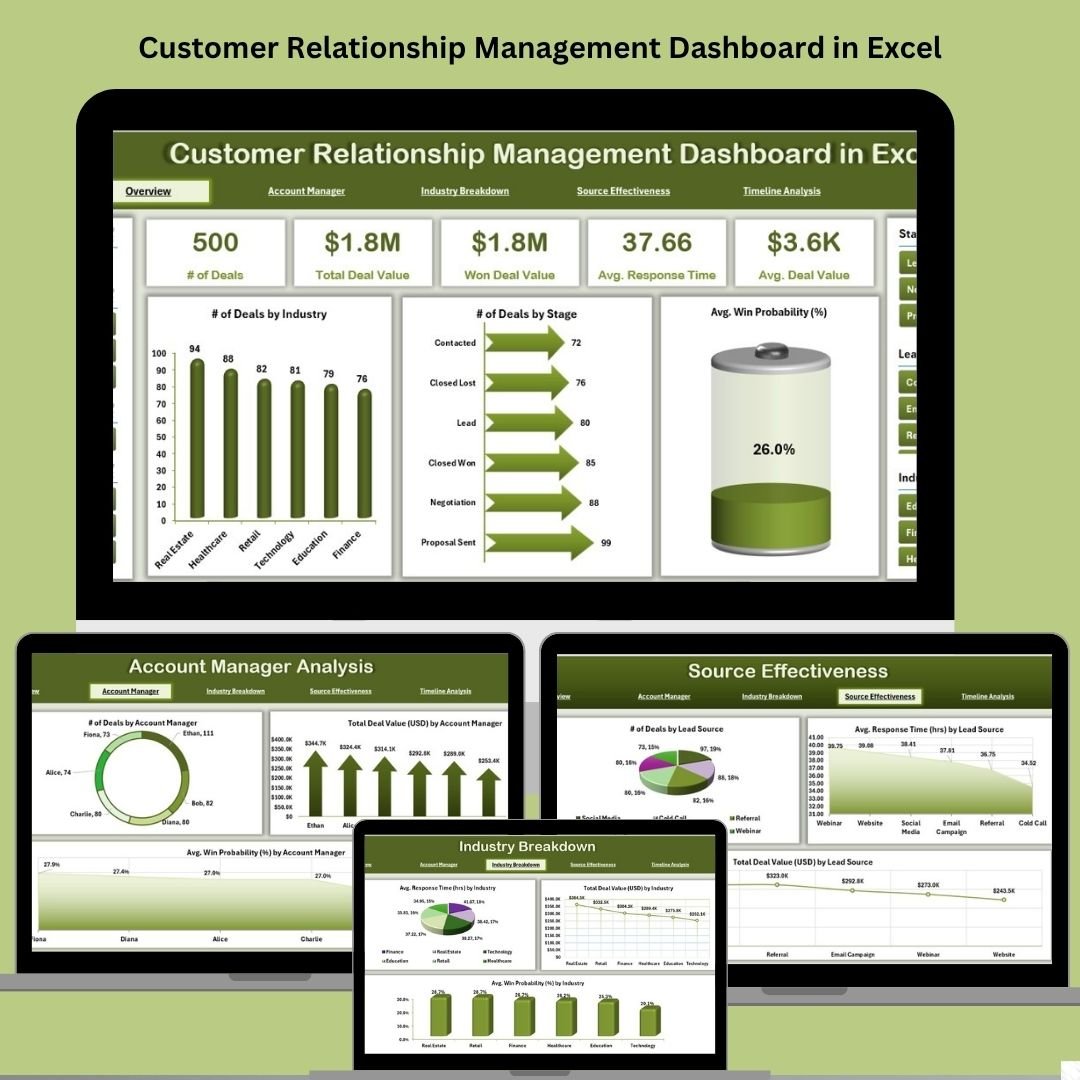
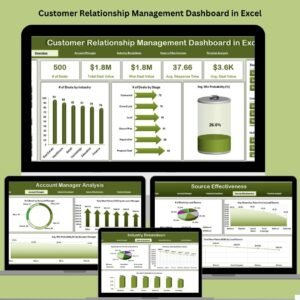
📊 Overview Page – Your Sales Command Center
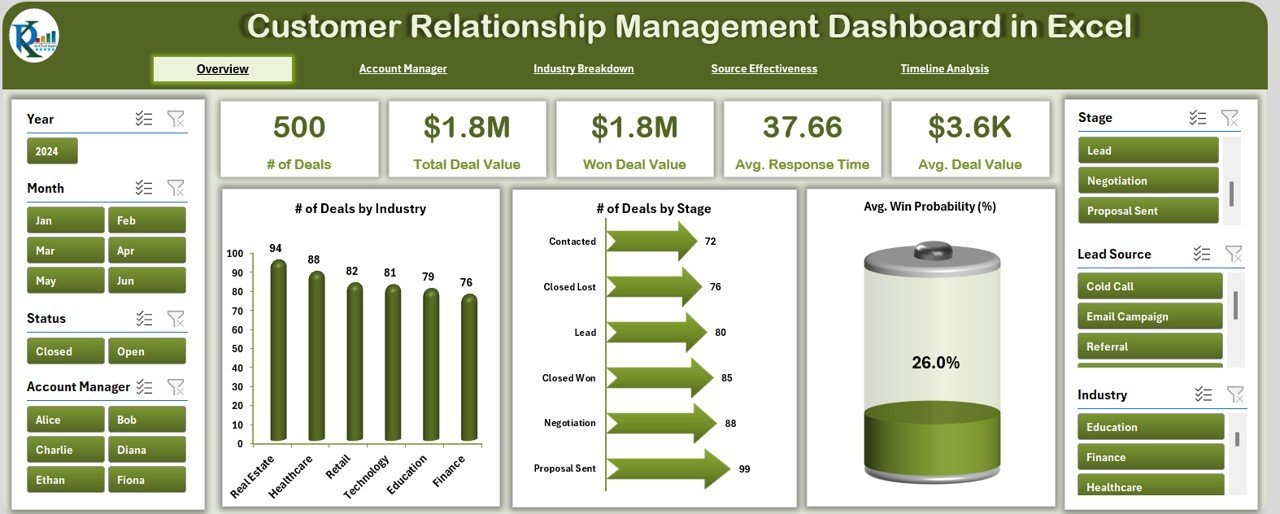
Left & right-side slicers to filter by time, manager, or source
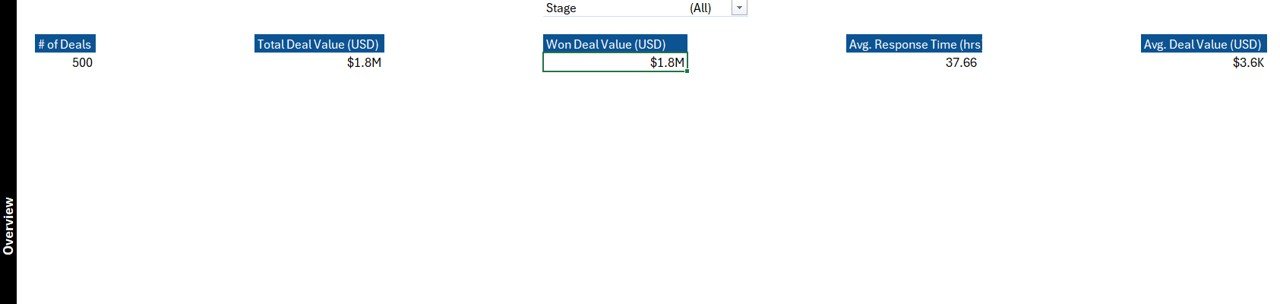
5 summary cards: Deals, Deal Value, Win Rate & more
Visuals include:
✔ Deals by Month
✔ Deal Value by Month
✔ Avg. Win Probability (%) by Month
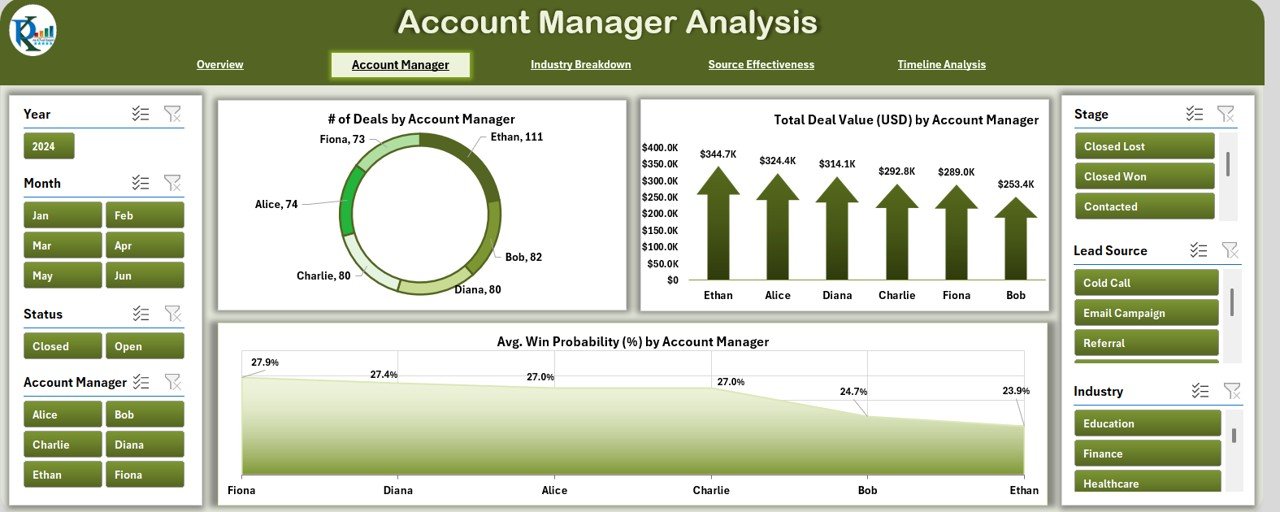
🧑💼 Account Manager Analysis
Track how each account manager performs with:
Slicers for drill-down by manager
Charts for Number of Deals, Deal Value, Win Probability
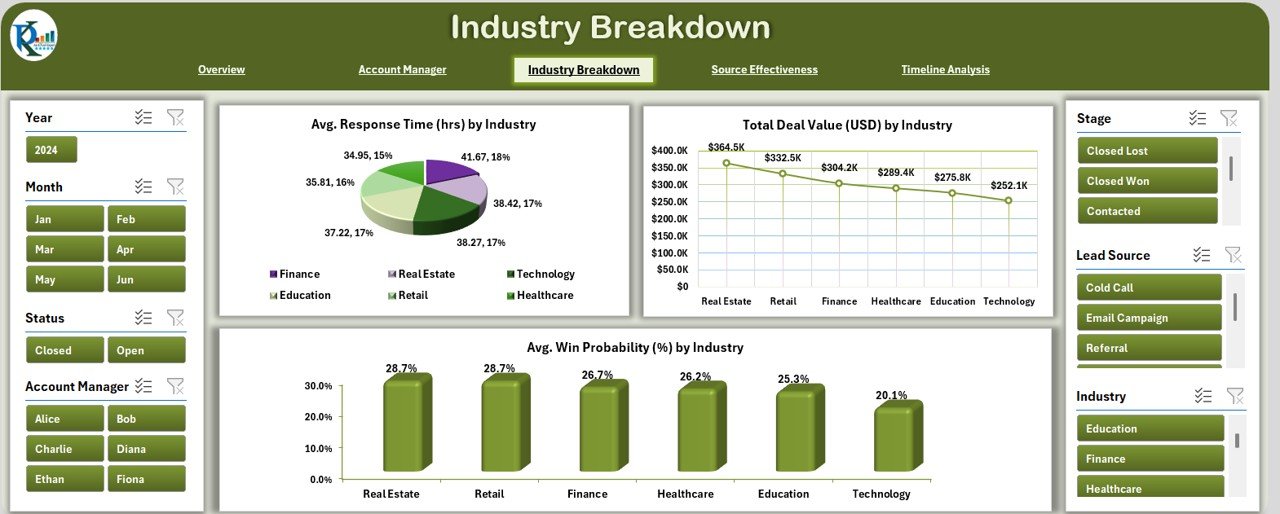
🏢 Industry Analysis
Identify top-performing industries using:
Average Response Time
Deal Value
Win Probability by Industry
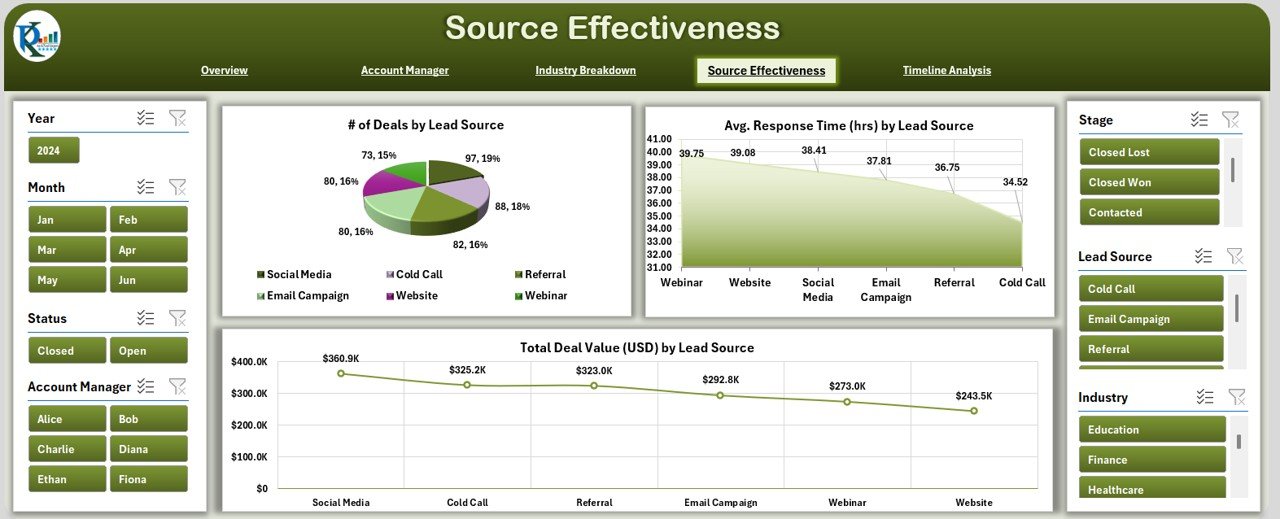
📣 Source Effectiveness Page
Optimize marketing by measuring lead source performance:
Number of Deals
Deal Value
Average Response Time by Source
📈 Timeline Analysis Page
Perfect for forecasting and planning:
Deals by Month
Average Deal Value
Monthly Win Probability
📂 What’s Inside the CRM Dashboard Template
🟢 Data Sheet
Your primary data input area. Add values for:
Customer ID
Lead Source
Industry
Account Manager
Contact Date
Response Time
Deal Value
Win Probability (%)
Status, Stage, Month, Year
🟢 Support Sheet
Store all dropdown list options for:
Industries
Account Managers
Lead Sources
This keeps your data clean, consistent, and error-free.
🛠️ How to Use the CRM Dashboard
👉 Step 1: Add Your Customer Data
Enter contact and deal information in the Data Sheet.
👉 Step 2: Customize Dropdown Lists
Update support fields like managers, industries, and lead sources.
👉 Step 3: Explore the Dashboard Pages
Use slicers and visuals to filter and analyze performance.
👉 Step 4: Update Weekly
Keep your data fresh to make informed decisions with real-time insights.
👉 Step 5: Present or Share Easily
Use charts and KPIs in meetings or share via cloud storage.
👥 Who Can Benefit from This CRM Dashboard?
✅ Sales Teams – Stay motivated by tracking deals and targets
✅ Marketing Managers – Optimize lead sources and campaigns
✅ Freelancers – Manage personal pipelines like a pro
✅ Small Business Owners – Get visibility without expensive tools
✅ Startups – Build an agile CRM process that grows with you
🔧 Customization Ideas to Boost Performance
💡 Add a Funnel Chart to visualize deal stages
📈 Insert Forecast vs Actual comparison charts
🌟 Highlight High-Value Deals with conditional formatting
📅 Track Follow-Up Dates or reminders
🔁 Create User Forms with VBA for easy data entry
This template is flexible and designed to grow with your business.
✅ Click here to read the Detailed blog post
🔗 Visit our YouTube channel to learn step-by-step video tutorials







Reviews
There are no reviews yet.