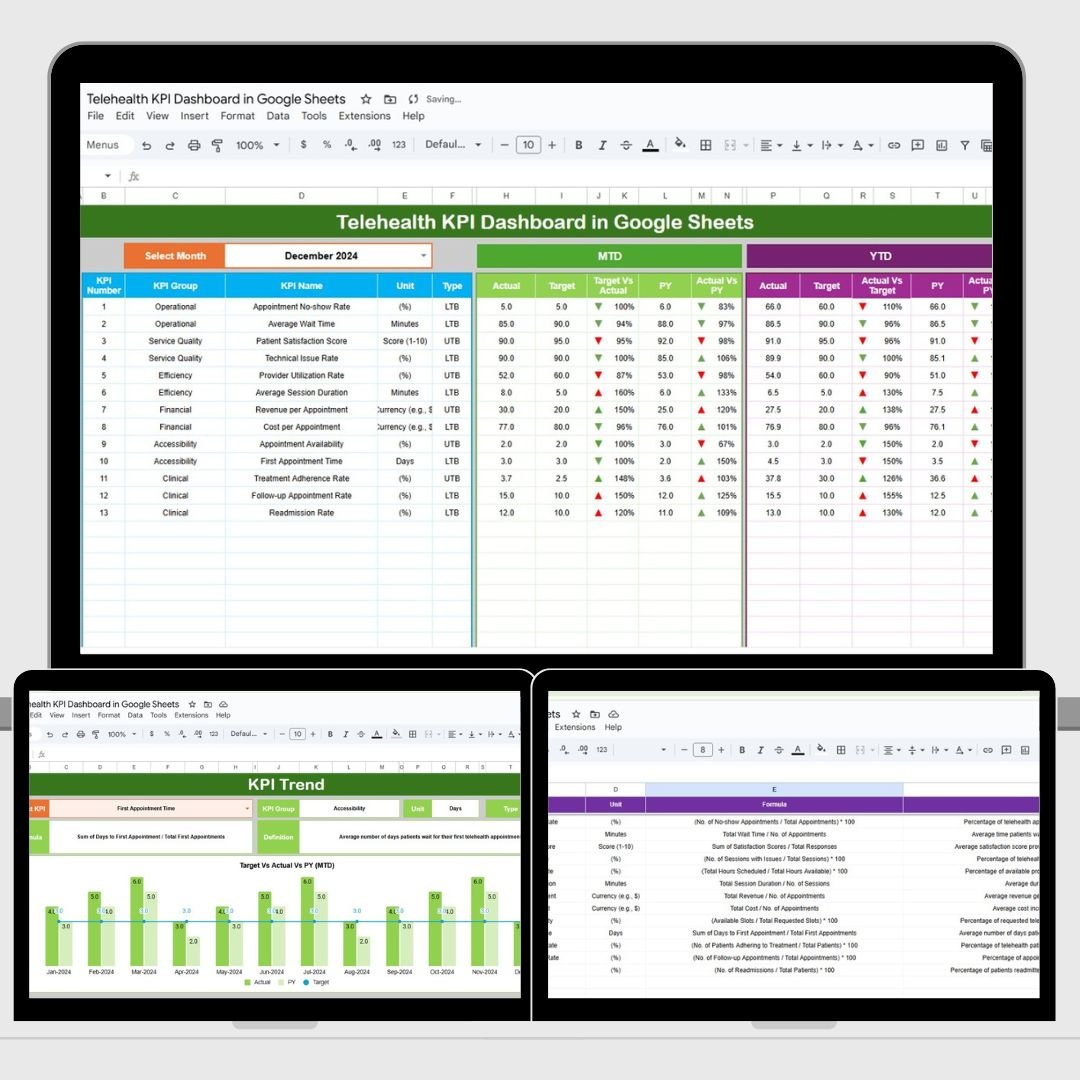
In today’s rapidly growing telehealth industry, ensuring efficient service delivery and patient satisfaction is critical. The Telehealth KPI Dashboard in Google Sheets is a powerful tool for healthcare providers to track and analyze key performance indicators (KPIs) in real-time. This customizable template enables you to monitor the effectiveness of telehealth services, making it easier to manage response times, patient engagement, satisfaction, and other crucial metrics. Whether you are a provider, a practice manager, or part of the telehealth operations team, this dashboard is designed to streamline your workflow and help you make data-driven decisions.
🔑 Key Features of the Telehealth KPI Dashboard:
-
Real-Time Insights: Track and monitor key telehealth performance metrics in real-time, ensuring you can make timely adjustments and decisions.
-
Comprehensive Data Views: Get a complete picture of your telehealth services with detailed data for MTD (Month-to-Date) and YTD (Year-to-Date) comparisons.
-
User-Friendly Interface: Designed in Google Sheets for ease of use, even for non-technical users, with automatic updates and visualizations.
-
Customizable KPIs: Tailor the dashboard to your specific telehealth service needs by adding or modifying KPIs, such as response times, patient satisfaction, or appointment completion.
-
Trend Analysis: Visualize the trends in your telehealth service delivery over time and make proactive decisions based on historical data.
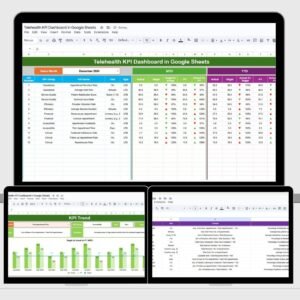
What’s Inside the Telehealth KPI Dashboard? 💡📅
The Telehealth KPI Dashboard consists of six essential worksheets, each focused on tracking a different aspect of telehealth services. Here’s a breakdown of what each sheet offers:
-
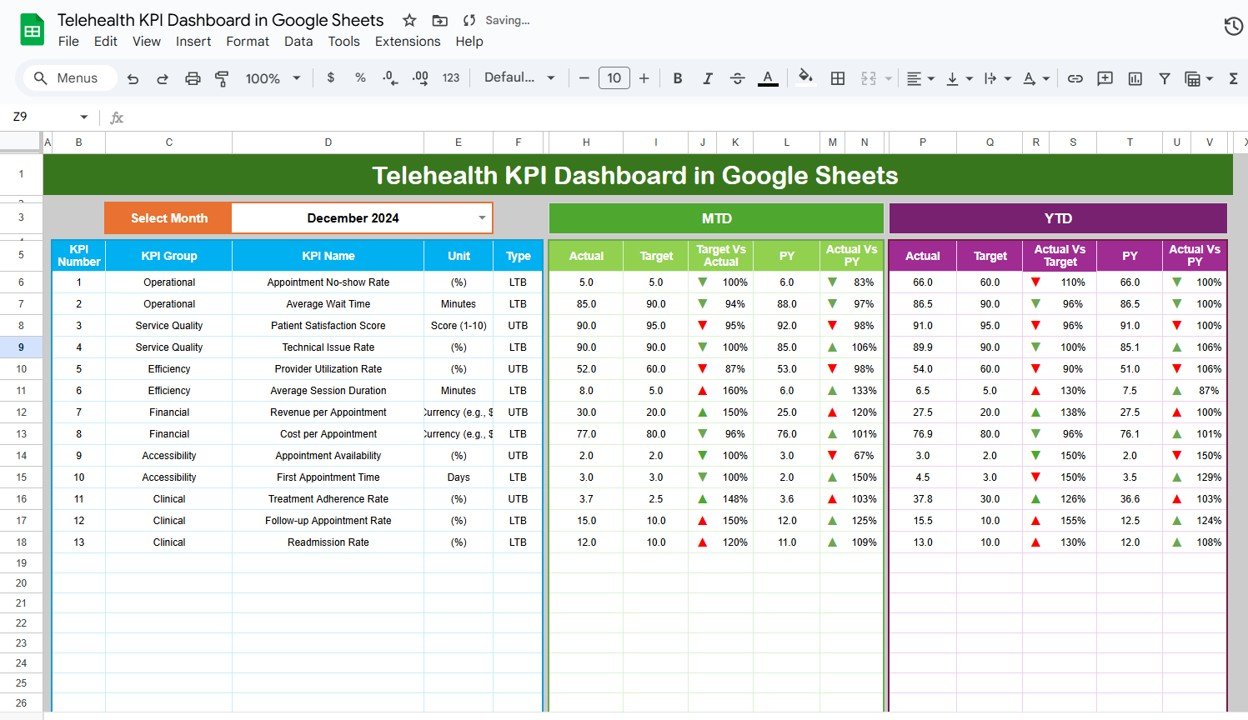
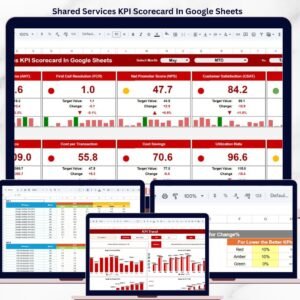
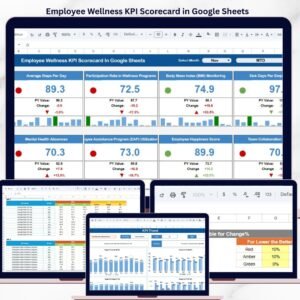
Dashboard Sheet: The main sheet where you can monitor and visualize key telehealth performance indicators. Features include:
-
Month Dropdown: Select the month to filter the data for that period and see MTD and YTD performance metrics.
-
Key Metrics: Displays critical data like Patient Satisfaction, Response Times, and Service Completion Rates.
-
Conditional Formatting: Up and down arrows indicate whether the KPIs have met or missed their targets for the selected month or year.
-
-
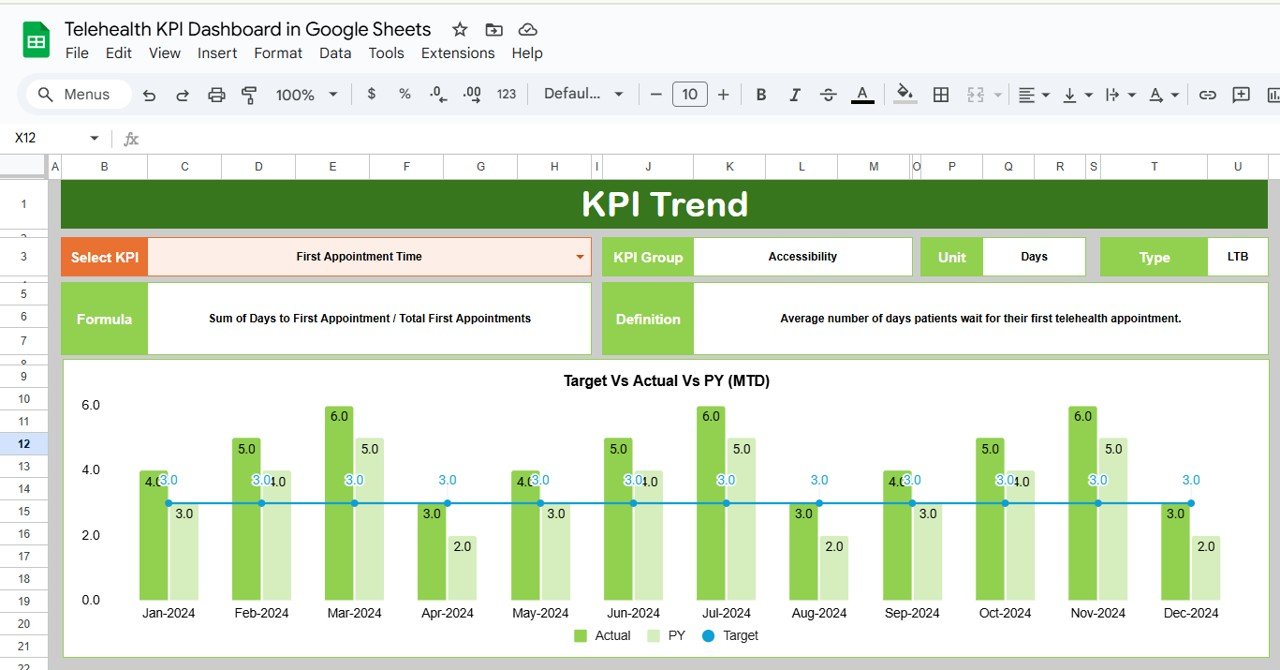
KPI Trend Sheet: This sheet allows you to track the performance of KPIs over time, helping you understand trends and improve service delivery:
-
KPI Selection Dropdown: Choose the KPI you want to analyze and view its historical data.
-
Trend Visuals: Use combo charts to see a comparison of current vs. previous year performance, tracking the trends in various key areas like patient satisfaction and resolution time.
-
-
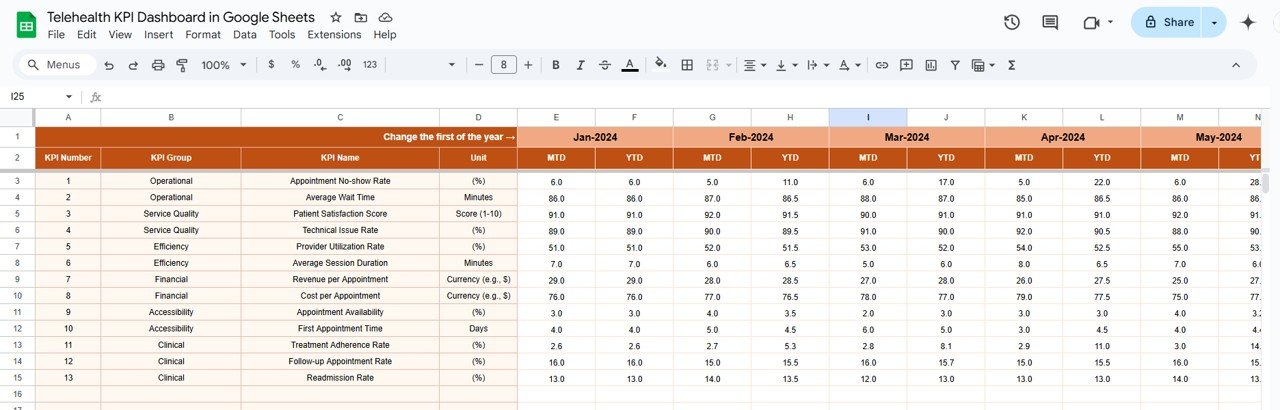
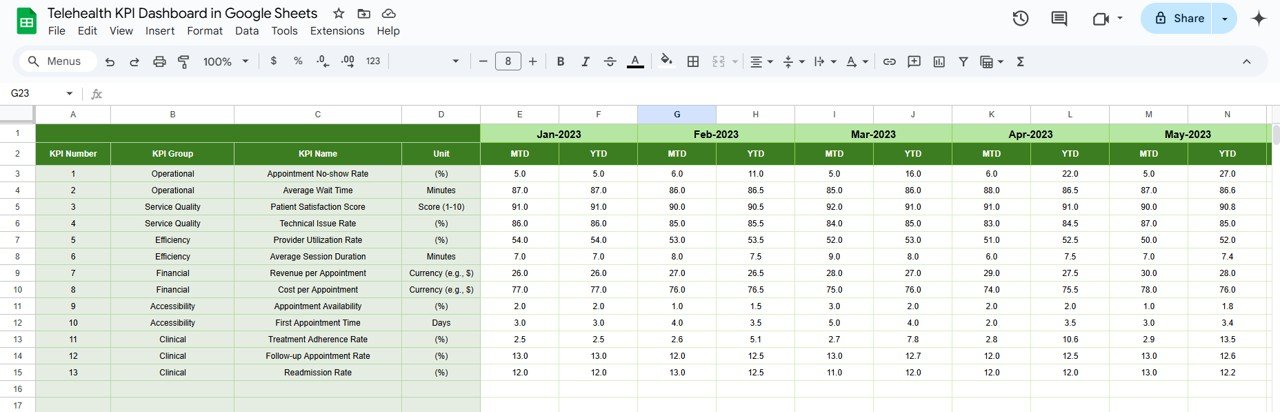
Actual Numbers Sheet: The sheet where you input your actual data for KPIs:
-
MTD and YTD Input: Track your actual performance data for the current month and year to date.
-
Data Entry: Easily input your service delivery data and monitor progress.
-
-
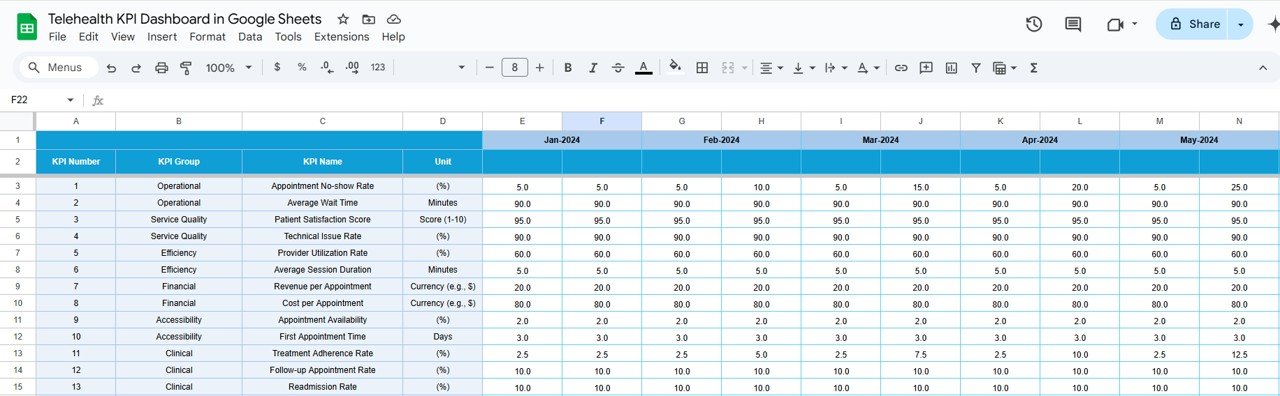
Target Sheet: In this sheet, you can input your targets for each KPI:
-
Monthly and YTD Targets: Define performance goals for both month-to-date and year-to-date metrics to gauge your telehealth service performance against set targets.
-
-
Previous Year Number Sheet: This sheet allows you to input data from the previous year for comparison:
-
Performance Comparison: Assess your current performance against last year’s data, helping you track improvements or areas needing attention.
-
-
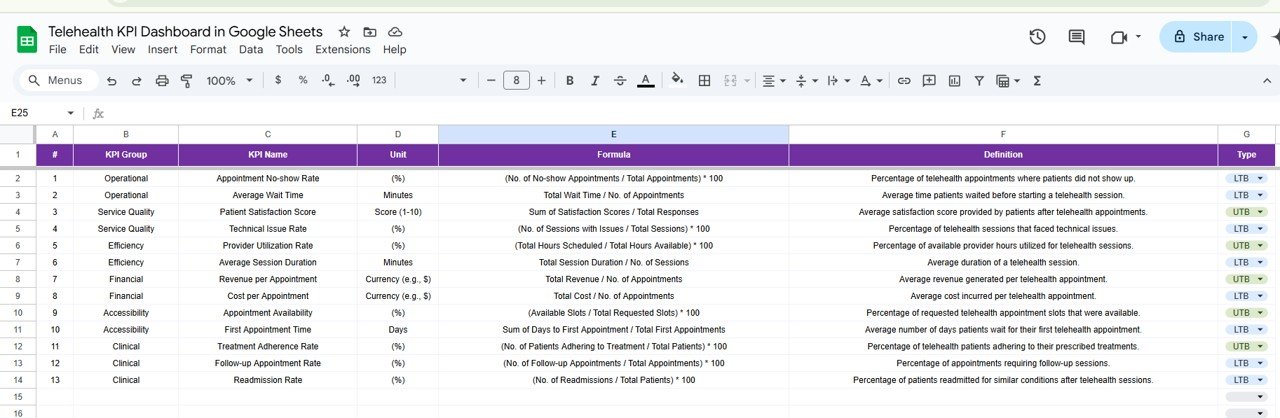
KPI Definition Sheet: This sheet is essential for understanding the formulas and definitions behind each KPI:
-
KPI Details: Learn more about each KPI, including the formula used for calculations, the unit of measurement, and a detailed definition to ensure clarity.
-
How to Use the Telehealth KPI Dashboard 📈💬
To get the most out of the Telehealth KPI Dashboard, follow these simple steps:
-
Download and Open the Template: Access the Google Sheets template and begin entering your telehealth data.
-
Input Data: Use the Actual Numbers Sheet to input data for KPIs such as patient satisfaction, service completion rates, and response times.
-
Set Targets: Enter your targets in the Target Sheet to compare against the actual data you input.
-
Monitor Performance: Use the Dashboard Sheet to keep track of performance and check whether the KPIs are meeting the targets for MTD and YTD.
-
Analyze Trends: Use the KPI Trend Sheet to analyze the trends over time and adjust your telehealth strategies accordingly.
Who Can Benefit from This Telehealth KPI Dashboard? 🏥💻
The Telehealth KPI Dashboard is perfect for healthcare providers, telehealth operations managers, and business owners in the healthcare industry. Whether you are managing patient care remotely, tracking performance, or optimizing service delivery, this tool will streamline your workflow and improve efficiency.
-
Healthcare Providers: Monitor key performance metrics like patient engagement, response times, and satisfaction to enhance care delivery.
-
Telehealth Managers: Track overall performance and identify areas for improvement based on real-time data and trend analysis.
-
Operations Teams: Gain insights into the efficiency of telehealth services and track critical KPIs to improve operational processes.
-
Healthcare Organizations: Ensure that telehealth services meet quality standards and regulatory requirements by closely monitoring performance.
Advantages of Using the Telehealth KPI Dashboard 🏅💡
-
Real-Time Monitoring: The dashboard updates automatically, allowing you to track key performance metrics and respond to changes in real time.
-
Comprehensive KPI Tracking: With detailed data on patient satisfaction, response times, and appointment completion, the dashboard provides a clear overview of your telehealth service’s performance.
-
Improved Decision-Making: The dashboard’s data-driven insights allow you to make informed decisions on improving service delivery and patient care.
-
Customizable and Flexible: Tailor the dashboard to track KPIs that are most relevant to your telehealth practice, ensuring that it meets your specific needs.
-
Easy Collaboration: The Google Sheets platform allows for seamless collaboration, ensuring that your team can access and update the dashboard in real-time.
Click here to read the Detailed Blog Post 📖
Visit our YouTube Channel to Learn Step-by-Step Video Tutorials 🎥
YouTube.com/@NeotechNavigators


Reviews
There are no reviews yet.