

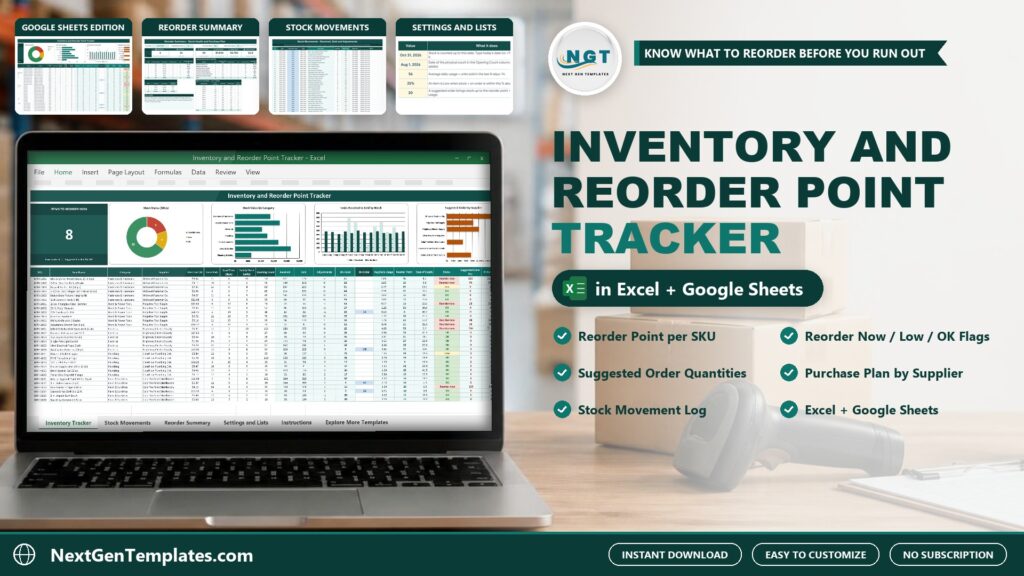
Running out of stock loses sales, and ordering too early ties up cash. The Inventory and Reorder Point Tracker in Excel and Google Sheets works out the reorder point for every item and tells you how much to order.
Watch the Inventory and Reorder Point Tracker in Excel and Google Sheets walkthrough
 Launch offer
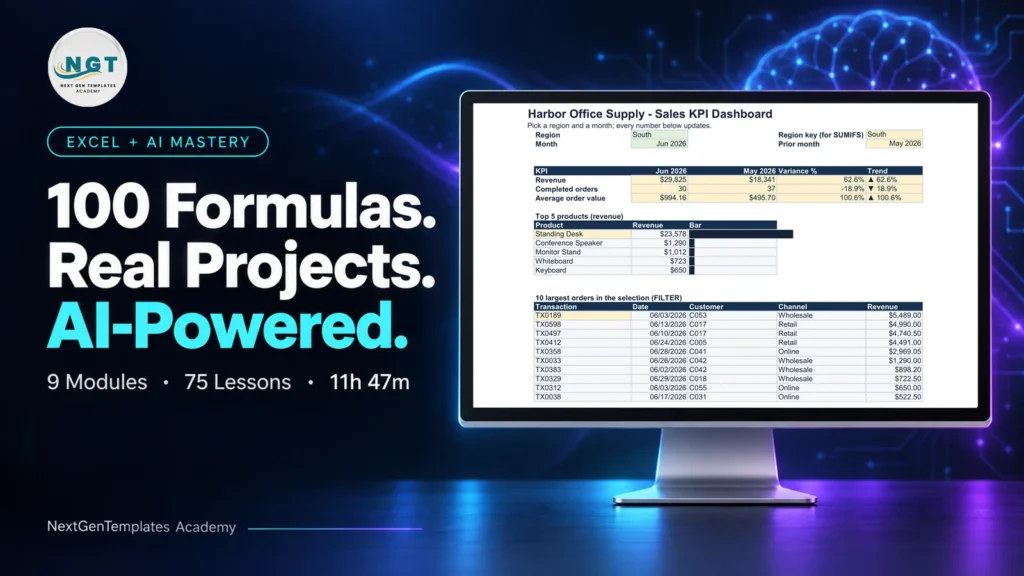
SUMIFS, XLOOKUP, FILTER, LAMBDA and checking AI-written formulas, with real business projects. 11h 47m of video by PK, with practice files, quizzes and a capstone.
What Is an Inventory and Reorder Point Tracker?
It is a workbook built around one inventory list and one stock movement log. You record each delivery, sale and adjustment once. The tracker then calculates stock on hand, average daily usage, the reorder point and a status for every item, and suggests an order quantity rounded up to the case pack. A Reorder Summary rolls it up into a purchase plan by supplier.
Inside the Template
Inventory Tracker
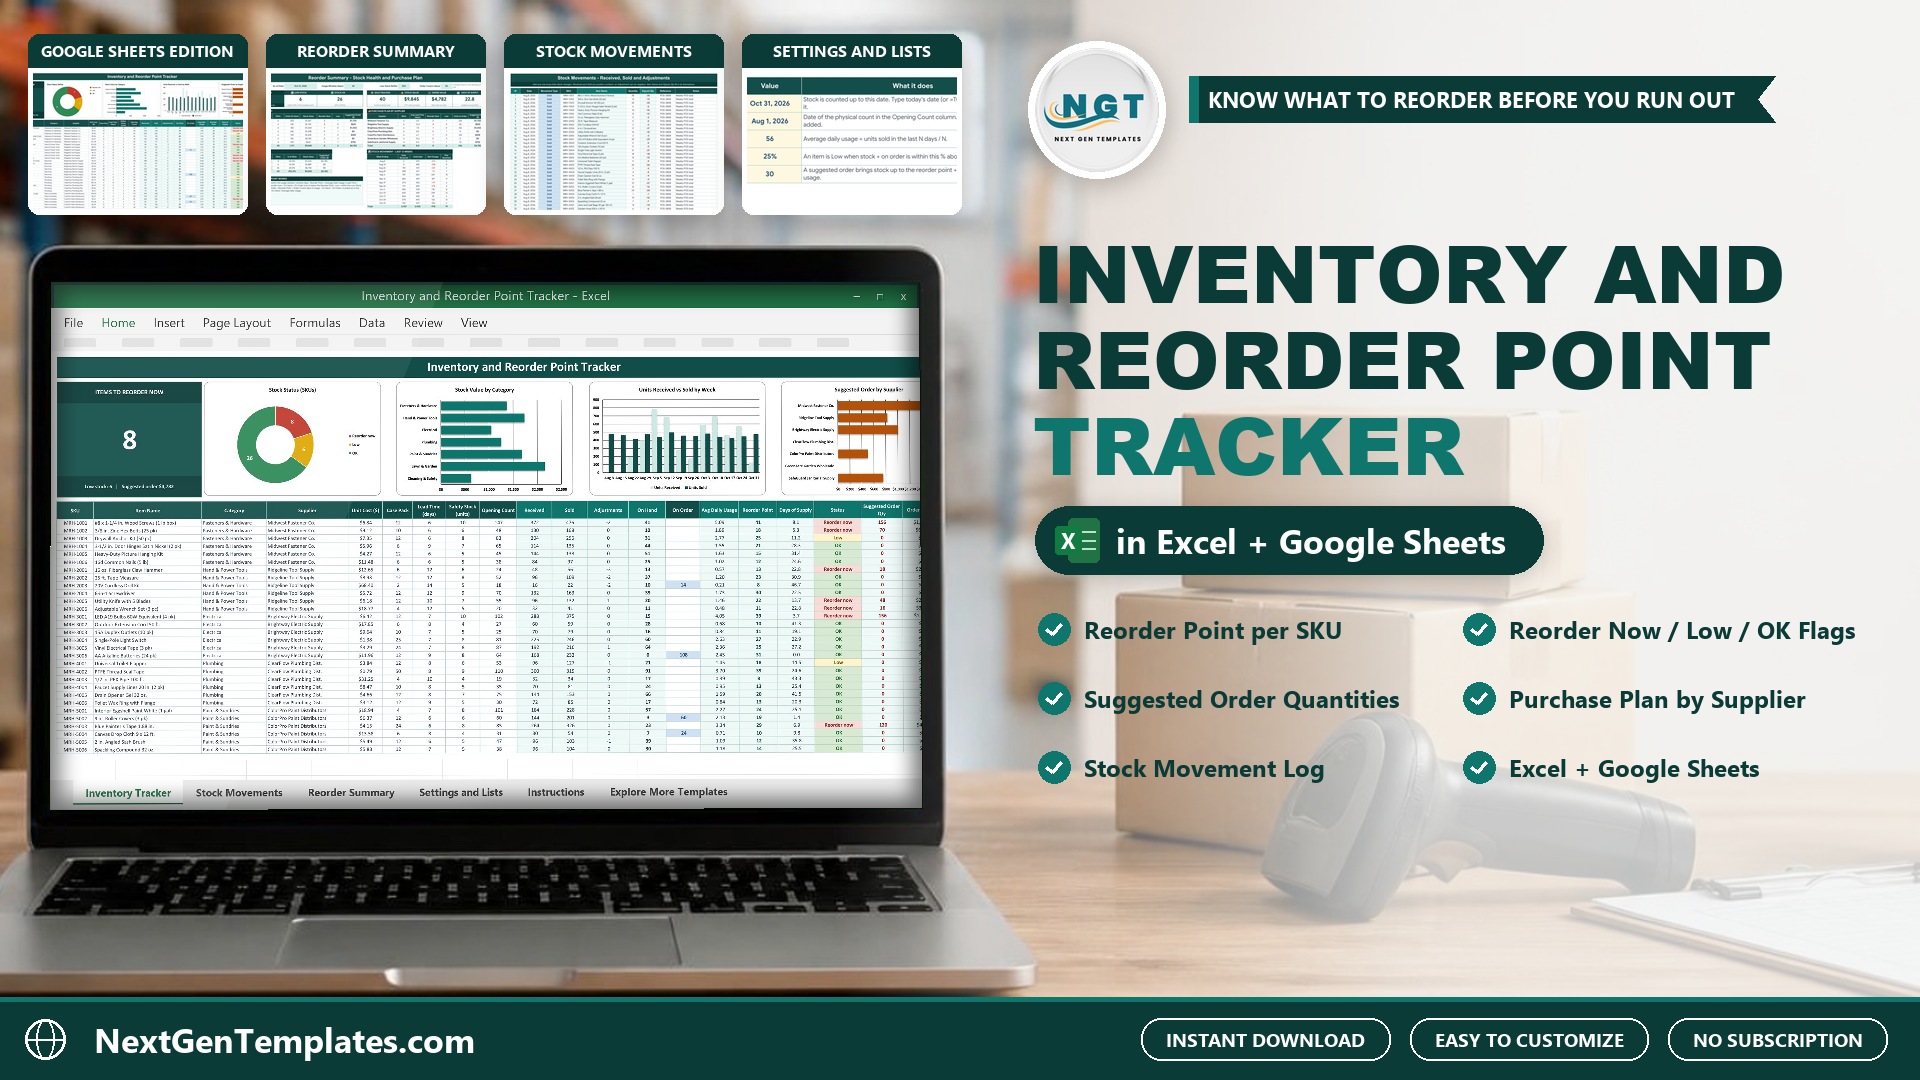
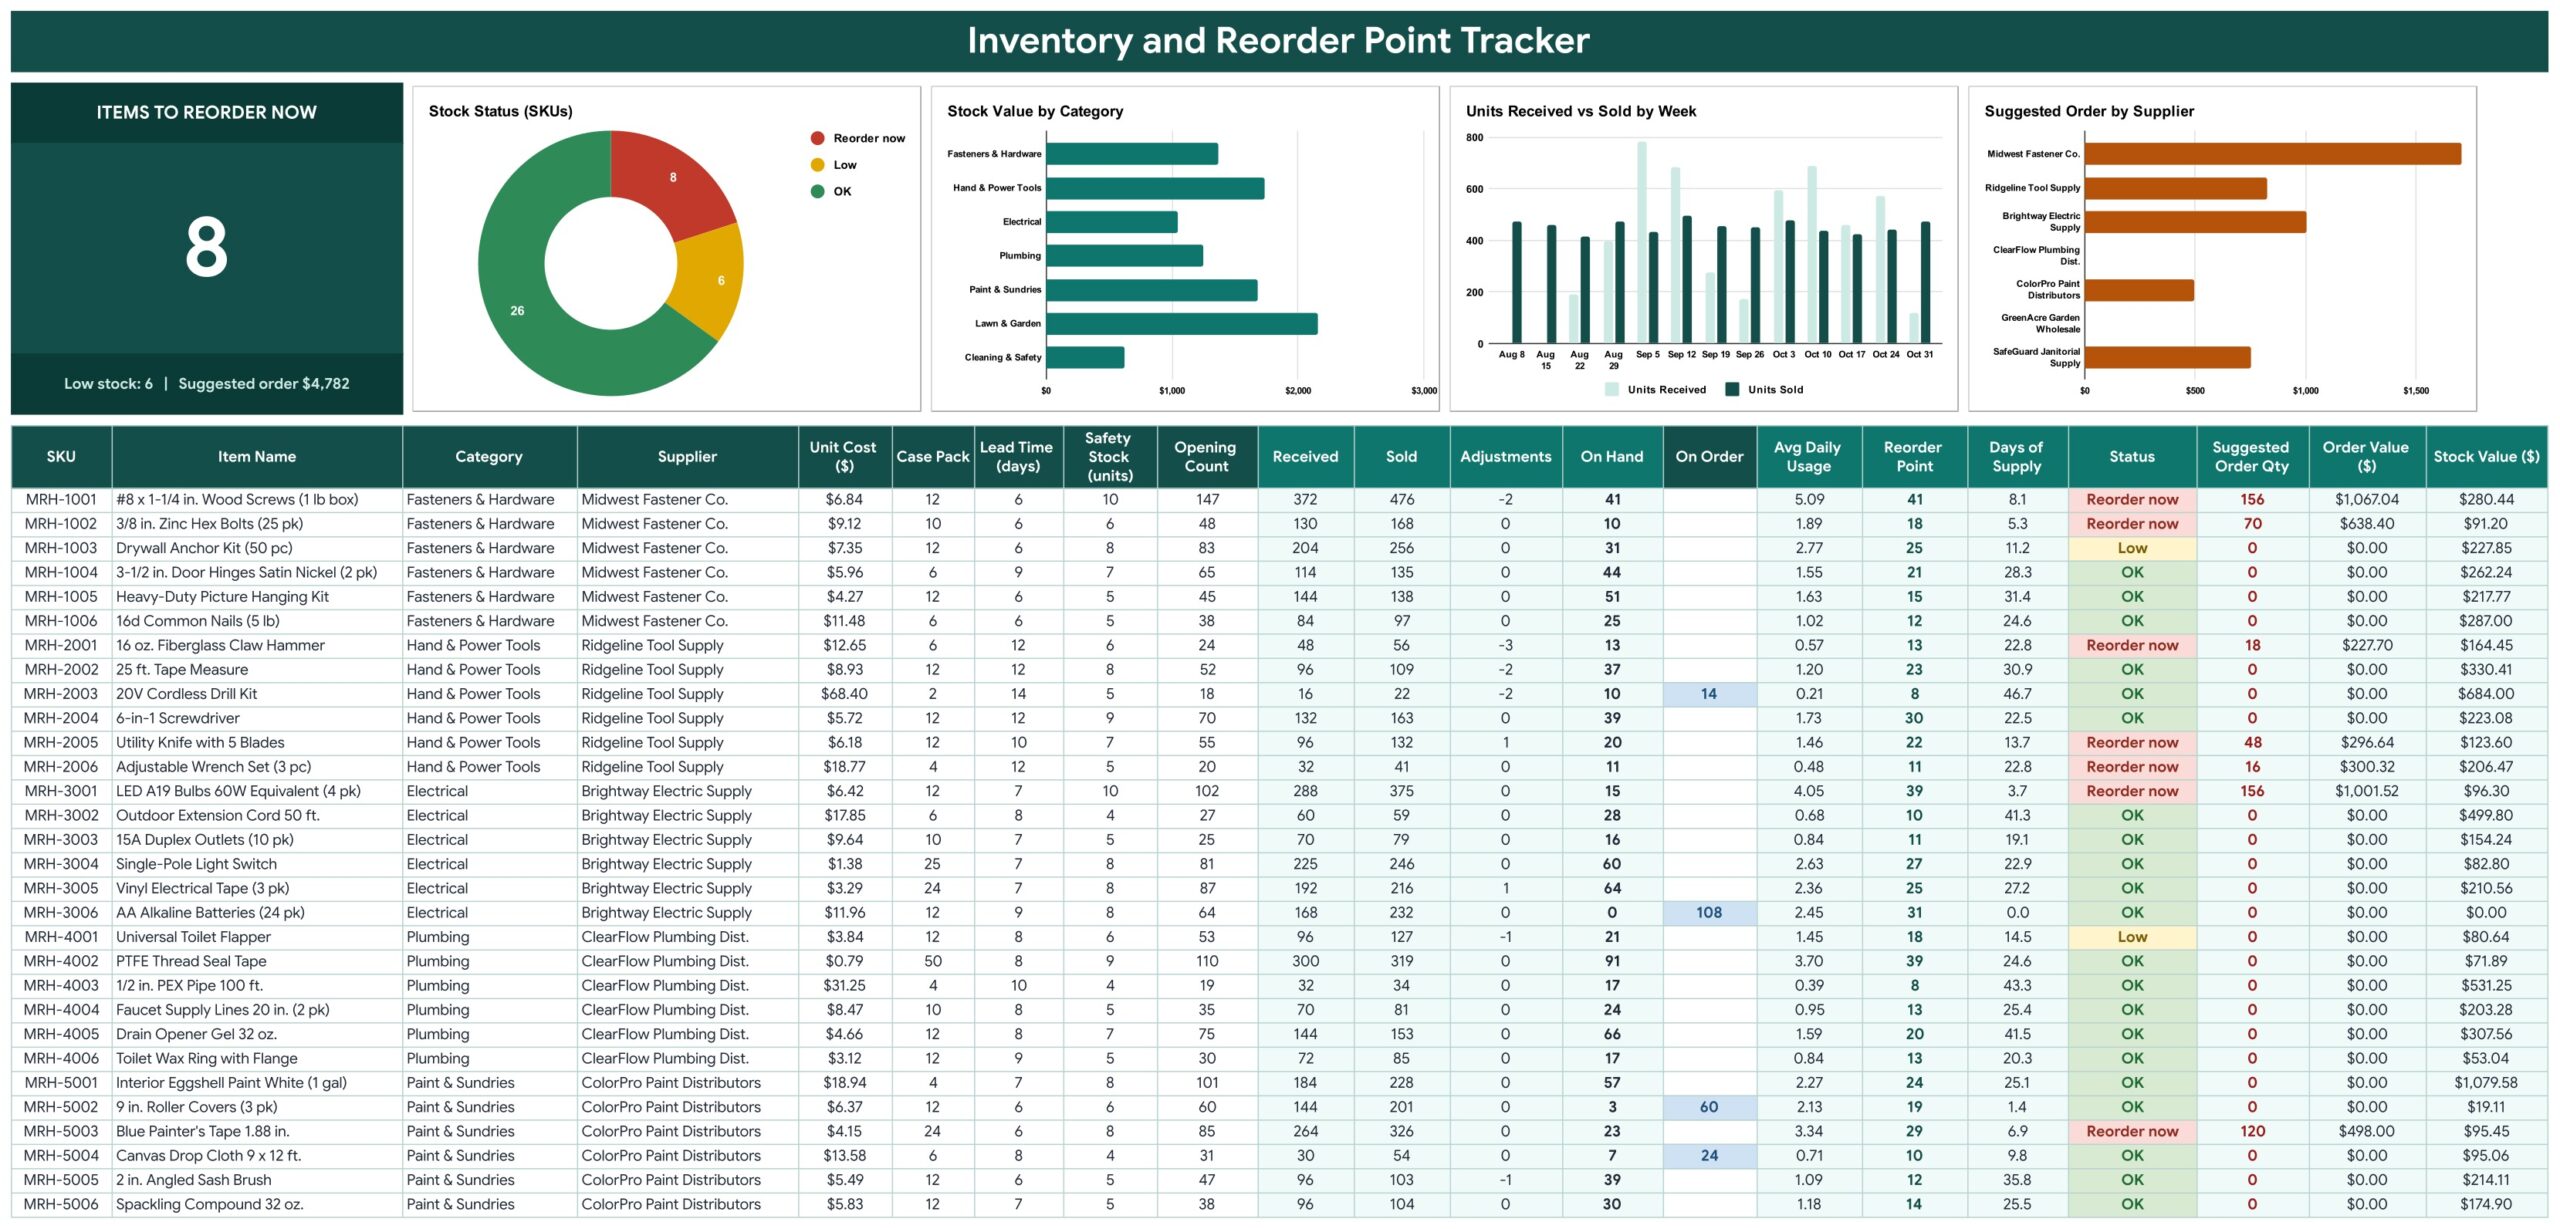
An Items to Reorder Now card sits above four charts: Stock Status, Stock Value by Category, Units Received vs Sold by Week and Suggested Order by Supplier. Below is the inventory list: SKU, item, category and supplier dropdowns, unit cost, case pack, lead time, safety stock, opening count and On Order. The shaded columns calculate Received, Sold, Adjustments, On Hand, Average Daily Usage, Reorder Point, Days of Supply, Status (Reorder now, Low or OK), Suggested Order Qty and Order Value.
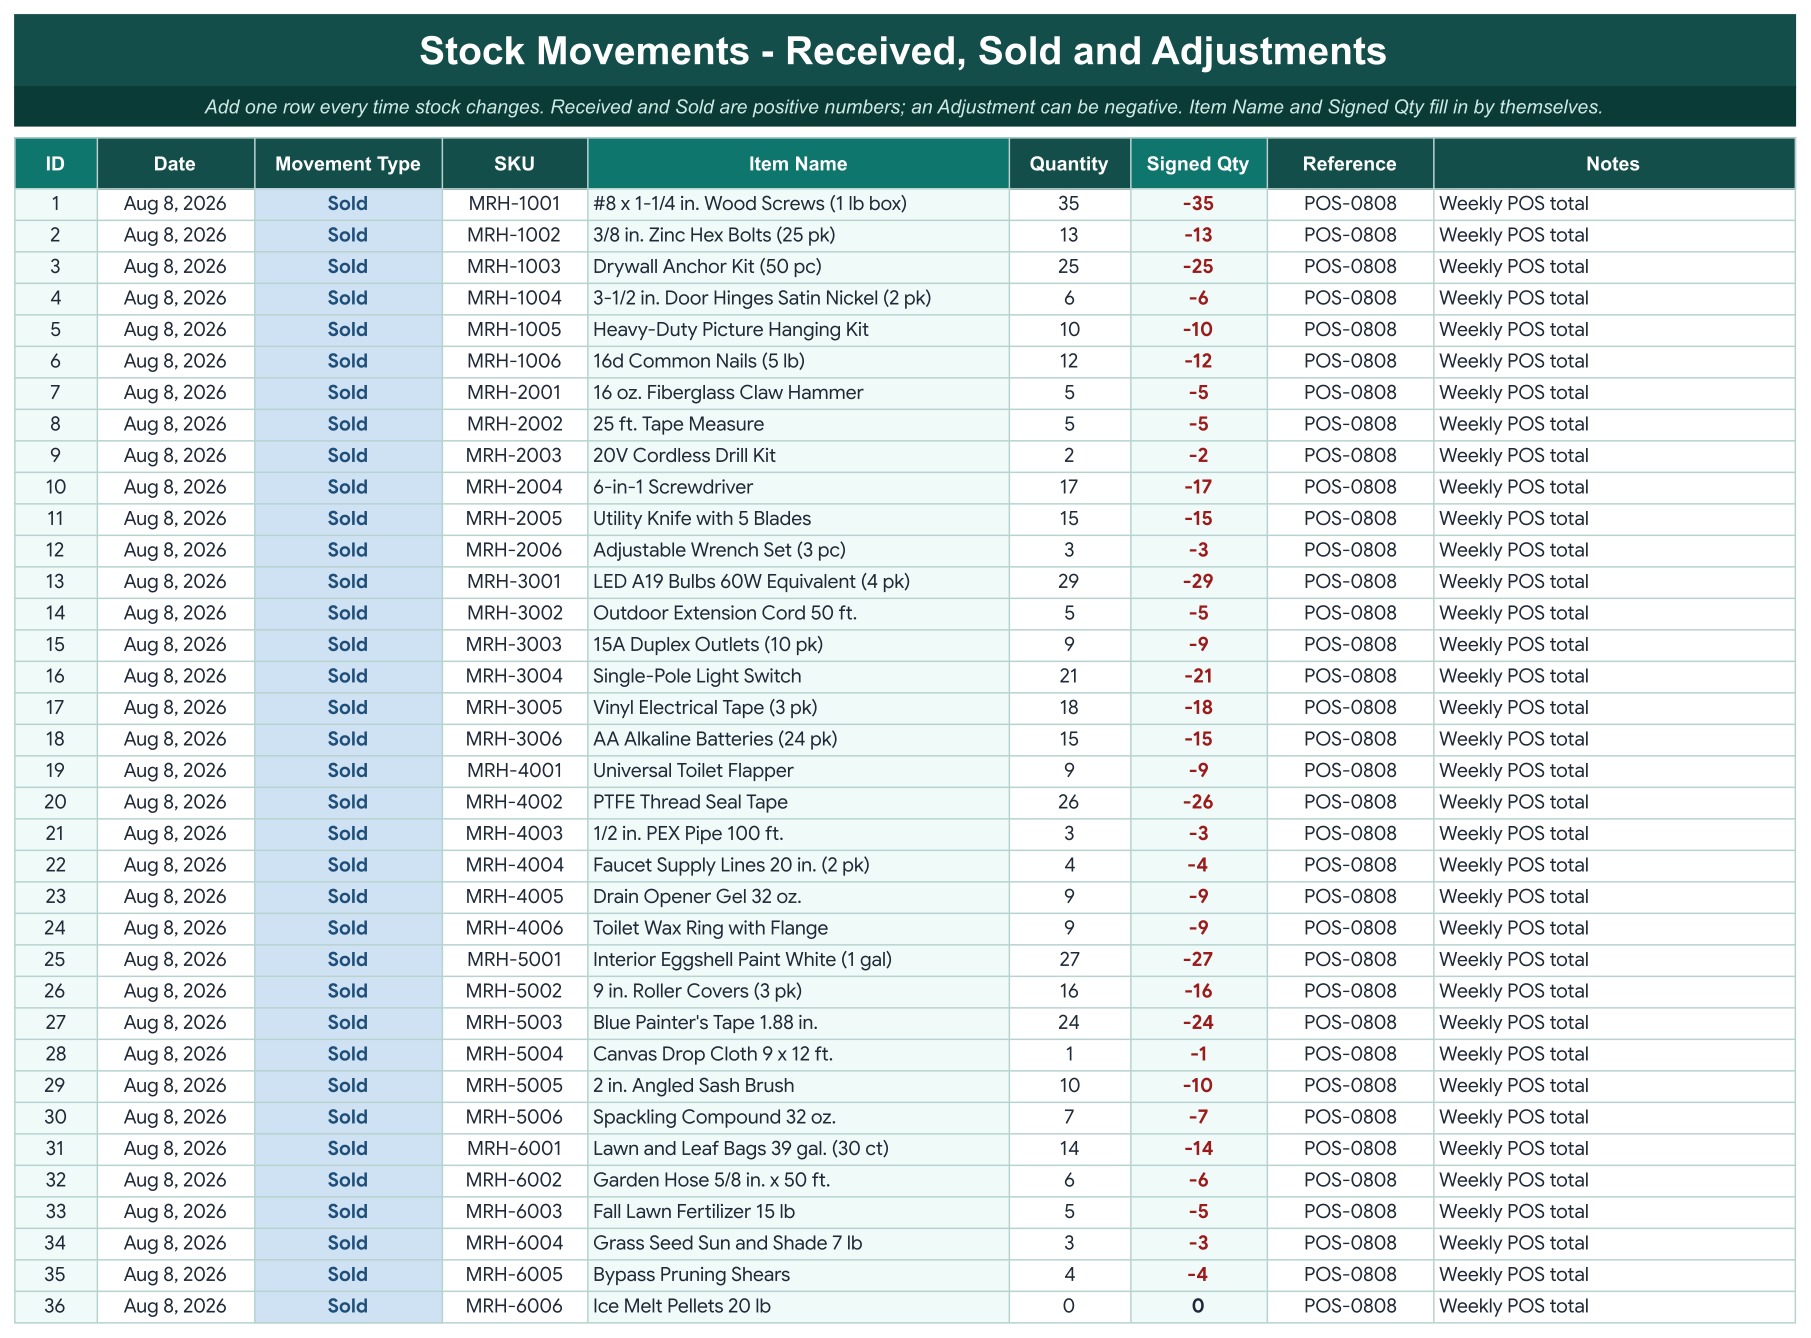
Stock Movements
One row for every Received, Sold or Adjustment. Pick the type, enter the SKU and the quantity, and the item name and signed quantity fill in for you. The sample holds weekly sales totals and every purchase order received from August to October 2026.
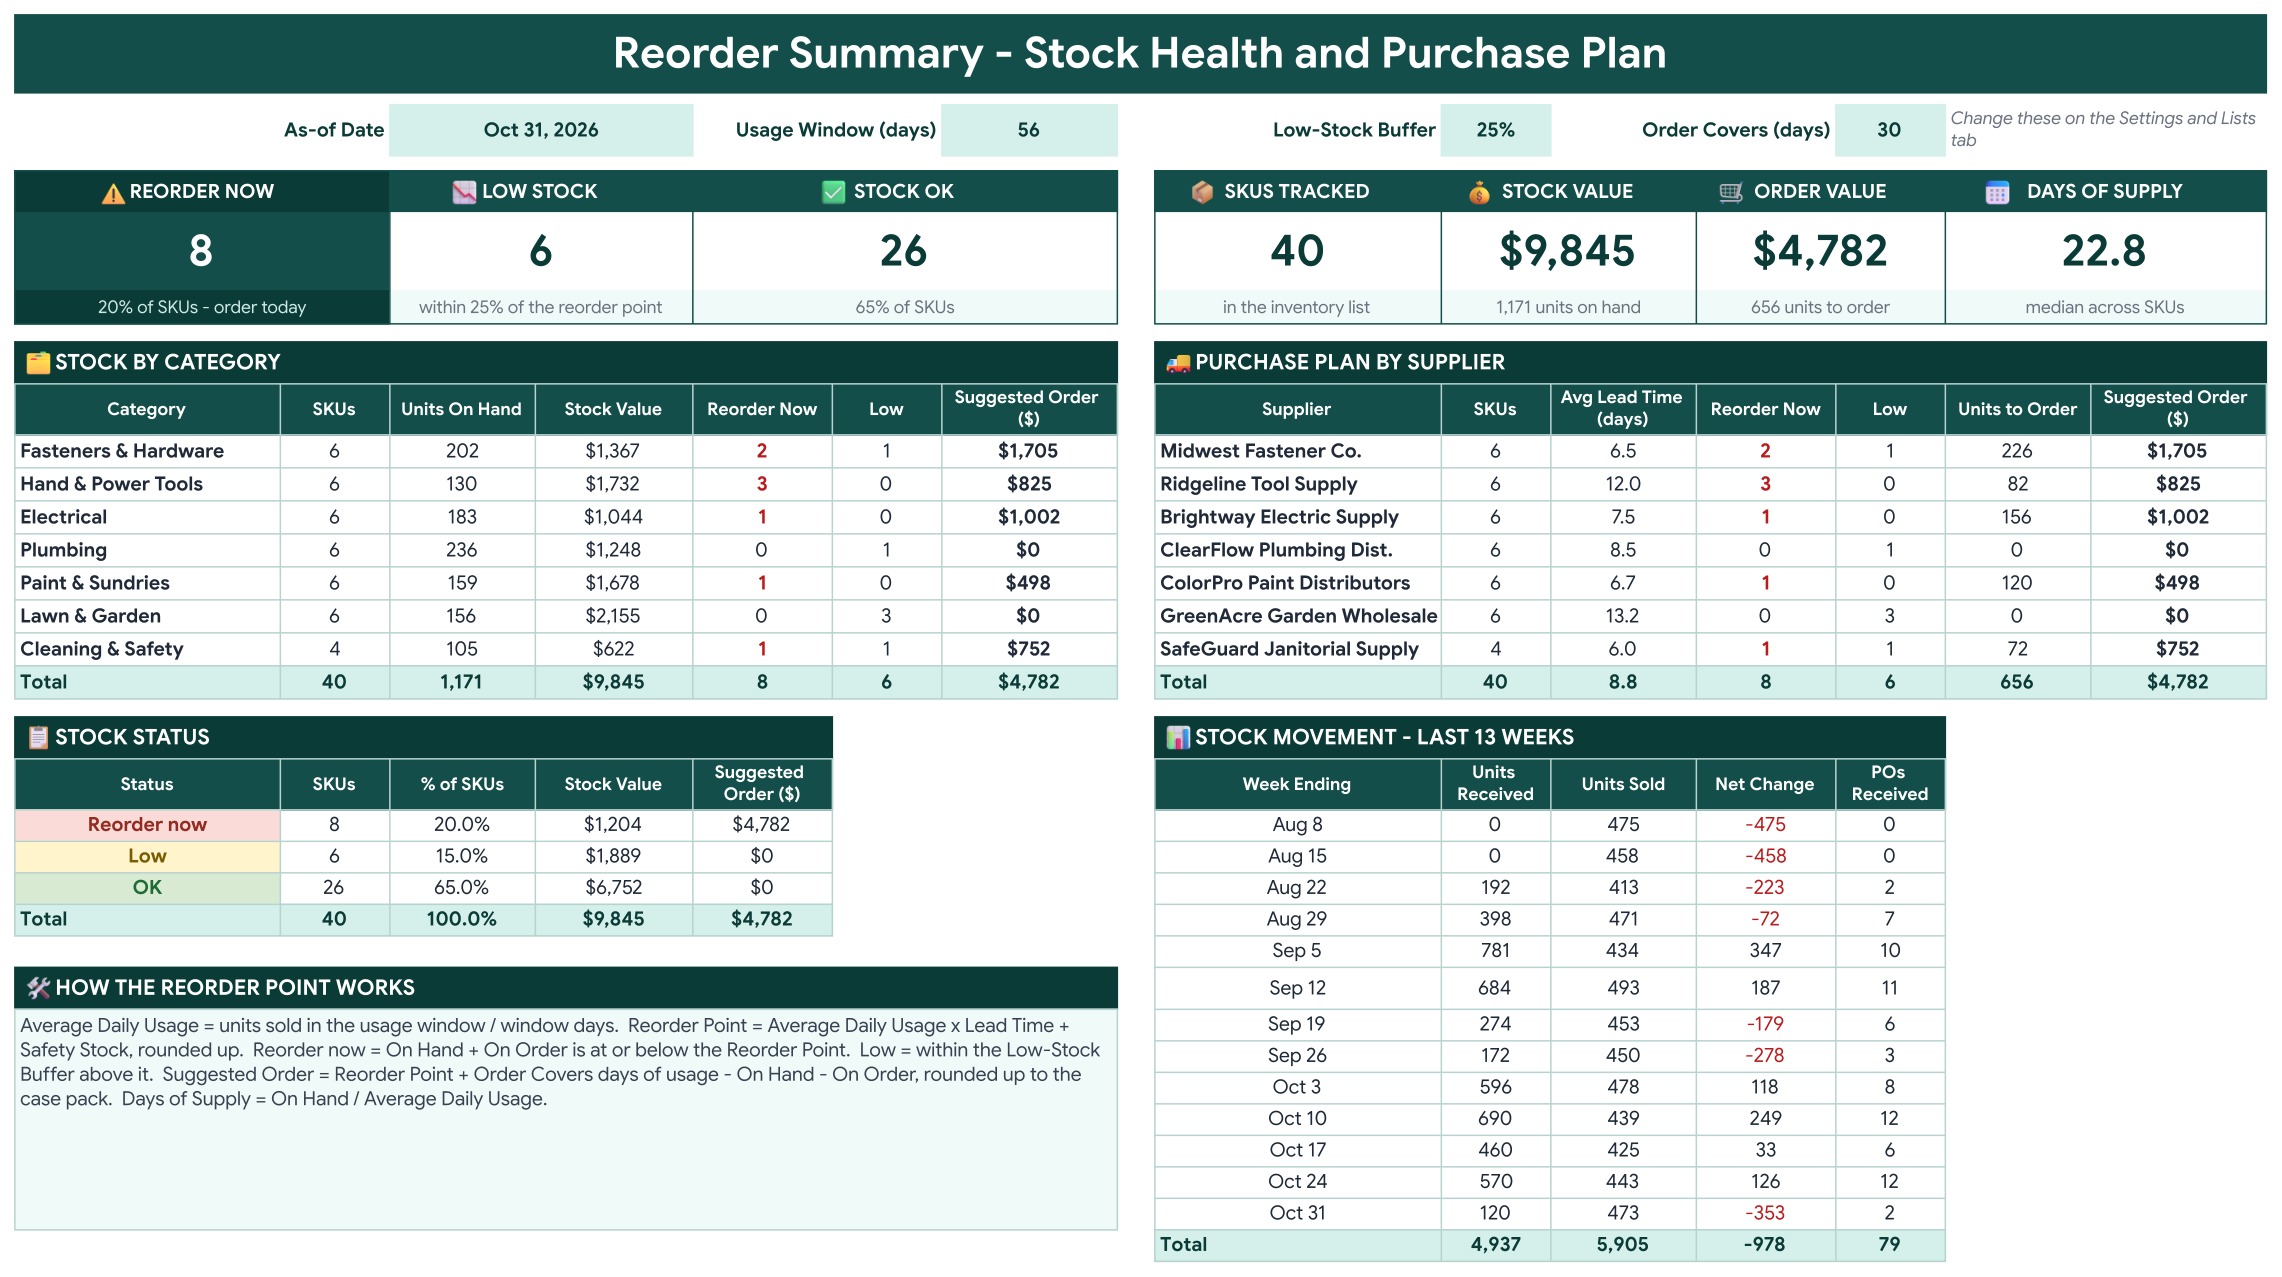
Reorder Summary
Seven KPI tiles show Reorder Now, Low Stock, Stock OK, SKUs Tracked, Stock Value, Order Value and the median Days of Supply. Below them are stock by category, a purchase plan by supplier with the units and dollars to order from each one, the stock status split and the last 13 weeks of units received and sold.
Settings and Lists
Set the as-of date, the opening count date, the usage window, the low-stock buffer and how many days a new order should cover. Rename the seven categories and seven suppliers to match your business.

How to Use
A step by step guide to setting up the file, logging stock movements and reading the reorder math.
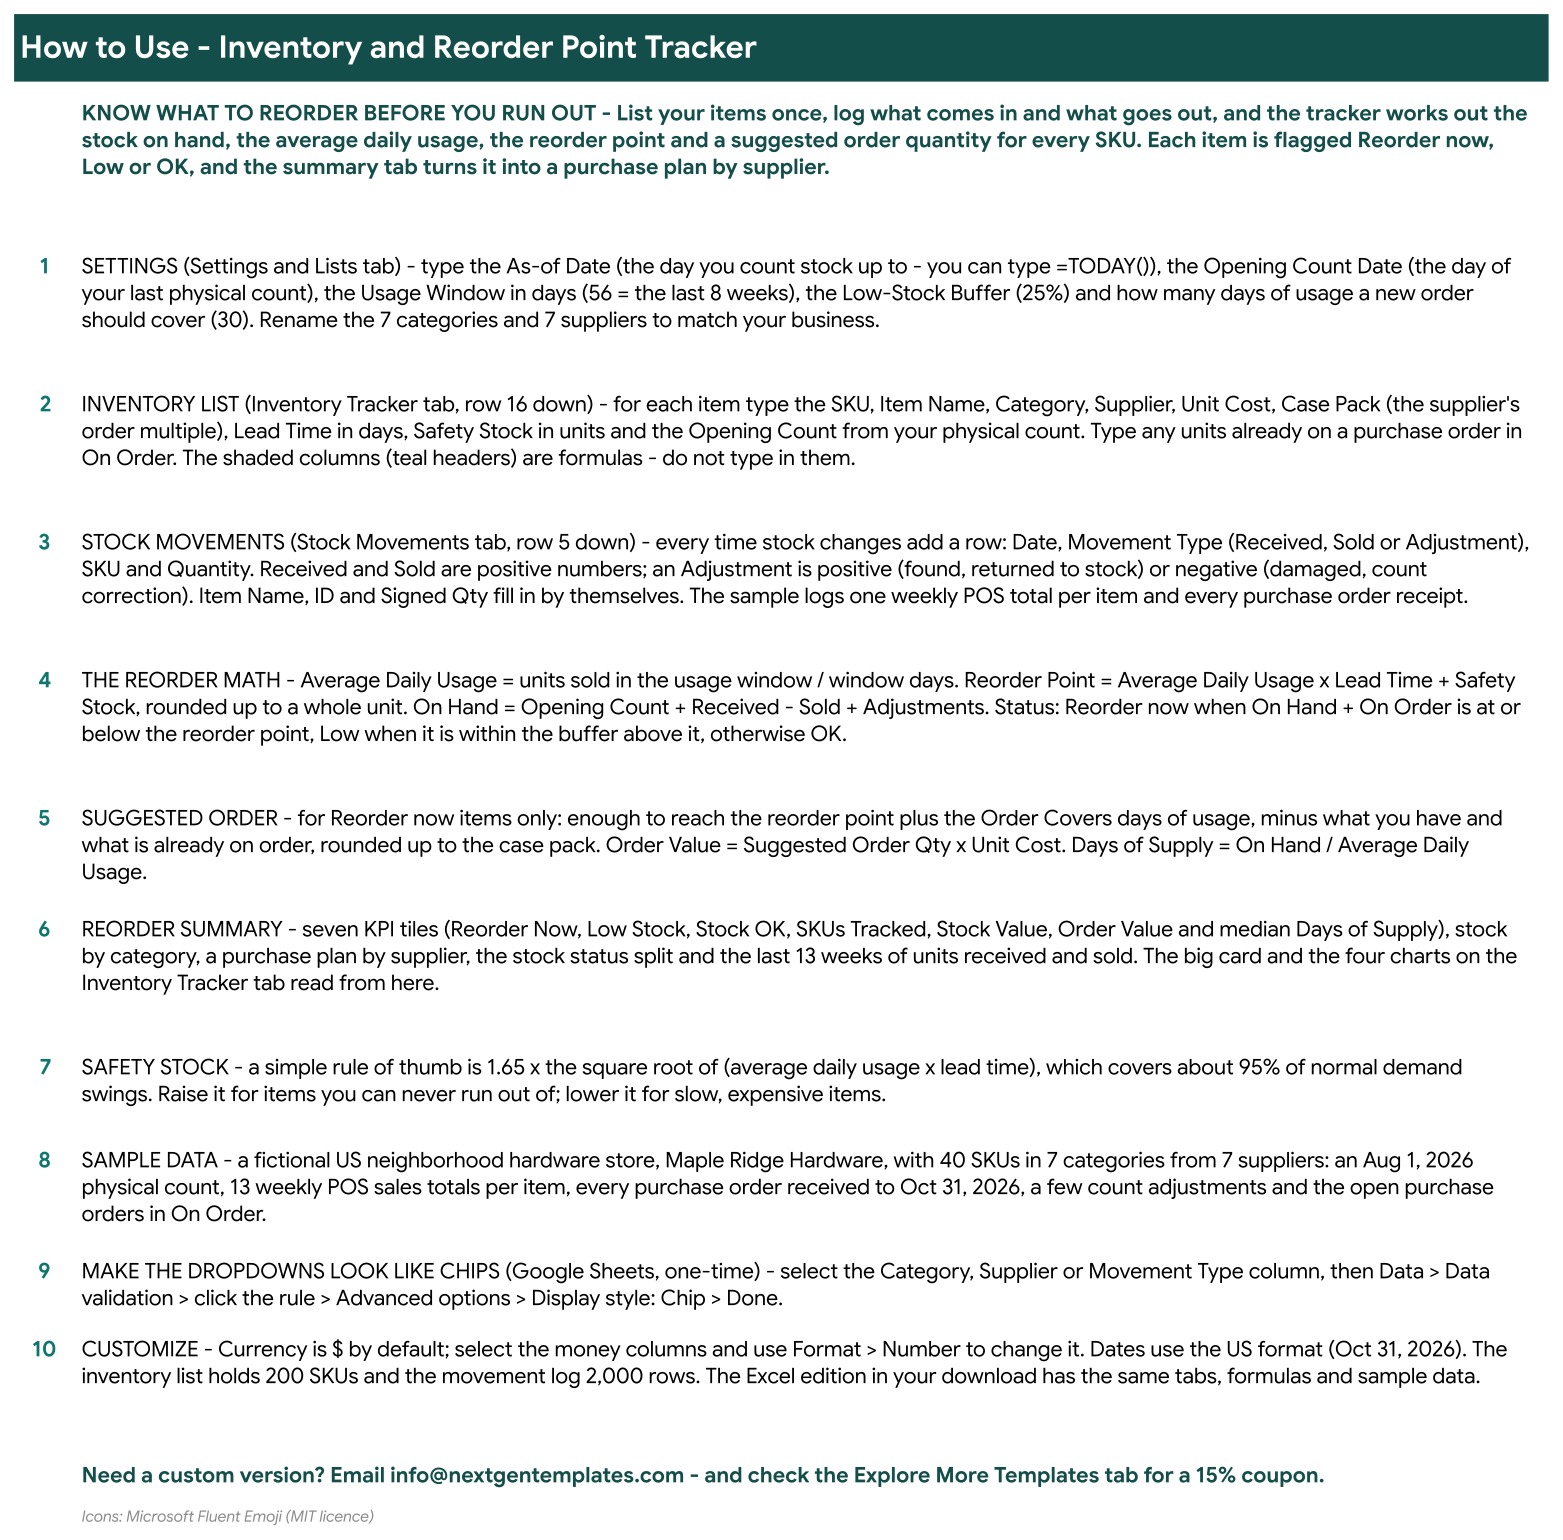
How the Reorder Math Works
On Hand is the opening count plus received, minus sold, plus adjustments. Average Daily Usage is the units sold in the usage window divided by the number of days in that window, 56 in the sample. The Reorder Point is the average daily usage times the lead time in days, plus the safety stock. The Status is Reorder now when on hand plus on order is at or below the reorder point, Low when it is within the buffer above it, and OK otherwise. The suggested order covers the number of days you set, minus what you already have, rounded up to the case pack.
Setting It Up for Your Stock
Start with a physical count and enter it as the opening count with its date. Then add lead times from your suppliers and a safety stock that matches how much risk you accept. Log movements at least weekly so the usage figures stay current. If your sales come from a point of sale report, you can enter weekly totals instead of every sale, as the sample does. Review the Reorder Summary each time you place orders, and adjust the usage window if your sales are seasonal.
Pros and Limits
- One list and one log drive every figure, in a file you already know how to use
- Google Sheets and Excel editions with the same formulas
- No subscription, macros or add-ons
- It does not connect to a point of sale, scanner or accounting system
- Suggestions depend on the lead times and safety stock you enter
Frequently Asked Questions
How does the tracker know when to reorder?
For every item it works out the average daily usage from recent sales, multiplies it by the lead time in days and adds your safety stock. That number is the reorder point. When stock on hand plus units on order falls to or below it, the Status column says Reorder now.
How is the suggested order quantity worked out?
It orders enough to reach the reorder point plus the number of cover days you set on the Settings tab, minus what you already have on hand and on order, rounded up to the case pack.
Do I get both Google Sheets and Excel?
Yes. One download holds the Excel workbook (.xlsx, no macros) and a PDF guide with the link to the Google Sheets edition. Both have the same tabs, formulas and sample data.
How do I record stock changes?
Add one row on the Stock Movements tab for every delivery, sale or correction. Choose Received, Sold or Adjustment, enter the SKU and the quantity. The item name and the signed quantity fill in by themselves.
Can I change the categories and suppliers?
Yes. The Settings and Lists tab holds seven categories and seven suppliers that you rename to match your business. The dropdowns on the Inventory Tracker follow.
Does it connect to my point of sale or accounting software?
No. You enter stock movements yourself, or paste weekly totals. There is no live link to any other system.
Does it need macros or add-ons?
No. It is formulas, dropdowns and charts only, in both editions.
Get the Inventory and Reorder Point Tracker
Get the template here: Inventory and Reorder Point Tracker in Excel and Google Sheets. If you need a full stock system with forms and users, see the Warehouse Inventory Management System Web App.