
Workforce planning is one of the most powerful strategies for building a productive, future-ready organization. When companies understand staffing levels, workforce capacity, hiring demand, employee utilization, and labor cost efficiency, they make smarter decisions and avoid talent gaps. However, manual analysis can lead to errors, outdated insights, and inefficient planning. The Workforce Planning KPI Dashboard in Google Sheets delivers a fast, modern, and automated way to monitor every critical workforce metric in one place.Workforce Planning KPI Dashboard in Google Sheets
This ready-to-use dashboard gives HR teams, workforce planners, and senior leadership real-time visibility into headcount trends, hiring performance, labor cost management, capacity planning, and overall workforce health. With automated MTD/YTD views, target vs actual comparisons, PY benchmarking, and dynamic trend charts, this Google Sheets dashboard helps organizations make confident, data-driven decisions.
✨ Key Features of the Workforce Planning KPI Dashboard in Google Sheets
📊 1. Real-Time Workforce Analysis
Track MTD and YTD workforce KPIs including staffing levels, utilization, hiring pipeline, labor expenses, capacity planning, and workforce distribution. All calculations and visuals update automatically.
🎯 2. Target vs Actual Comparison
Understand whether your workforce is meeting expected performance levels. The dashboard highlights results using:
-
🔼 Green Up Arrows (performance improved)
-
🔽 Red Down Arrows (performance declined)
This helps leadership take quick action without reading long reports.
📈 3. Year-over-Year Benchmarking
Compare actual performance to previous year numbers to identify long-term improvements or declining trends.
📉 4. Dynamic KPI Trend Charts
Analyze 12-month KPI movement in the KPI Trend Sheet. This helps forecast workforce demand, hiring needs, and capacity issues early.
📦 What’s Inside the Workforce Planning KPI Dashboard in Google Sheets
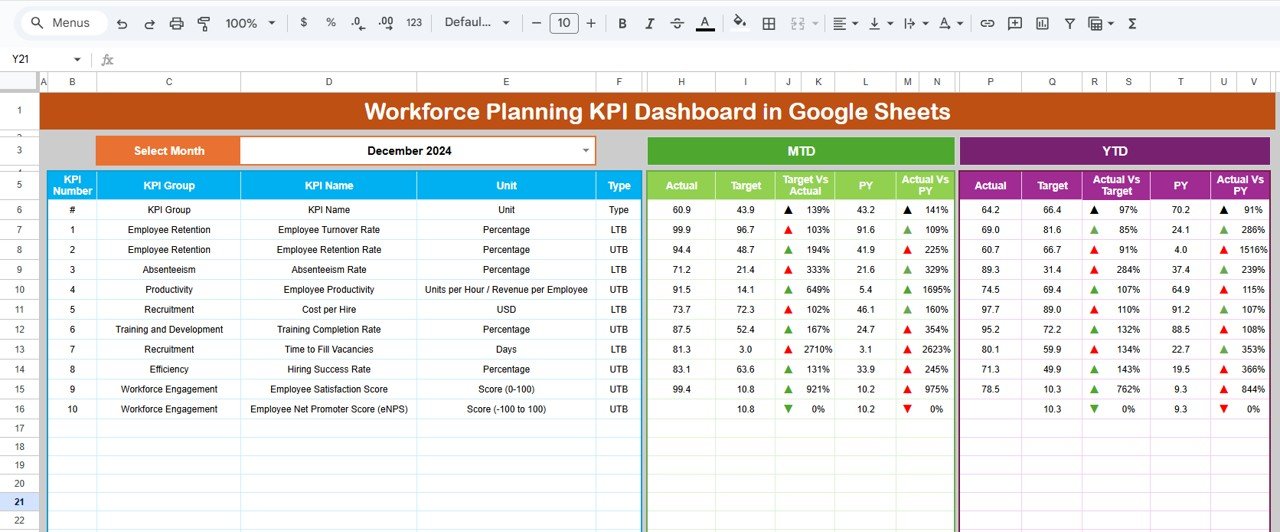
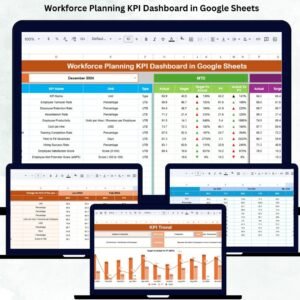
📍 1. Dashboard Sheet – Main KPI Dashboard
The core dashboard provides visual cards and charts for:
-
MTD Actual, Target, PY
-
YTD Actual, Target, PY
-
Target vs Actual comparison
-
PY vs Actual comparison
Selecting any month in cell D3 instantly refreshes the entire dashboard. This gives you a clean, interactive workforce planning experience.
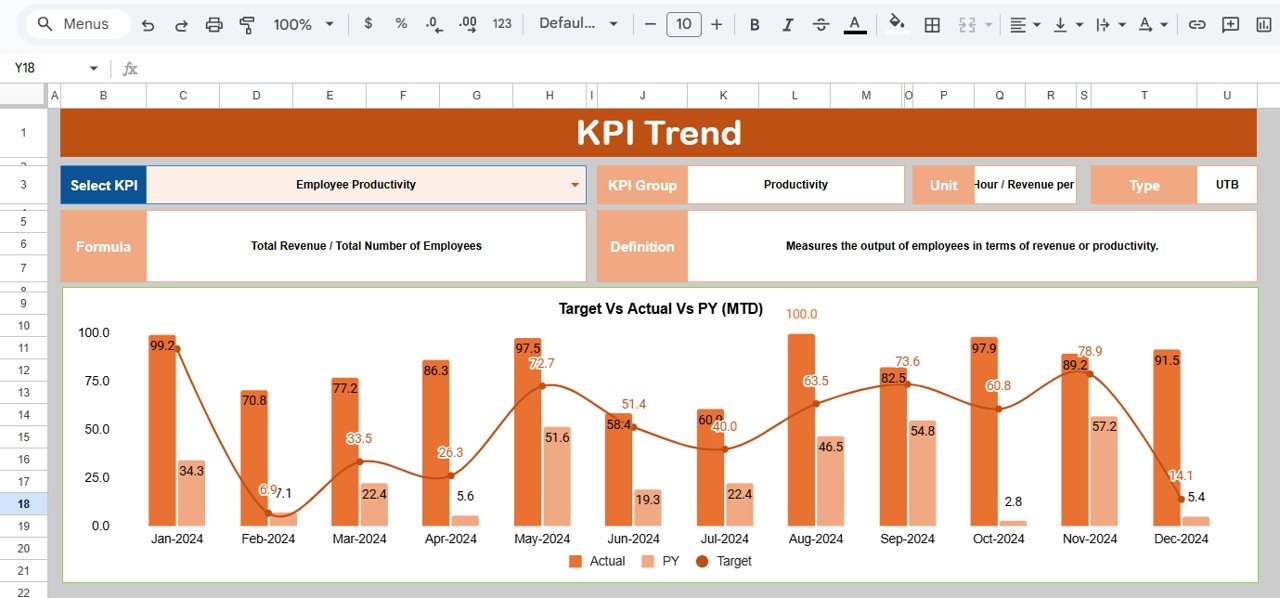
📈 2. KPI Trend Sheet – Long-Term KPI Monitoring
Choose any KPI from the dropdown in C3 and view:
-
KPI Group
-
Unit
-
KPI Type (UTB/LTB)
-
Formula
-
KPI Definition
-
Trend Chart
Perfect for analyzing shifts in headcount, hiring trends, capacity utilization, or labor costs.
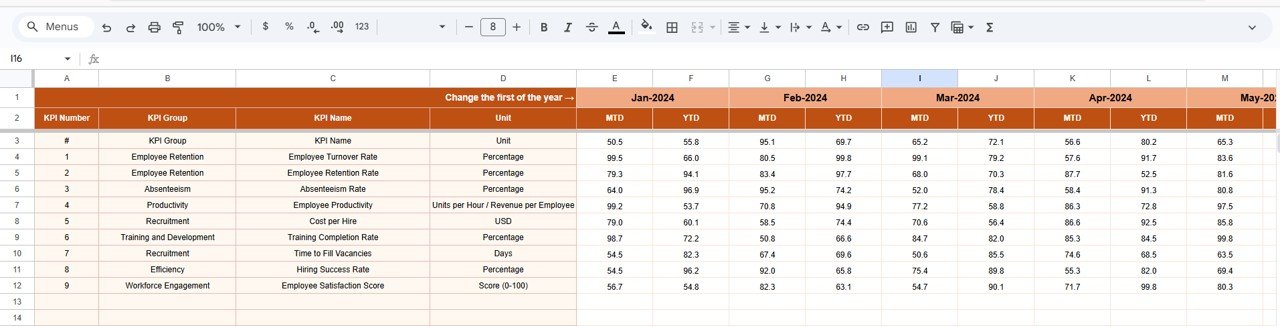
📋 3. Actual Number Sheet – Enter Real Workforce Data
Update your monthly MTD and YTD actual figures here. Changing the month in E1 updates all dashboards automatically.
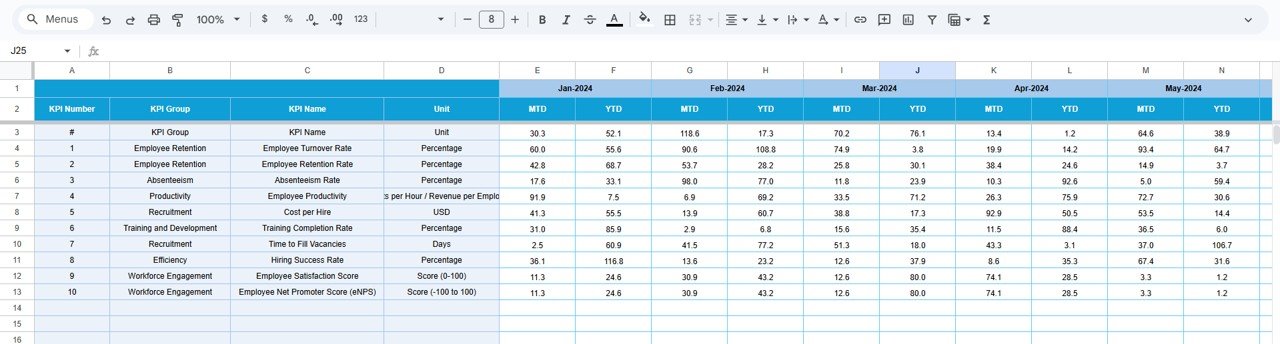
🎯 4. Target Sheet – Set Workforce Goals
Define clear monthly and yearly workforce targets. This helps HR teams align operational performance with long-term workforce strategy.
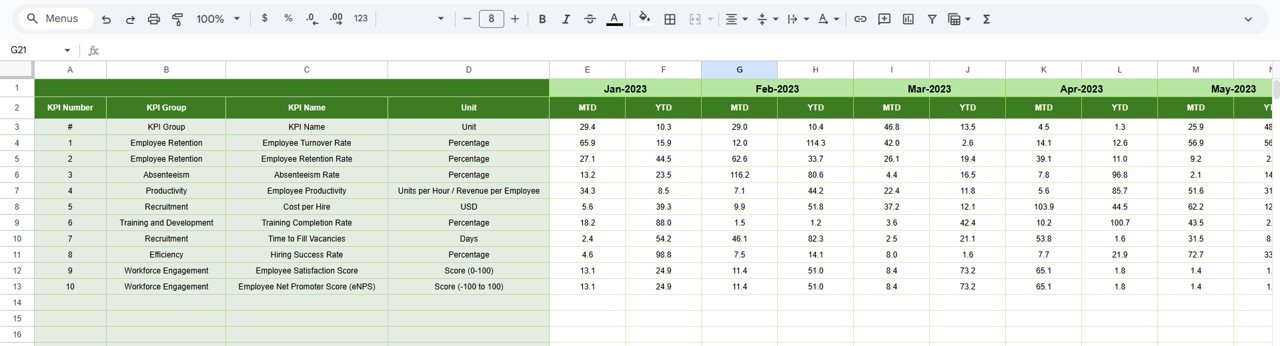
📅 5. Previous Year Sheet – Benchmark Historical Data
Enter previous year’s results for accurate PY vs Actual comparisons. This instantly improves workforce forecasting and planning accuracy.
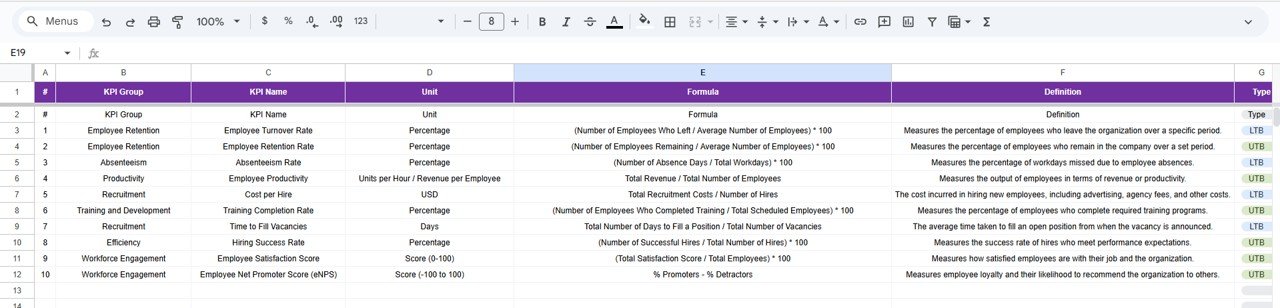
📚 6. KPI Definition Sheet – Full KPI Reference
This sheet contains:
-
KPI Name
-
Group
-
Formula
-
Unit
-
Definition
-
Performance Type (UTB / LTB)
Helps new team members understand workforce KPIs quickly.
🎯 Who Can Benefit from This Workforce Planning KPI Dashboard in Google Sheets
🏢 HR Departments
Monitor staffing, hiring pipeline, labor cost, and utilization.
📊 Workforce Analysts
Perform data-driven workforce forecasting and planning.
👨💼 Department Managers
Review team-level workforce capacity and staffing needs.
📈 Senior Leadership
Access visually clear workforce insights for strategic planning.
🤝 Multi-Location Teams
Collaborate using real-time data in the cloud.
Click here to read the Detailed blog post
Watch the step-by-step video Demo:


Reviews
There are no reviews yet.