Women empowerment NGOs are building stronger communities every day — supporting education, skill training, entrepreneurship, healthcare access, and rights protection. Women Empowerment NGOs KPI Dashboard in Power BI But while the mission is inspiring, tracking performance often feels overwhelming.
Multiple Excel files. Manual consolidation. Delayed reports.
Meanwhile, donors expect transparency. Boards demand measurable results.
What if you could transform scattered data into one powerful, interactive performance system?
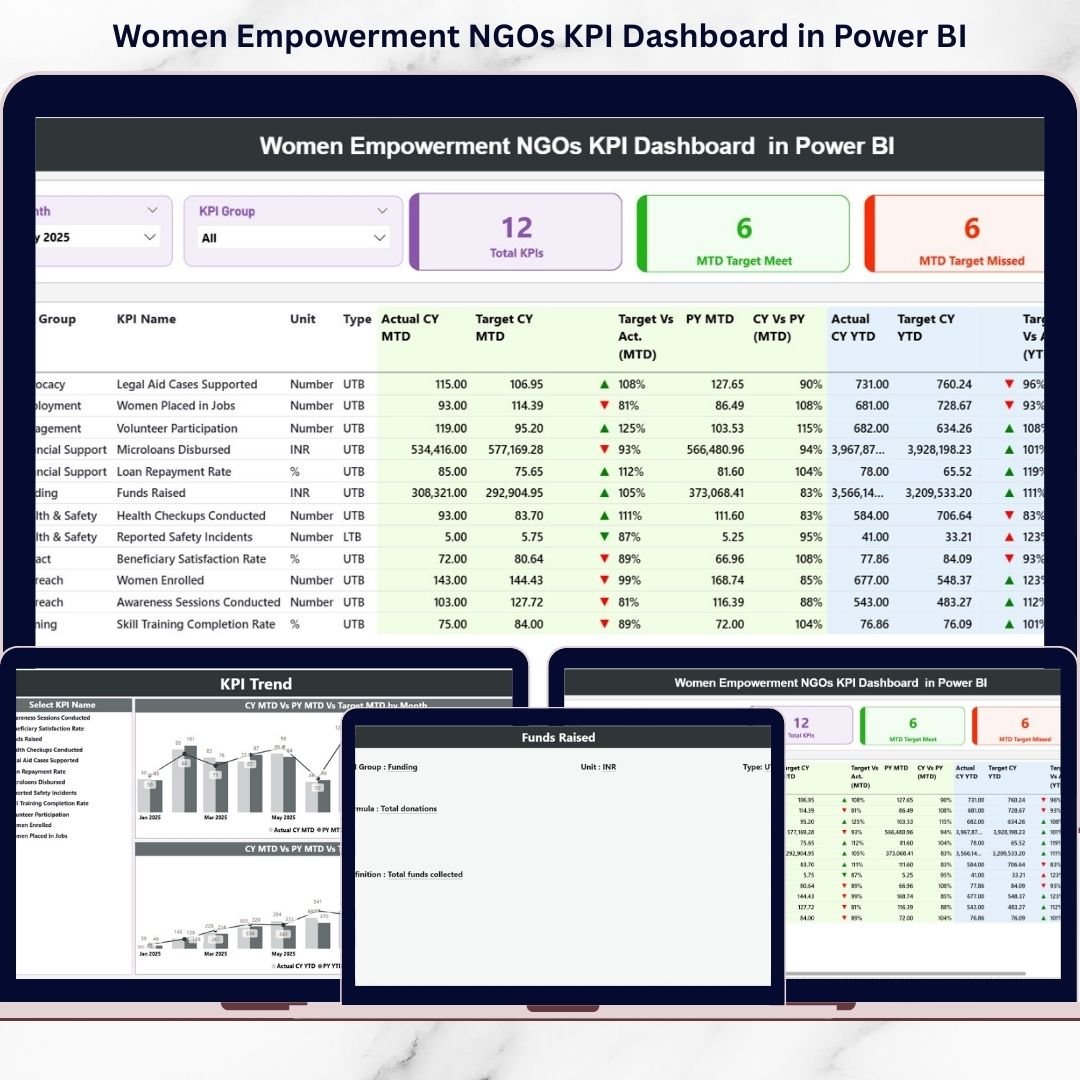
That’s exactly what the Women Empowerment NGOs KPI Dashboard in Power BI delivers. 🚀
Women Empowerment NGOs KPI Dashboard in Power BI This ready-to-use Power BI dashboard converts structured Excel data into dynamic visuals. Instead of spending hours compiling reports, you can monitor targets, actual performance, MTD and YTD progress, and year-over-year growth in seconds.
Professional. Visual. Data-driven.
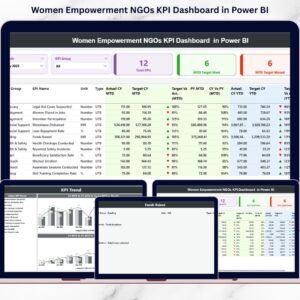
🚀 Key Feature of Women Empowerment NGOs KPI Dashboard in Power BI
This dashboard includes 3 fully interactive pages designed for complete NGO performance monitoring.
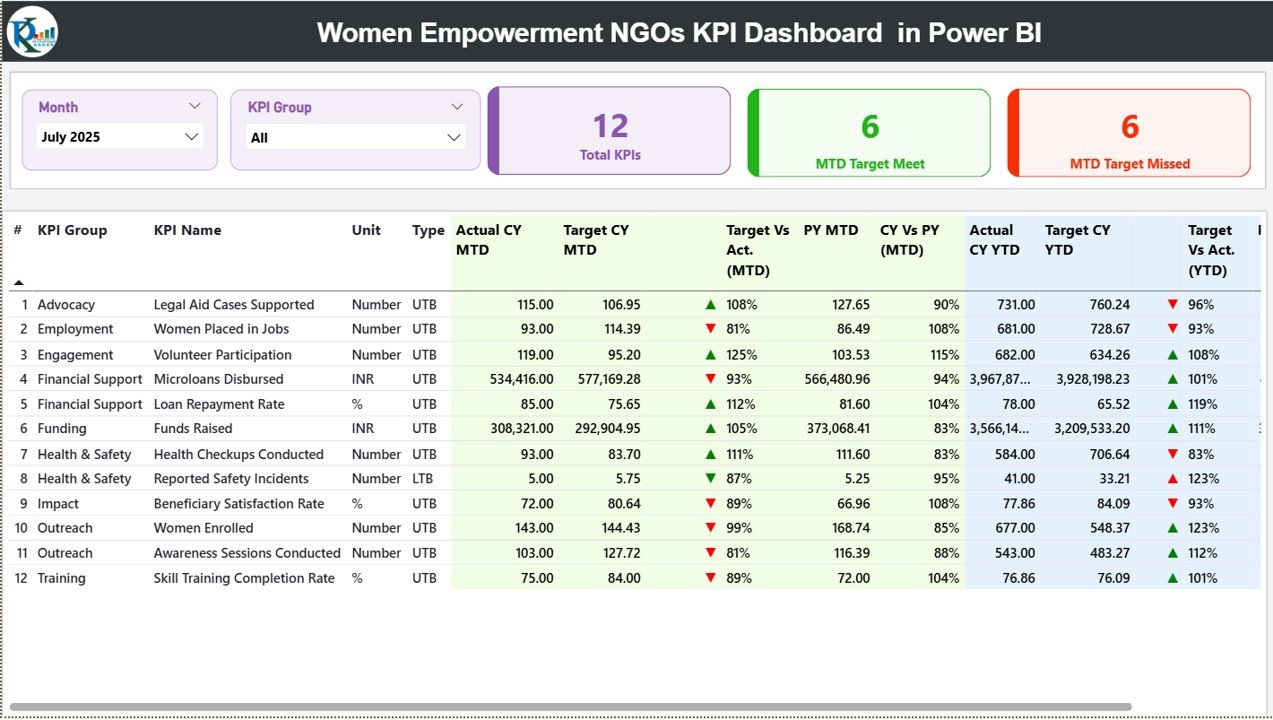
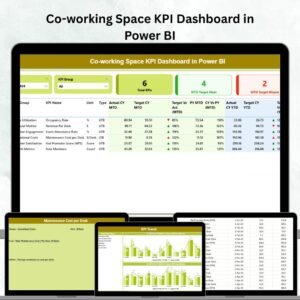
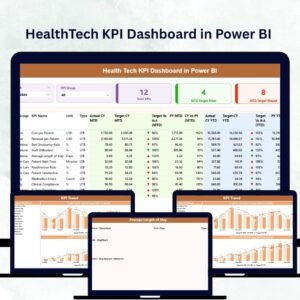
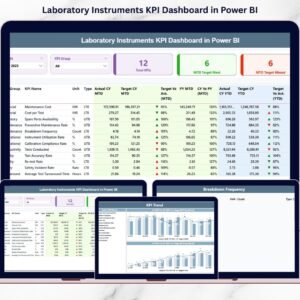
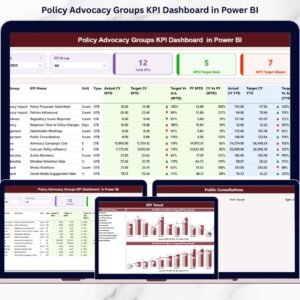
📊 Summary Page – Central Performance Overview
At the top, you get two powerful slicers:
✔ Month Slicer
✔ KPI Group Slicer
Three KPI cards instantly show:
✔ Total KPI Count
✔ MTD Target Meet Count
✔ MTD Target Missed Count
Below that, a detailed KPI table displays:
• KPI Number & Name
• KPI Group & Unit
• Type (LTB / UTB)
• Actual CY MTD & Target CY MTD
• ▲ / ▼ Performance Icons
• Target vs Actual %
• Previous Year MTD
• CY vs PY %
• YTD Actual vs Target
• YTD Variance & Icons
🟢 Green Arrow (▲) = Target Achieved
🔴 Red Arrow (▼) = Underperformance
You instantly see where action is required.
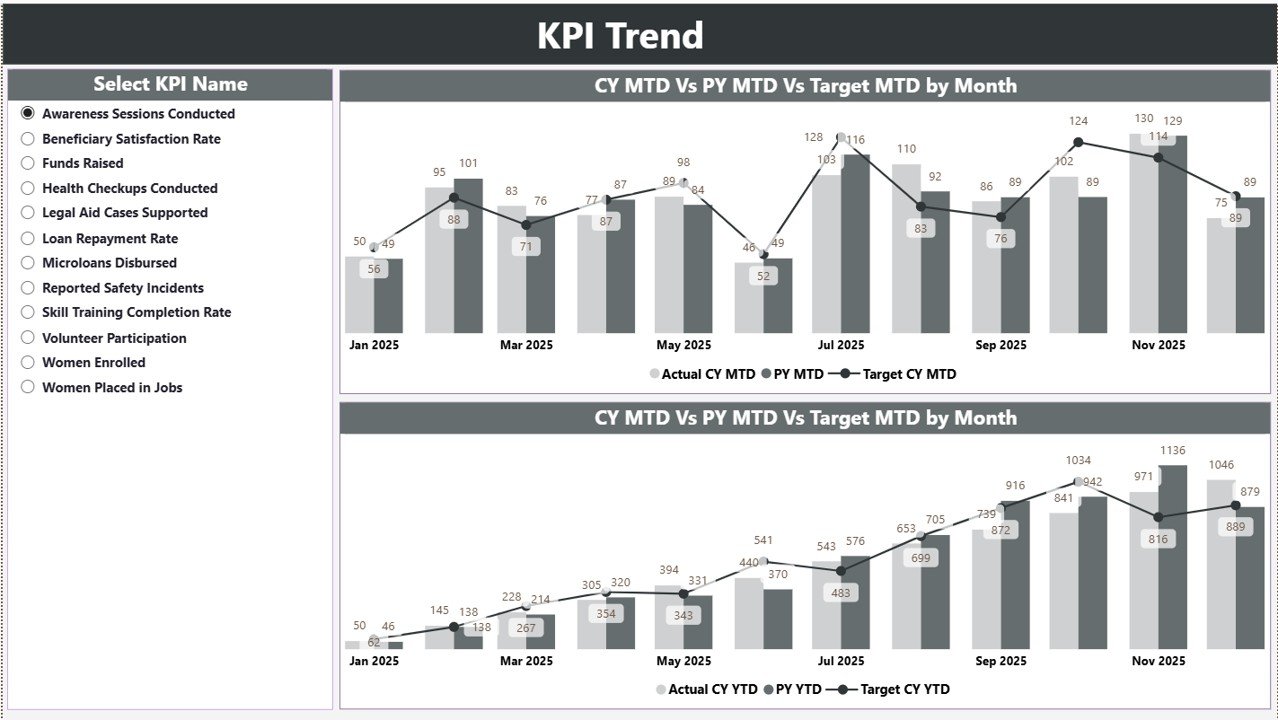
📈 KPI Trend Page – Performance Over Time
Select any KPI using the slicer and analyze:
✔ MTD Combo Chart (Actual vs Target vs PY)
✔ YTD Combo Chart (Actual vs Target vs PY)
These visuals help you identify growth trends, performance dips, and seasonal patterns.
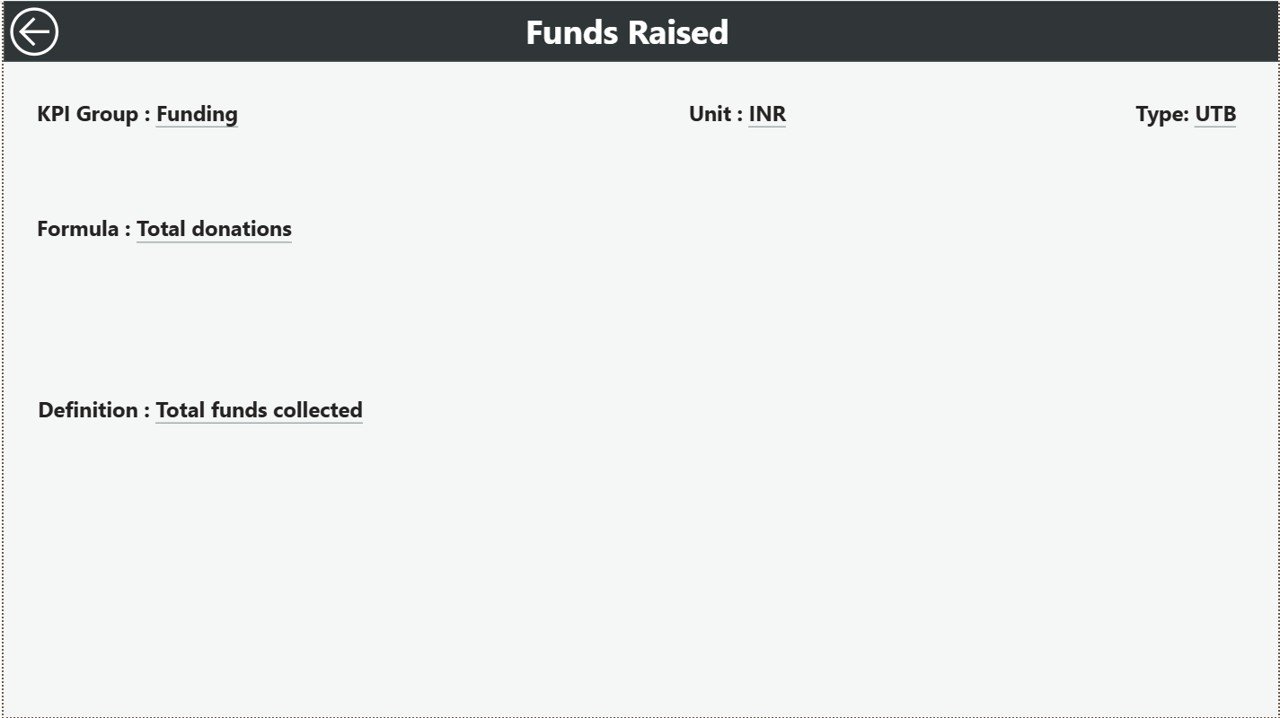
📘 KPI Definition Page – Drill-Through Transparency
Click on any KPI and drill through to view:
✔ KPI Formula
✔ KPI Definition
✔ KPI Group
✔ Unit of Measurement
✔ KPI Type
This ensures complete clarity and governance.
📦 What’s Inside the Women Empowerment NGOs KPI Dashboard in Power BI
When you purchase this dashboard, you receive:
✔ 3 interactive Power BI pages
✔ Month & KPI Group slicers
✔ MTD & YTD comparison system
✔ Target vs Actual variance logic
✔ Previous Year benchmarking
✔ Conditional performance indicators
✔ Drill-through KPI documentation
✔ Excel-integrated data model
This is not just a dashboard — it’s a complete NGO impact reporting system.
🛠 How to Use the Women Empowerment NGOs KPI Dashboard in Power BI
Using the dashboard is simple:
1️⃣ Enter data in Excel (Input Actual, Input Target, KPI Definition sheets).
2️⃣ Open Power BI Desktop.
3️⃣ Click Refresh.
The dashboard updates automatically.
To analyze performance:
✔ Select Month from slicer
✔ Filter KPI Group
✔ Review MTD & YTD results
✔ Drill through to see detailed KPI logic
No advanced Power BI skills required.
👩💼 Who Can Benefit from This Women Empowerment NGOs KPI Dashboard in Power BI
This dashboard is ideal for:
🌍 Women Empowerment NGOs
🎓 Skill Development Programs
💼 Entrepreneurship Support Projects
🏥 Health & Awareness Campaigns
📊 Donor Reporting Teams
👩💼 Executive Leadership & Board Members
Whether you operate locally or internationally, this dashboard brings professional visibility to your impact.
The Women Empowerment NGOs KPI Dashboard in Power BI helps you:
✔ Improve transparency
✔ Strengthen accountability
✔ Identify performance gaps early
✔ Enhance donor confidence
✔ Optimize program efficiency
✔ Track year-over-year growth
Instead of reactive reporting, you move toward proactive management.
If your NGO wants structured, visual, and data-driven impact reporting, this Power BI dashboard is your essential tool.
Click here to read the Detailed blog post
Visit our YouTube channel to learn step-by-step video tutorials:
👉 https://youtube.com/@PKAnExcelExpert