


Planning a wedding is both exciting and complex. Wedding planners must manage budgets, vendors, timelines, guest counts, service quality, and multiple deliverables simultaneously. However, when planning data remains scattered across notebooks, emails, and multiple Excel files, mistakes increase and stress levels rise.
That is exactly why the Wedding Planning KPI Dashboard in Excel becomes an essential performance management tool for professional wedding planners and event management teams.
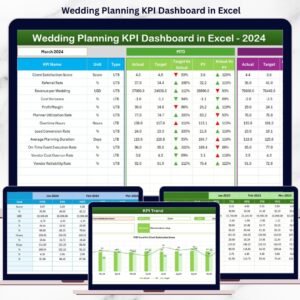
This ready-to-use Excel dashboard converts wedding planning data into clear KPIs, performance indicators, and trend insights. Instead of manually tracking costs, schedules, and performance, planners gain a single, structured view of wedding progress, financial control, and service execution—all in one Excel file.
Whether you manage individual weddings, destination events, or large-scale event portfolios, this dashboard helps you stay organized, control budgets, meet timelines, and deliver exceptional client experiences.
🚀 Key Features of Wedding Planning KPI Dashboard in Excel
💍 Centralized Wedding KPI Tracking
Track all wedding planning KPIs in one structured Excel dashboard.
📅 MTD & YTD Performance Monitoring
Analyze short-term progress and overall planning performance.
🎯 Target vs Actual Analysis
Compare planned vs actual performance for budgets, timelines, and services.
📈 KPI Trend Analysis
Identify performance patterns and planning risks over time.
🚦 Visual Performance Indicators
Green ▲ and Red ▼ arrows highlight issues instantly.
⚙️ 100% Excel-Based Solution
No additional software required—simple, flexible, and cost-effective.
🧠 Clear KPI Definitions
Standardized KPI formulas and definitions ensure clarity across teams.
📂 What’s Inside the Wedding Planning KPI Dashboard in Excel
🏠 Home Sheet – Easy Navigation
The Home Sheet works as the dashboard’s navigation hub.

🔘 Key Highlights
-
Six clearly labeled navigation buttons
-
One-click access to all worksheets
-
Clean, planner-friendly layout
As a result, users move through the dashboard quickly without searching through tabs.
📊 Dashboard Sheet – Complete KPI Overview
The Dashboard Sheet is the core analytical page of the workbook.
📅 Month Selection
On cell D3, users select the reporting month. Once selected, all KPIs update automatically for that month.
📈 KPI Metrics Displayed
The dashboard shows both MTD (Month-to-Date) and YTD (Year-to-Date) metrics.
MTD Analysis
-
Actual
-
Target
-
Previous Year
-
Target vs Actual (%)
-
Previous Year vs Actual (%)
YTD Analysis
-
Actual
-
Target
-
Previous Year
-
Target vs Actual (%)
-
Previous Year vs Actual (%)
🚦 Visual Indicators
-
Green ▲ → On track
-
Red ▼ → Needs attention
Therefore, planners can spot issues immediately without deep number analysis.
📈 KPI Trend Sheet – Detailed Planning Insights
The KPI Trend Sheet allows planners to analyze individual KPIs deeply.
🎯 KPI Selection
Select a KPI from the drop-down on cell C3.
📋 KPI Details Displayed
-
KPI Group
-
Unit of Measurement
-
KPI Type (UTB / LTB)
-
KPI Formula
-
KPI Definition
📊 Trend Charts
-
MTD Trend Chart – Actual vs Target vs Previous Year
-
YTD Trend Chart – Actual vs Target vs Previous Year
These charts help planners identify seasonality, delays, and recurring planning issues.
📝 Supporting Input Sheets
📌 Actual Numbers Input Sheet
Enter real wedding performance data (costs, completion, delivery).
🎯 Target Sheet
Store planned MTD and YTD targets for each KPI.
📆 Previous Year Number Sheet
Enable year-over-year performance comparison.
📘 KPI Definition Sheet
Maintain KPI names, groups, units, formulas, and definitions.
This structure ensures accuracy, transparency, and consistency.
👥 Who Should Use This Dashboard
💍 Wedding planners
🎉 Event management agencies
🏝 Destination wedding planners
📋 Freelance coordinators
🏨 Hospitality & event teams
🔎 Click here to read the detailed blog post
📺 Visit our YouTube channel for step-by-step tutorials
👉 https://youtube.com/@PKAnExcelExpert


Reviews
There are no reviews yet.