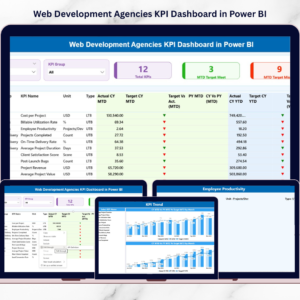
Running a web development agency is not easy. You manage clients, projects, developers, deadlines, budgets, and performance targets — all at once. Yet many agencies still rely on scattered Excel sheets and manual reporting. That approach slows decisions and hides performance gaps.Now imagine having complete control over revenue, delivery, team productivity, and client performance in one powerful dashboard.That is exactly what the Web Development Agencies KPI Dashboard in Power BI delivers.This ready-to-use, professionally designed dashboard transforms raw Excel data into interactive, visual insights. Instead of spending hours compiling reports, you can monitor MTD, YTD, and year-over-year performance in seconds.
It is not just a report. It is your agency’s performance command center.
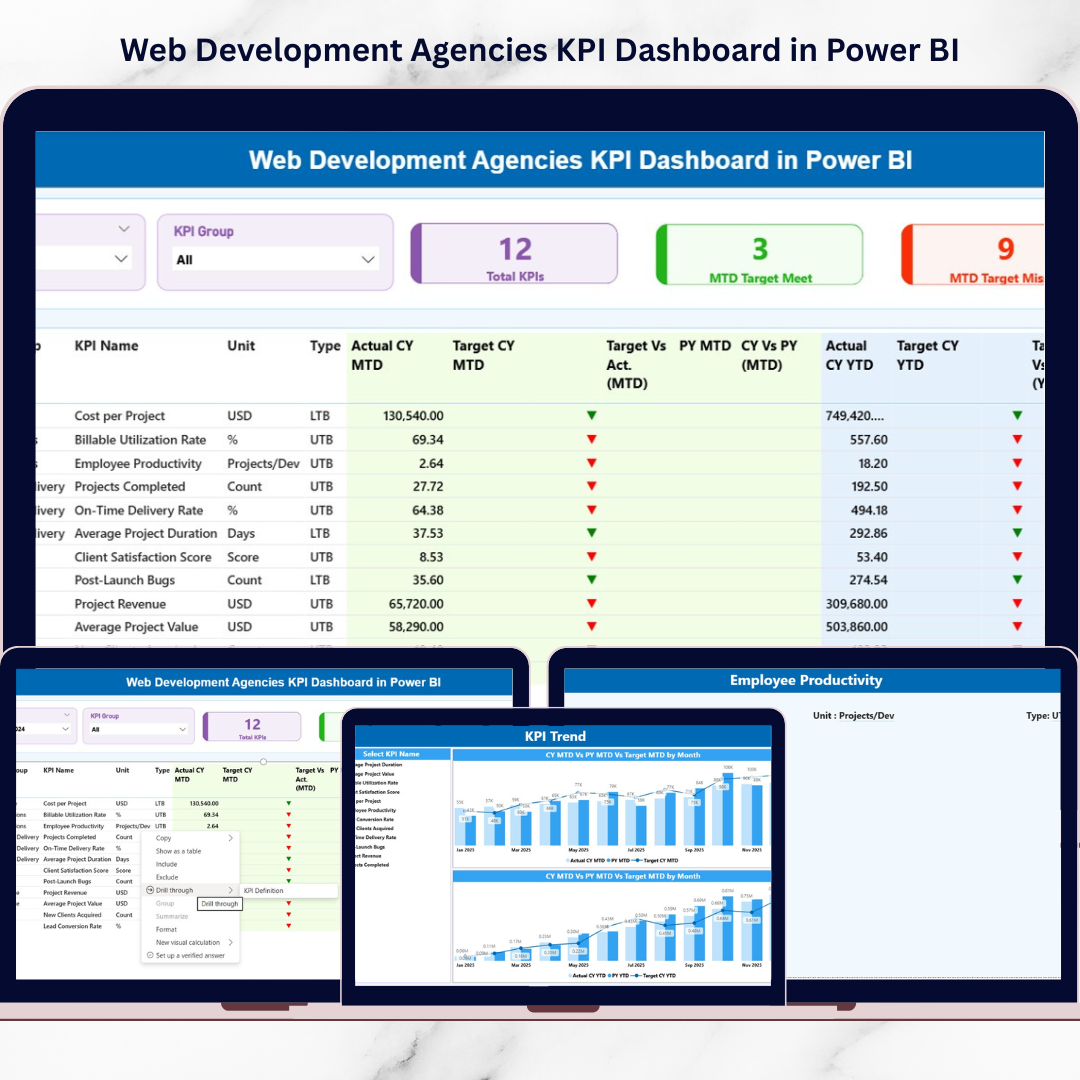
🚀 Key Feature of Web Development Agencies KPI Dashboard in Power BI
✨ 3 Interactive Pages – Summary, KPI Trend, and KPI Definition (Drill-Through).
📊 Smart Slicers – Filter by Month and KPI Group instantly.
📈 MTD & YTD Tracking – Monitor short-term and long-term performance side by side.
🎯 Target vs Actual Analysis – Instantly identify target meets and misses.
🔁 Year-over-Year Comparison – Compare Current Year vs Previous Year performance.
🟢🔴 Visual Performance Icons – Green ▲ and Red ▼ indicators for quick insights.
📘 Drill-Through KPI Definitions – View formula, unit, and KPI logic instantly.
🔗 Excel Data Integration – Simple data updates without technical complexity.
📦 What’s Inside the Web Development Agencies KPI Dashboard in Power BI
This dashboard includes:
✔ Power BI Desktop File (.pbix)
✔ Structured Excel Data Source
✔ Input_Actual Sheet – Enter MTD & YTD actual values
✔ Input_Target Sheet – Maintain monthly targets
✔ KPI Definition Sheet – Manage KPI number, group, formula, type
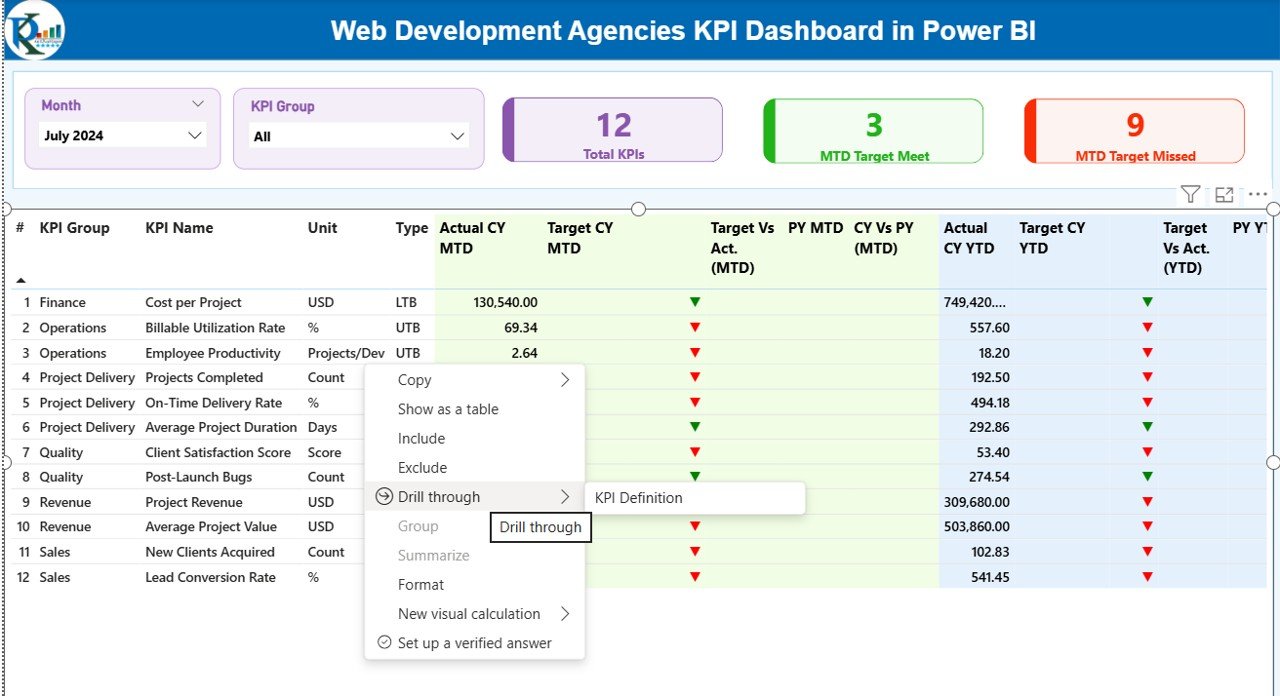
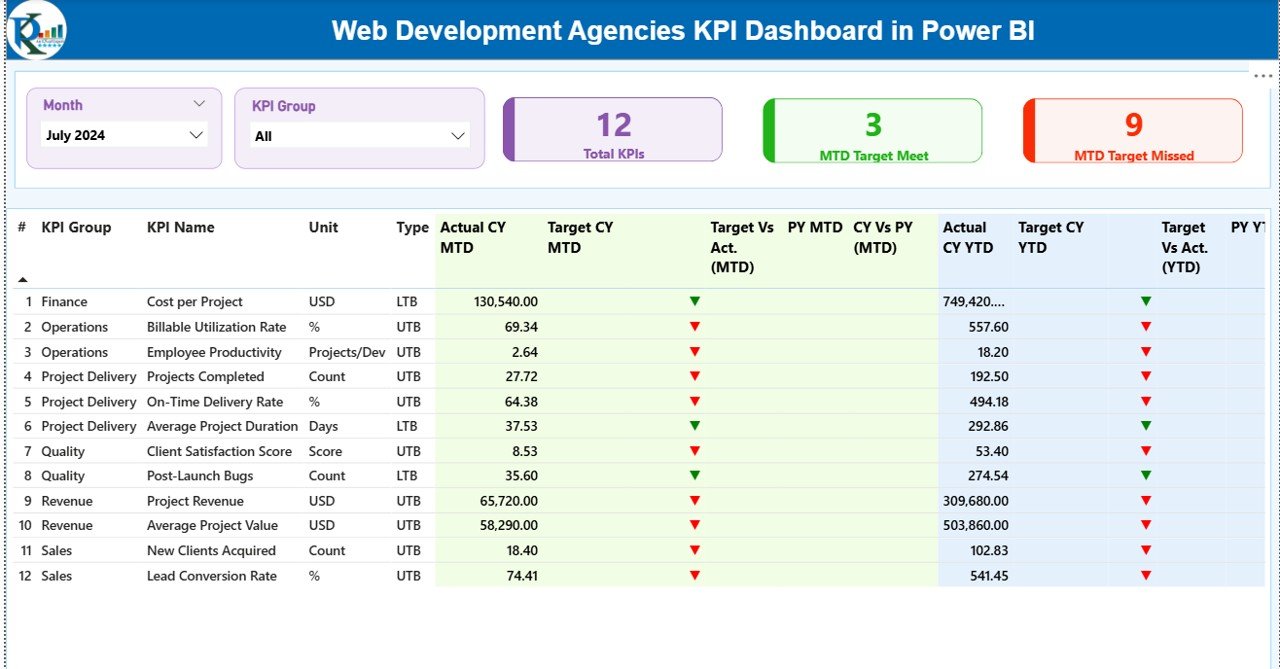
The Summary Page provides:
-
KPI Count
-
Target Meet Count
-
Target Miss Count
-
Financial KPIs
-
Project Delivery KPIs
-
Client Performance KPIs
-
Operational KPIs
-
Team Productivity KPIs
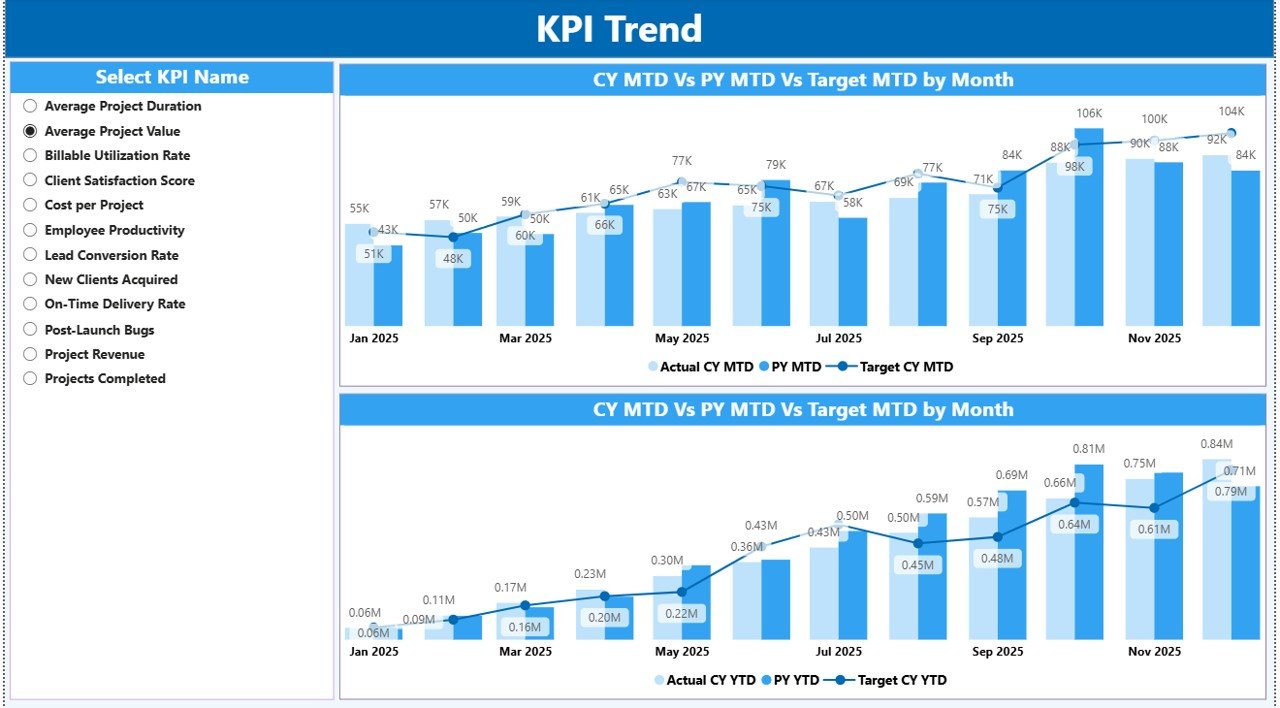
The KPI Trend Page includes dynamic combo charts that compare:
-
Current Year Actual
-
Previous Year Actual
-
Target Values
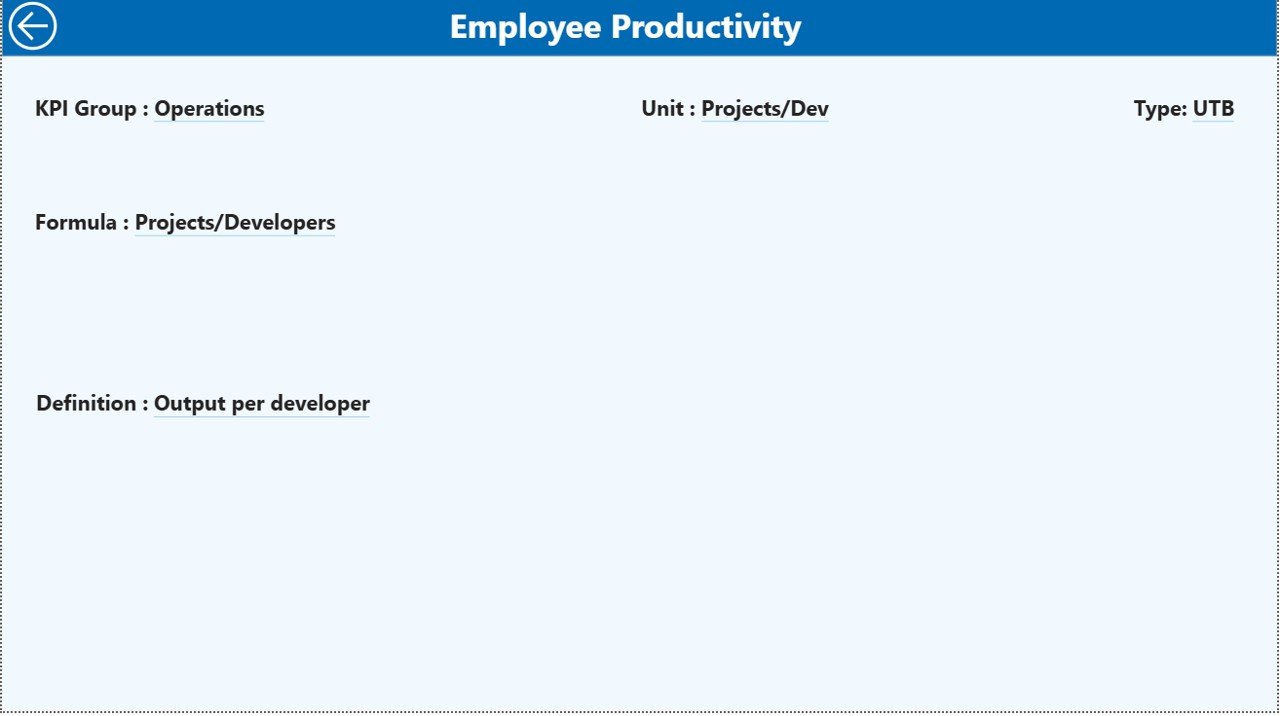
The KPI Definition Page ensures clarity by showing:
-
Formula
-
Definition
-
KPI Type (LTB or UTB)
-
Unit of Measurement
Everything stays structured and professional.
🛠 How to Use the Web Development Agencies KPI Dashboard in Power BI
Using this dashboard is simple:
1️⃣ Update actual values in the Input_Actual Excel sheet.
2️⃣ Update target values in the Input_Target sheet.
3️⃣ Maintain KPI details inside the KPI Definition sheet.
4️⃣ Refresh Power BI.
The dashboard automatically updates all visuals, charts, and comparisons.
You do not need advanced technical skills. If you can update Excel, you can manage this dashboard.
🎯 Who Can Benefit from This Web Development Agencies KPI Dashboard in Power BI
This dashboard is ideal for:
👨💼 Agency Owners – Track revenue growth and profitability.
📂 Project Managers – Monitor delivery performance and deadlines.
💰 Finance Teams – Analyze targets, margins, and year-over-year growth.
📊 Operations Heads – Improve efficiency and accountability.
📈 Business Analysts – Perform structured performance reviews.
Whether you run a small boutique agency or a growing enterprise-level web firm, this dashboard helps you scale with confidence.
By implementing this dashboard, you gain:
Real-time visibility
Better accountability
Improved client retention
Faster strategic decisions
Stronger profitability
Instead of reacting late, you act early. Instead of guessing, you rely on data.
If you want to stop chasing reports and start controlling performance, this dashboard gives you the foundation.
Click hare to read the Detailed blog post
Watch the step-by-step video tutorial: