


In the modern investment landscape, data is the new wealth. Whether you’re a portfolio manager, financial analyst, or independent investor, success depends on turning financial data into meaningful insight. The Wealth Tech Dashboard in Excel is a ready-to-use analytical solution that helps you monitor investments, measure returns, and optimize portfolios — all inside a single, interactive Excel file.
Developed by NextGenTemplates.com, this dashboard blends the analytical power of Excel with financial intelligence. It’s designed to simplify wealth management by visualizing ROI, risk exposure, and investment performance across regions, products, and channels.
With dynamic visuals, slicers, and conditional formatting, you can analyze your entire wealth portfolio in real-time — helping you make smarter, faster, and more confident financial decisions.
⚙️ Key Features of the Wealth Tech Dashboard in Excel
📊 5 Analytical Pages: Overview | Investment Channel | Product Category | Region | Monthly Trends
🧭 Interactive Navigation Panel: Switch pages instantly from the left-side navigator.
💹 KPI Cards: Total Investment Amount | Active Investment % | ROI % | Satisfaction Rating.
📈 Dynamic Charts: View ROI % by region, product, or risk category.
📅 Time-Based Analysis: Track month-wise investment behavior and ROI trends.
🟢🔴 Conditional Formatting: Highlight growth or decline visually.
📂 Excel Automation: Pivot Tables + Slicers for instant data refresh.
💻 Fully Editable & Offline: No add-ins or coding required.
📊 Dashboard Structure and Pages
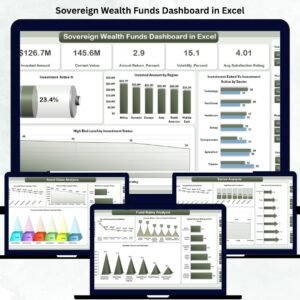
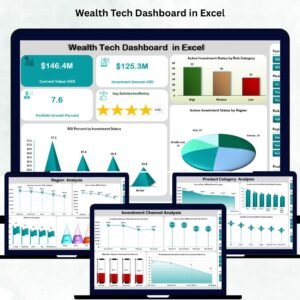
💡 1️⃣ Overview Page – Your Portfolio Snapshot

The control center of the dashboard featuring slicers for month, region, and category.
Includes:
-
4 KPI Cards (Total Investment, Active Investment %, ROI %, Satisfaction Rating).
-
Charts: Active Investment by Risk Category | ROI by Status | Active Investment by Region.
💡 Purpose: Get an immediate overview of portfolio health and risk distribution.
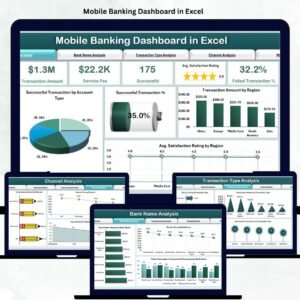
💼 2️⃣ Investment Channel Analysis Page
Understand how each investment channel performs — from mutual funds to real estate.
Charts Include:
-
Investment Amount by Channel.
-
Current Value by Channel.
-
High-Risk % by Channel.
-
Pending Review Status by Channel.
💡 Purpose: Spot the top-performing channels and rebalance weaker ones.
📦 3️⃣ Product Category Analysis Page
Analyze product-wise performance such as equity, debt, insurance, or ETFs.
Charts Include:
-
Current Value by Product Type.
-
Inactive Investment Status.
-
High-Risk Exposure %.
-
Investment Amount by Product Category.
💡 Purpose: Understand contribution and risk across product types.
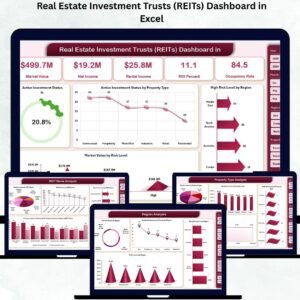
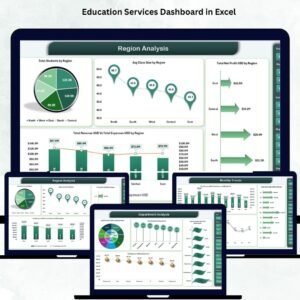
🌍 4️⃣ Region Analysis Page
Geographic performance analysis for global or regional investments.
Charts Include:
-
Investment Amount by Region.
-
Current Value by Region.
-
ROI % by region.
-
Active Investment % by region.
💡 Purpose: Identify profitable regions and reduce exposure to underperforming ones.
📅 5️⃣ Monthly Trends Page
Track performance month by month.
Charts Include:
-
Investment Amount by Month.
-
ROI % by Month.
-
Active Investment Status % by Month.
-
Average Satisfaction Rating by Month.
💡 Purpose: Visualize trends and forecast upcoming performance cycles.
🧾 Supporting Sheets
Data Sheet: Holds all raw investment data (ROI, risk type, region etc.) for automatic updates.
Support Sheet: Contains lookup tables and validation lists for slicers and dropdowns.
💡 Purpose: Keep data organized and ensure smooth refresh across all pages.
🌟 Advantages of Using the Wealth Tech Dashboard in Excel
✅ Centralized Investment Overview — All channels, regions & products in one file.
✅ Real-Time Insights — Auto-updating calculations and visuals.
✅ Risk Management — Track high-risk exposure by category or region.
✅ Performance Benchmarking — Compare ROI across channels and periods.
✅ Data Clarity — Visual trends replace complex tables.
✅ Professional Reports — Perfect for client presentations and reviews.
✅ Affordable Solution — All Excel-based, no software costs or subscriptions.
💡 Best Practices for Optimal Use
📅 Update data monthly or quarterly for accurate results.
📈 Use consistent naming for investment categories.
🔐 Protect formulas and backend sheets.
🟩 Apply conditional formatting for underperformance alerts.
⚙️ Automate data imports with Power Query or VBA.
📊 Review trends to optimize future allocations.
🧠 Who Can Use This Dashboard
💼 Wealth Managers & Advisors
🏦 Financial Consultants & Bankers
📈 Investment Analysts & Fund Managers
🏢 Corporate Finance Departments
💰 Independent Investors & Traders
🧩 Conclusion
The Wealth Tech Dashboard in Excel is your ultimate financial intelligence tool — blending automation, analytics, and visualization into one smart platform.
It centralizes all investment data to provide a clear picture of ROI, risk, and regional performance.
Whether you’re analyzing portfolios for clients or tracking personal investments, this dashboard helps you make data-driven decisions with confidence.
💰 Invest smarter. Measure better. Grow faster — with NextGen Templates’ Wealth Tech Dashboard in Excel.


Reviews
There are no reviews yet.