


Wealth management teams deal with constantly changing financial data—client portfolios, investment categories, risk profiles, monthly contributions, and AUM patterns. With markets fluctuating quickly, advisors need real-time, interactive, and reliable insights. The Wealth Management Dashboard in Power BI gives financial teams a complete, smart, and fast reporting solution.
This dashboard brings all important KPIs into a single Power BI file. It helps wealth managers track investment performance, portfolio categories, advisor productivity, client behavior, and monthly trends without navigating multiple spreadsheets. With clean visuals, drill-down analysis, and automated updates, the dashboard becomes a powerful companion for investment decisions.
Whether you manage a small financial advisory practice or a large wealth management company, this dashboard gives you actionable insights in seconds and helps clients make smarter financial choices.
📦 What’s Inside the Wealth Management Dashboard in Power BI
The dashboard contains five powerful analytical pages, each designed to offer deep clarity into wealth management performance. Every page uses slicers and interactive visuals to help users explore insights from different perspectives.
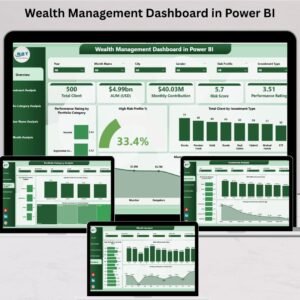
⭐ 1. Overview Page – Your Snapshot of Financial Health

The Overview Page is the starting point of the dashboard. It summarizes all major insights that matter to wealth managers.
This page includes:
✔ Four Key KPI Cards
-
Total Clients
-
High-Risk Profile %
-
Monthly Contribution
-
AUM (Assets Under Management)
These cards give a quick update on client count, risk exposure, and total investment volume.
✔ Four Detailed Charts
-
Performance Rating by Portfolio Category
-
High-Risk Profile %
-
Total Clients by Investment Type
-
Monthly Contribution by City
This page provides a fast, high-level overview that helps identify strong and weak areas instantly.
⭐ 2. Investment Analysis Page – Deep Investment Insights
Investments drive the success of wealth management operations. This page focuses entirely on performance across investment types.
Charts include:
-
Performance Rating by Investment Type
-
AUM (USD) by Investment Type
-
Monthly Contribution by Investment Type
These visuals reveal where money flows, which investment categories perform strongly, and how monthly patterns shift over time.
⭐ 3. Portfolio Category Analysis Page – Understand Portfolio Structures
Every portfolio category carries unique risk and return characteristics. This page helps managers compare client portfolios and segment performance clearly.
Charts include:
-
Total Clients by Portfolio Category
-
High-Risk Profile % by Portfolio Category
-
Monthly Contribution by Portfolio Category
This section helps teams detect risk-heavy categories, growth categories, and contribution patterns—key insights for strategic planning.
⭐ 4. Advisor Name Analysis Page – Track Advisor Productivity
Financial advisors play a crucial role in managing clients and growing AUM. This page provides advisor-level performance insights.
Charts displayed:
-
Diversification Score by Advisor
-
AUM (USD) by Advisor Name
-
Monthly Contribution by Advisor Name
These reports help leaders identify top advisors, guide underperformers, and optimize client distribution.
⭐ 5. Monthly Trends Page – Understand Seasonal & Market Behavior
Market behavior shifts every month. This page helps teams track monthly patterns and predict future investment trends.
Charts include:
-
High Risk Profile % by Month
-
AUM (USD) by Month
-
Monthly Contribution by Month
These insights highlight seasonal variations, growth months, risk spikes, and performance cycles. It becomes essential for monthly reviews and financial planning.
👥 Who Can Benefit from This Wealth Management Dashboard in Power BI
This dashboard is ideal for:
-
💼 Wealth Management Firms
-
📊 Financial Advisors
-
🧾 Investment Analysts
-
🧮 Financial Consultants
-
🏦 Portfolio Managers
-
👥 Relationship Managers
-
💻 Private Banking Teams
Any professional who handles client portfolios or investment reporting can use this dashboard to enhance decision-making and client service.
### 📘 Click here to read the Detailed Blog Post
### 📺 Visit our YouTube channel to learn step-by-step video tutorials:
👉 Youtube.com/@PKAnExcelExpert


Reviews
There are no reviews yet.