Water is one of the most critical and limited resources for industries, municipalities, utilities, campuses, and commercial facilities. Rising water costs, sustainability commitments, and regulatory pressure make it essential for organizations to monitor water usage accurately and continuously. However, when water consumption data stays scattered across meters, reports, and spreadsheets, teams struggle to identify inefficiencies and control waste.
That is exactly why the Water Usage Efficiency KPI Dashboard in Google Sheets becomes a powerful and practical solution.
This ready-to-use dashboard helps organizations track water consumption, efficiency ratios, losses, and conservation performance in one centralized and visual system. Instead of manually compiling reports, teams gain instant visibility into water usage trends, target achievement, and year-over-year performance. With automated calculations, interactive KPIs, and clear performance indicators, this dashboard turns raw water data into actionable insights.
Because the dashboard is built entirely in Google Sheets, it is cloud-based, collaborative, easy to use, and cost-effective—without requiring expensive BI or sustainability software.
✨ Key Features of the Water Usage Efficiency KPI Dashboard in Google Sheets
💧 Centralized Water Usage Monitoring
Track all water consumption and efficiency KPIs in one structured dashboard instead of multiple reports.
🎯 MTD & YTD Performance Tracking
Monitor Month-to-Date and Year-to-Date water usage with automatic calculations.
📊 Target vs Actual & Previous Year Comparison
Compare actual water usage against targets and previous-year benchmarks to identify inefficiencies early.
🚦 Visual Performance Indicators
Conditional formatting arrows highlight performance instantly:
-
Green arrow → improved efficiency
-
Red arrow → higher usage or inefficiency
☁️ Cloud-Based Collaboration
Facilities, sustainability, and operations teams can update and review data together in real time.
📦 What’s Inside the Water Usage Efficiency KPI Dashboard in Google Sheets
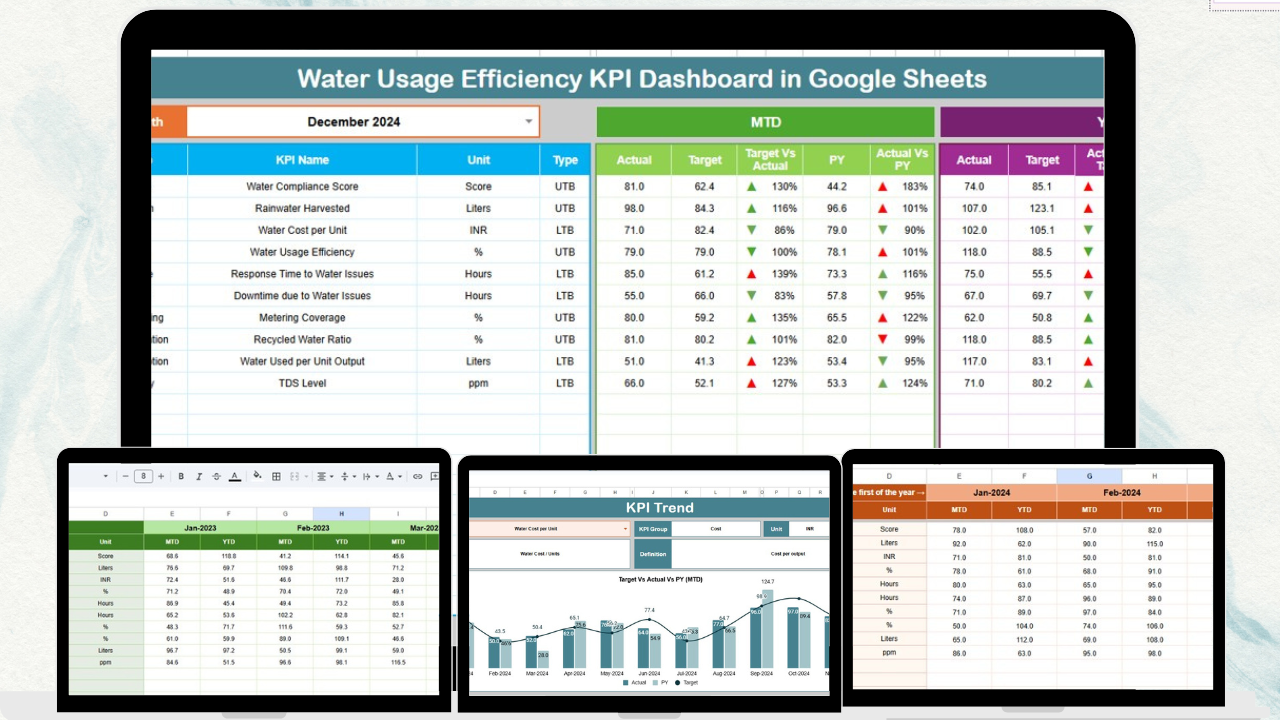
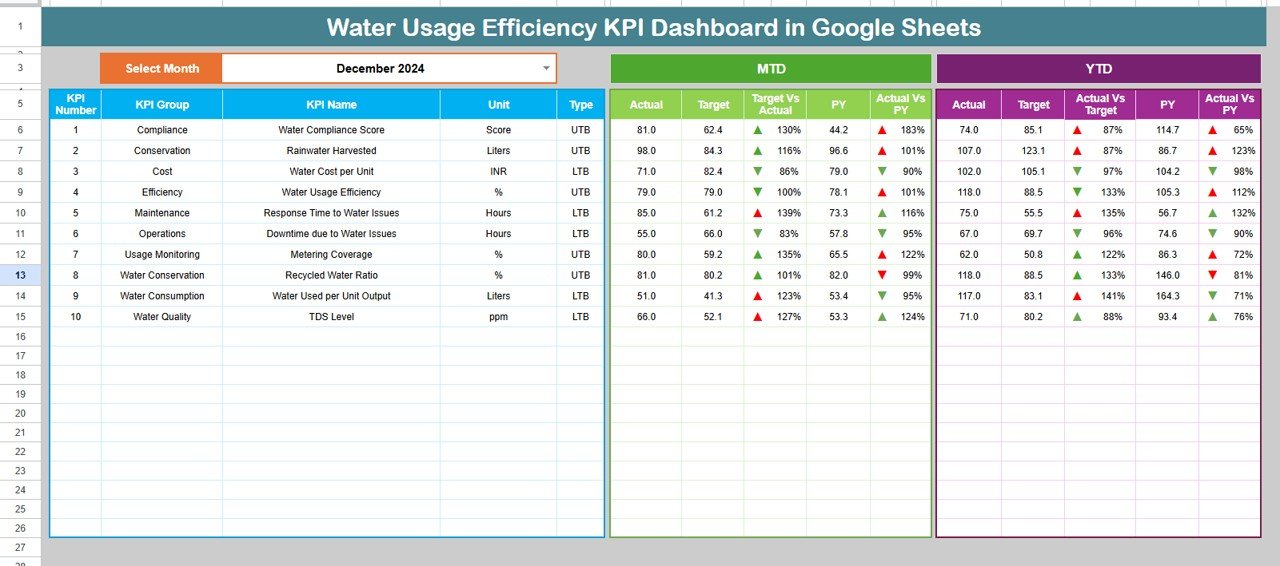
🖥️ Dashboard Sheet Tab (Main Page)
This is the primary view for management and sustainability reviews.
You select the reporting month from the dropdown in cell D3, and the entire dashboard updates automatically.
It displays:
MTD Metrics
-
Actual
-
Target
-
Previous Year
-
Target vs Actual
-
Previous Year vs Actual
YTD Metrics
-
Actual
-
Target
-
Previous Year
-
Target vs Actual
-
Previous Year vs Actual
This view allows decision-makers to quickly assess water efficiency performance.
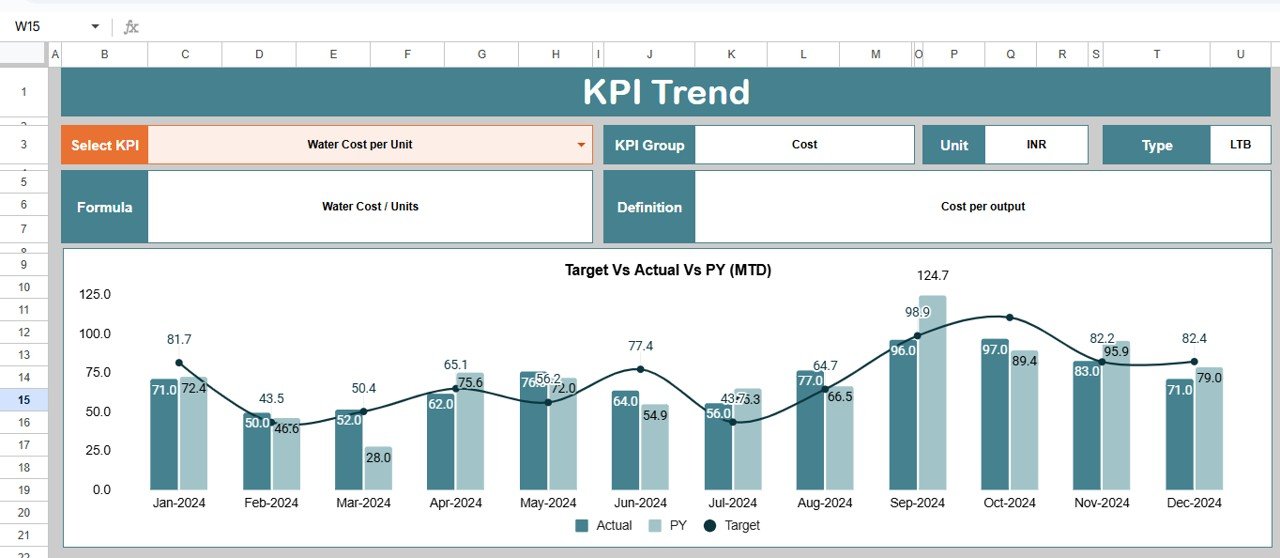
📉 KPI Trend Sheet Tab
This sheet focuses on detailed KPI-level analysis.
Select a KPI from the dropdown in cell C3, and the sheet displays:
-
KPI Group
-
KPI Unit
-
KPI Type (Lower the Better / Upper the Better)
-
KPI Formula
-
KPI Definition
Month-wise trend charts help identify seasonal usage patterns, leaks, or inefficiencies.
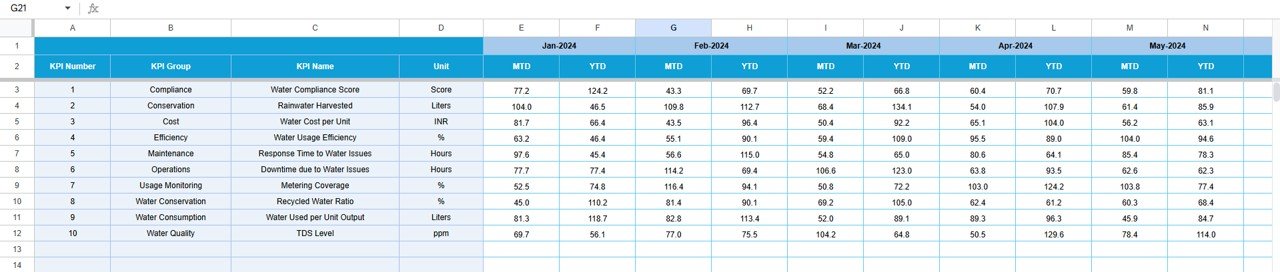
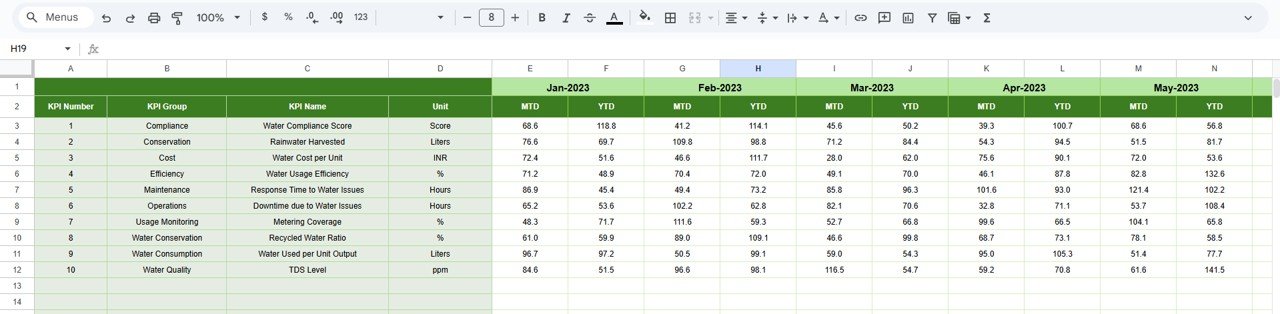
📋 Actual Number Sheet Tab
This sheet stores actual water usage data.
-
Select the first month of the year in cell E1
-
Enter monthly MTD and YTD actual values
-
All dashboard visuals update automatically
This ensures consistent and accurate reporting.
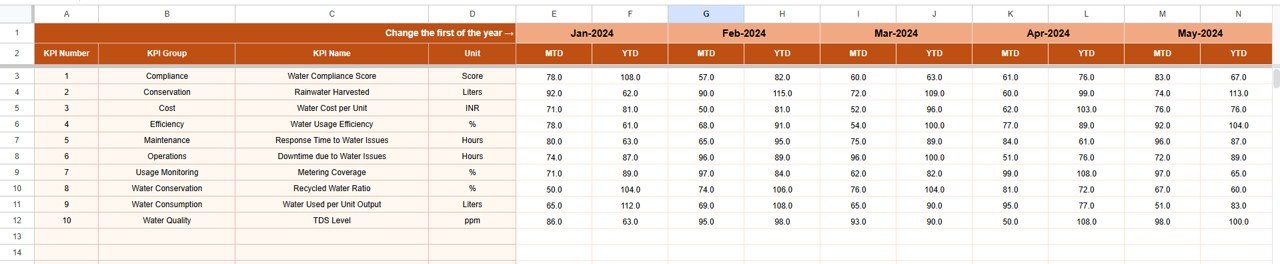
🎯 Target Sheet Tab
This sheet captures planned or benchmark water usage values.
Targets help organizations:
-
Define water conservation goals
-
Measure efficiency improvements
-
Drive continuous sustainability initiatives
📆 Previous Year Number Sheet Tab
This sheet stores last year’s water usage data.
It enables:
-
Year-over-Year efficiency comparison
-
Long-term trend analysis
-
Sustainability and ESG reporting
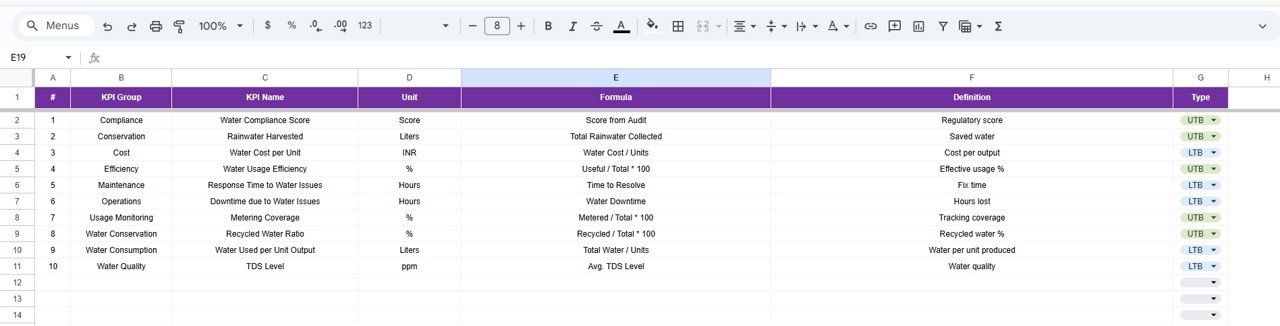
📘 KPI Definition Sheet Tab
This sheet acts as the reference library for all water efficiency KPIs. It includes:
-
KPI Name
-
KPI Group
-
Unit
-
Formula
-
KPI Definition
-
KPI Type (LTB / UTB)
It ensures clarity and consistency across teams.
🎯 Who Can Benefit from This Water Usage Efficiency KPI Dashboard
🏭 Facilities & Utilities Teams
Monitor water consumption, losses, and efficiency clearly.
🌱 Sustainability & ESG Managers
Track water conservation performance and compliance metrics.
🏢 Manufacturing Plants & Campuses
Control operational water usage and identify waste.
📊 Management & Leadership
Review water efficiency performance without complex tools.
🚀 Organizations with Multiple Locations
Standardize water reporting across sites.
### Click here to read the Detailed blog post
Watch the step-by-step video tutorial:


Reviews
There are no reviews yet.